Kinematics of ionized and molecular hydrogen in the core of M100
Abstract
We present high angular and velocity resolution two-dimensional kinematic observations in the spectral lines of H and CO of the circumnuclear starburst region in the barred spiral galaxy M100, and compare them with kinematics derived from our previously published numerical modeling. The H data, fully sampled and at sub-arcsecond resolution, show a rotation curve that is rapidly rising in the central 140 pc, and stays roughly constant, at the main disk value, further out. Non-circular motions are studied from the H and CO data by detailed consideration of the velocity fields, residual velocity fields after subtraction of the rotation curve, and sets of position-velocity diagrams. These motions are interpreted as the kinematic signatures of gas streaming along the inner part of the bar, and of density wave streaming motions across a two-armed mini-spiral. Comparison with a two-dimensional velocity field and rotation curve derived from our 1995 dynamical model shows good qualitative and quantitative agreement for the circular and non-circular kinematic components. Both morphology and kinematics of this region require the presence of a double inner Lindblad Resonance in order to explain the observed twisting of the near-infrared isophotes and the gas velocity field. These are compatible with the presence of a global density wave driven by the moderately strong stellar bar in this galaxy. We review recent observational and modeling results on the circumnuclear region in M100, and discuss the implications for bar structure and gas dynamics in the core of M100 and other disk galaxies.
keywords:
Galaxies: individual (M100=NGC 4321) – galaxies: ISM – galaxies: kinematics and dynamics – galaxies: spiral – galaxies: structure – radio lines: galaxiesand
VolJourn. Date \articleidstart pageend page \paperidmanuscript id \cprighttypeyear \ccccode \leftheadKnapen et al. \rightheadKinematics in the core of M100
Accepted for publication in the Astrophysical Journal, Volume 528 (Jan 1, 2000)
1 Introduction
The dynamics of circumnuclear regions (CNRs) is much more intricate than the large-scale dynamics in disk galaxies. This complexity is due to a variety of different factors, most notably (1), gas inflow and modification of mass distribution towards the center due to gravitational torques from bars and other non-axisymmetries; (2), progressively increasing dynamical importance of gas within the central few hundred pc (not only for star formation), compared with the rather passive role it plays elsewhere; (3), formation of a multiple resonance zone in the CNR which is sensitive to the varying underlying gravitational potential; and, if appropriate, (4), nuclear activity induced by the above dynamical processes.
Studies of the CNRs in disk galaxies are aimed at understanding the causal relationship between galactic disks and their central activity, both stellar and nonstellar. Observational and theoretical evidence points towards the possibility that galaxies modify their mass distribution on timescales short compared with the Hubble time (Friedli & Martinet 1993; Berentzen et al. 1998). Redistribution occurs as a result of intrinsic processes and also external interactions which lead to gravitational torques acting on the gaseous and stellar disk components (e.g., Combes 1988; Shlosman 1990; Zhang 1996).
Barred galaxies are examples of such dynamical and secular evolution. They often experience starburst activity in their CNRs, with star formation (SF) sites delineating nuclear rings within the central kpc (see reviews by Kennicutt 1994; Buta & Combes 1996). High-resolution imaging in the H emission line and at other wavelengths usually brings out these structures consisting of molecular, atomic and ionized gas and newly born stars, frequently subject to dust extinction.
Cores of disk galaxies are places where resonances between stellar orbital precession rates and pattern speeds of bars and ovals occur, at about the rotational velocity turnover radius (e.g., Shlosman 1999 for a recent review). The number of such inner Lindblad resonances (ILRs) depends on the shape of the rotation curve, determined by the axisymmetric part of the gravitational potential. If conditions for one or two ILRs exist, they have a rather dramatic effect on the gas response, i.e., forcing the gas streamlines to intersect and form pairs of shocks. The radial gas inflow towards the center slows down, leading to gas accumulation inside the outer ILR and to an increase in the SF activity there (Schwarz 1984; Combes & Gerin 1985; Shlosman, Frank & Begelman 1989; Knapen et al 1995a,b). In other words, the inner resonances are precursors to the nuclear ring phenomenon. The evolution of the CNRs depends on a number of factors, such as the rate of gas inflow along the stellar bar, the efficiency of SF in the nuclear rings, and the dynamical importance of gas accumulating there. Self-gravity in the gas triggers SF in the nuclear rings and plays a major role in their dynamical stability. More importantly, it also governs the rate of gas “filtering” across the resonance region (Shlosman, Begelman & Frank 1990; Elmegreen 1994; Knapen et al. 1995b). Observational testing of theoretical predictions of gas kinematics in the CNRs of disk galaxies is, therefore, of prime importance.
M100 has been classified by de Vaucouleurs et al. (1991; hereafter RC3) as .SXS4. We have taken its distance as 16.1 Mpc (Ferrarese et al. 1996), so that corresponds to parsec in the plane of the galaxy. This work focuses on observations and interpretations of the two-dimensional CNR gas kinematics in M100 (=NGC 4321), a galaxy with a bar of moderate strength. The observations are performed in the spectral lines of H and CO , using Fabry-Pérot and molecular interferometry techniques to achieve high angular and velocity resolution. Our results are combined with high-resolution optical and NIR -band imaging and dynamical modeling of this CNR (Knapen et al. 1995a,b; Shlosman 1996). The NIR core morphology in M100 (Knapen et al. 1995a; Ryder & Knapen 1999; see also Fig. 8) is that of a stellar bar encircled by a radius annular star formation zone. The bar re-emerges at larger radii outside the ring. The NIR isophotes are twisted in the CNR, by about 50∘, in the leading direction (to the bar) and back. A pair of short leading armlets is visible at the ends of the observed inner bar structure. The circumnuclear SF occurs at the inner ILR (IILR), as indicated by the NIR morphology and supported by our modeling (Knapen et al. 1995b). The morphology in H (reproduced in Fig. 7) and blue light is strikingly different from that in the NIR with the maxima of SF delineating a tightly wound spiral structure, flanked by dust lanes, which connect outward through the bar and to the main spiral arms in the disk. In , the outer incoming spiral arms are hardly discernible, and the inner star-forming structure, though detectable (Ryder & Knapen 1999), is much less prominent.
The CNR of M100 was previously observed in detail using different techniques. Broad-band optical morphological observations were first presented by Morgan as long ago as 1958, and M100 figured in Sersic & Pastoriza’s (1967) list of circumnuclear “hot spot” systems. Similar observations in H are given by Arsenault et al. (1988), Pogge (1989), Cepa & Beckman (1990), Knapen et al. (1995a) and Knapen (1998).
Previous kinematical studies include that of Arsenault et al. (1988) in H, and interferometric observations in the CO transition by Rand (1995), Sakamoto et al. (1995), and García-Burillo et al. (1998). Numerical modeling to account for the observed structure and kinematics has been performed by Knapen et al. (1995b), Wada, Sakamoto & Minezaki (1998), and García-Burillo et al. (1998). We shall deal comparatively with recent modeling, including our own, and relate the observed kinematics presented here with the models in Section 7.
M100 has received much observational and theoretical attention, not only because it is one of the closest Virgo cluster galaxies, so its structure can be well analyzed observationally, but also because its bar of moderate strength gives rise to a particularly clear resonant circumnuclear structure. Similar phenomenology is now recognized to be fairly common in barred spirals, as reviewed by Buta & Combes (1996), and shown in papers by, e.g., Pogge (1990), Maoz et al. (1996), Planesas, Colina & Pérez-Olea (1997), Elmegreen et al. (1997), Laine et al. (1999), and Pérez-Ramírez et al. (1999, in preparation).
This paper is structured as follows. New observations of the CNR in M100 are presented in Section 2, and the CNR morphology in H and CO is discussed in Section 3. Circular and non-circular motions in the observed region are analyzed in Sections 4 and 5, respectively. Section 6 deals with the relevant results of numerical simulations and Section 7 compares the simulations with observations, and our interpretation with previously published studies. Conclusions are given in the last Section.
2 Observations
2.1 H
We used the TAURUS II instrument in Fabry-Pérot (FP) mode on the 4.2m William Herschel Telescope on La Palma during the nights of May 10 and 11, 1995. We windowed the TEK CCD camera to a size of pixels of 0.28 arcsec pixel-1. The night was photometric with seeing. We observed two different parts of the disk of M100, making sure that the central region of the galaxy was present in both data sets.
The raw observations consist of a series of images at different wavelengths, covering the H line emission from the galaxy. The appropriately redshifted narrow band H filter (Å, Å, using the galaxy’s systemic velocity ; RC3) was used as an order-sorting filter. We performed wavelength and phase calibration by observing a calibration lamp before and after each science exposure. We subtracted the background sky value from each separate plane, and shifted the planes to the same position using fits to foreground stars, before correcting the raw data set using the taucal software package. This produced two data cubes of pixels 55 “planes” in wavelength, separated by some 0.34 Å, or 15.7 km s-1. We adopted a systemic velocity of following the RC3, even though other determinations in the literature (e.g. Knapen et al. 1993) give different values. Since this is a constant offset the choice of will not have any influence on our results. Rozas et al. (1998) used the same data set to determine velocity dispersions for some 200 H ii regions across the face of the galaxy.
We combined the information on the central region of M100 from the two individual data sets by cutting the region of overlap, of size pixels, from each cube, placing the sub-cubes at the same grid position using fitted positions of foreground stars in the original cubes, and of the nucleus of the galaxy, and averaging the individual planes in the data cubes. The spatial resolution of the resulting data set is 07 . Astrometry was performed comparing the positions of foreground stars and bright H ii region in the FP data sets to their positions in the larger-scale H image of M100 from Knapen (1998).
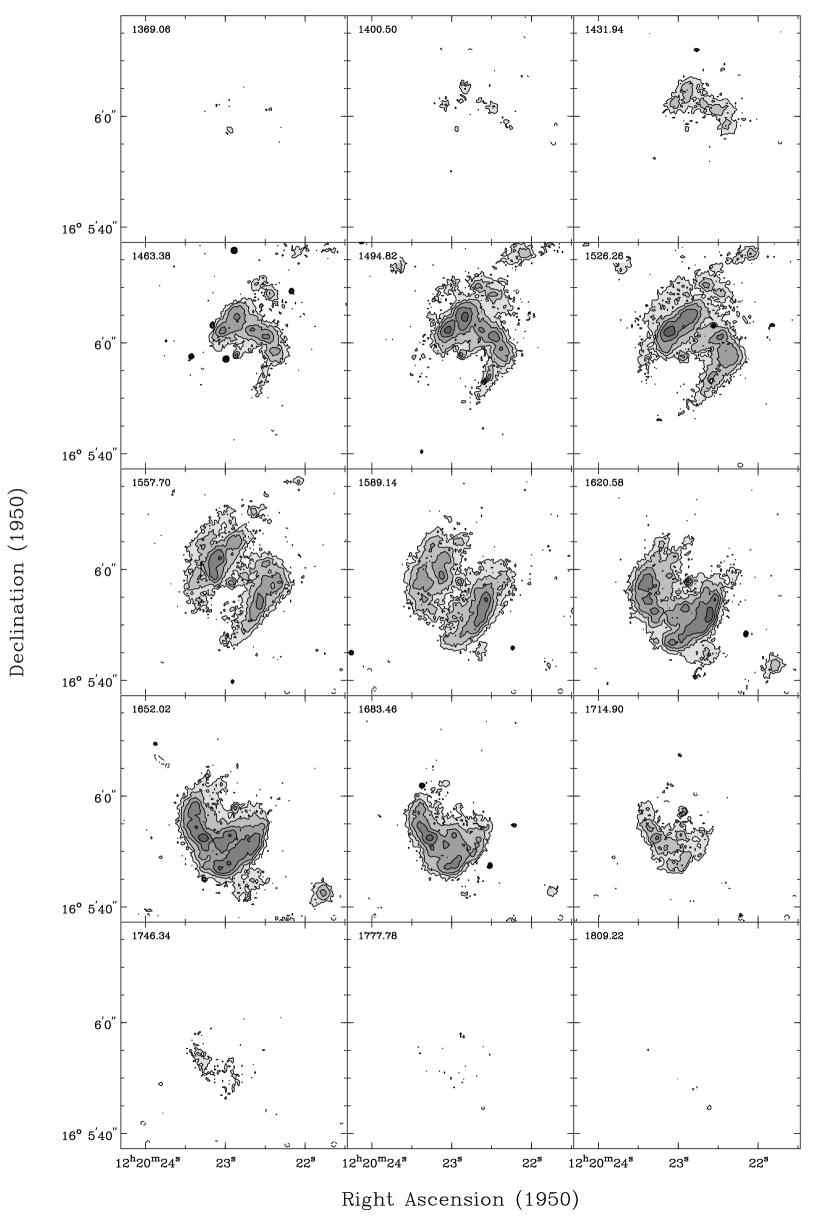
We determined which channels of the data set were free of H line emission after smoothing it to a resolution of . Subsequently, we subtracted the continuum emission after fitting the continuum to the 15 line-free channels on either side of the data cube. The H emission as a function of increasing wavelength, or velocity, is shown in a way equivalent to the standard channel maps in radio astronomy in Fig. 1.
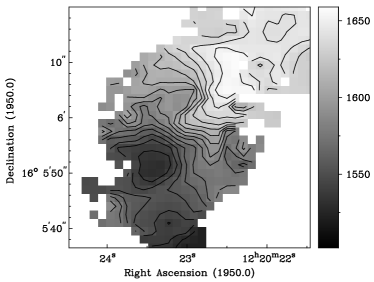
We have performed a moment analysis in the central region of M100, and show the resulting velocity field (moment one map) in Fig. 2. The individual H profiles over all but the very innermost () region are well suited for a moment analysis, double-peaked profiles being practically absent. The detailed procedure used to produce the moment maps is described in Knapen (1997). The total intensity H map (moment zero) as derived from the FP observations is shown in Fig. 10a. It is comparable in quality to the narrow-band H image published by Knapen et al. (1995a, see also Knapen 1998), with an estimated spatial resolution of 06 – 07 .
In order to check aspects of the distribution and kinematics of the ionized gas directly with those of the molecular gas, we produced an H data set with the spatial resolution of the CO data () by convolving the original data cube with the appropriate Gaussian. Subsequent analysis of this smoothed data set was in all cases completely analogous to that of the full resolution data set.
2.2 CO
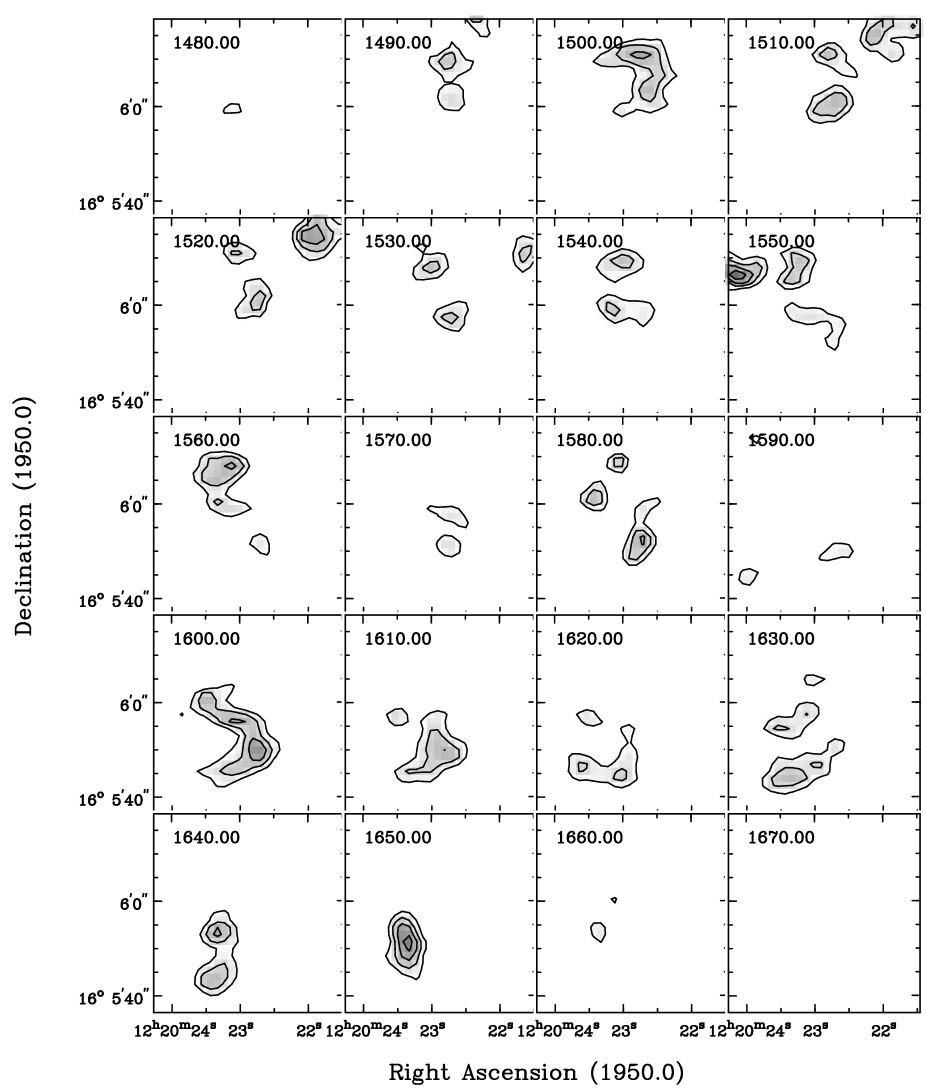
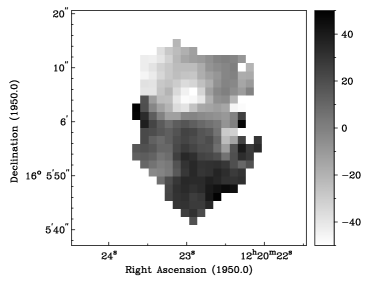
The CO observations used are those described by Rand (1995), who observed the central region of M100 with the BIMA111Operated by the University of California, Berkeley, the University of Illinois, and the University of Maryland, with support from the National Science Foundation interferometer in the CO transition. Channel maps of the CO data in the CNR of M100 are shown in Fig. 3. We re-analyzed some of these data, concentrating on the gas kinematics in the CNR. We first removed noise peaks outside the area where CO emission is expected by setting pixel values at those positions to a “blank” value. This was done interactively by inspecting the individual channel maps, continually comparing with the same and adjacent channels in a smoothed data cube, in a way similar to the procedure described by Knapen (1997). This new data set was used to calculate the total intensity and velocity moment maps. The resulting moment images show the same structure as published by Rand (1995) but are somewhat more sensitive in the central region. We show the velocity field thus produced, overlaid on a grey-scale representation of the total CO intensity, in Fig. 4. The spatial resolution in the CO data set is (PA 88∘), the channel width is 5 km s-1, and the channel noise is about 40 mJy beam-1.
We detect 244 Jy km s-1 (), which is 40% of the flux measured by Kenney & Young (1988) within the central 45′′, of Jy km s-1. Using a standard conversion factor, which may well not hold in this environment (e.g. Rand 1995), our flux would correspond to a mass of about M⊙, and gas surface densities for four individual clumps in the CNR to M⊙ pc-2. Presumably due to a different resolution and/or calibration, Sakamoto et al. (1995) find somewhat higher densities, which they estimate to exceed the critical density for nuclear ring fragmentation (the Toomre criterion). However, uncertainties not only in the CO to H2 conversion factor, but also in the estimates for the epicyclic frequency and the dispersion velocity of molecular clouds in the ring, most likely far outweigh the difference between the observed gas surface density and the estimated critical density, and we therefore do not attempt a similar analysis here.
3 Core Morphology
3.1 H
The H morphology of the CNR in M100 is that of an incomplete ring extending from 7.5′′ to 20′′ from the center; it has been described in detail by Knapen et al. (1995a,b). We summarize only the most important features here, which can all be recognized in the total intensity H image (Fig. 10a). The nuclear ring emits about 16% of the total H emission from the galaxy. Knapen (1998) catalogues almost 2,000 separate H ii regions across the galaxy, of which only 99 are found in the CNR, predominantly bright ones. Crowding is a problem which leads to an underestimate of the number of, especially less luminous, H ii regions in the CNR, but it is clear that a relatively large amount of H emission is produced in a small volume, directly indicating a high rate of massive SF. The SF in the nuclear ring is organized into four complexes corresponding to the maxima of the gas compression at the “twin peaks” at the bar’s minor axis, and at the ends of a pair of small spiral armlets at the bar’s major axis. These four complexes of SF were identified by Knapen et al. (1995a; their fig. 1c), and shown to be heavily biased towards the position of the IILR, where the gas is prone to local Jeans instabilities (Knapen et al. 1995b).
3.2 Molecular gas
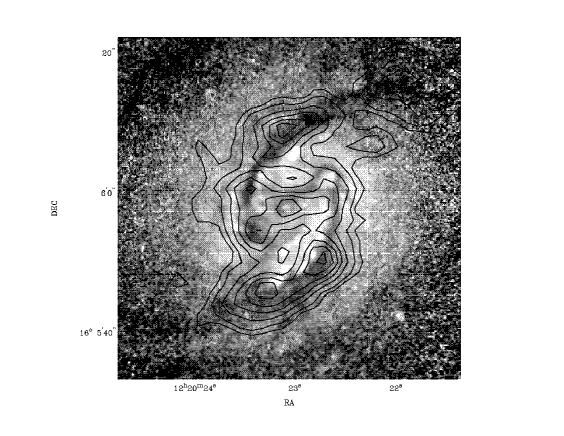
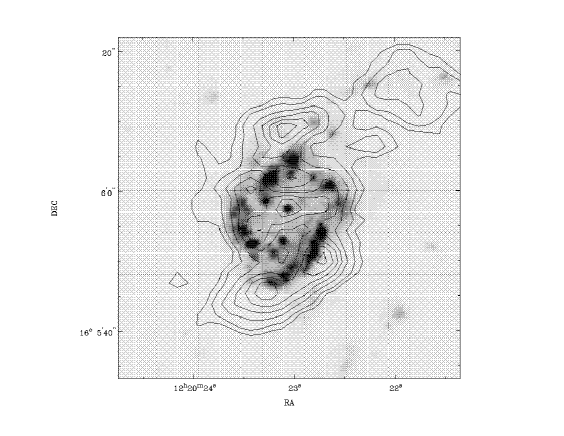
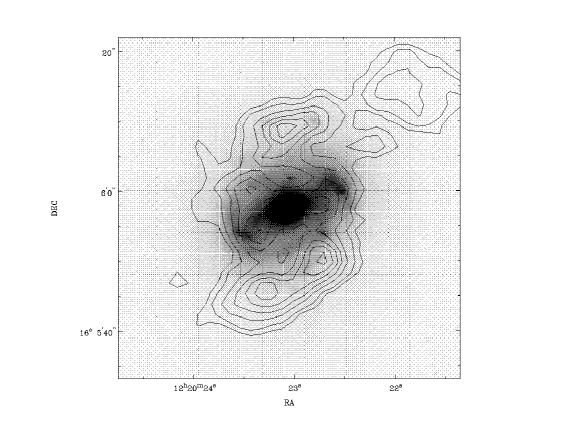
The distribution of molecular gas in the CNR of M100 has been described by Rand (1995) and by Sakamoto et al. (1995), while Knapen et al. (1995b) showed older CO data of Canzian (1990), at lower resolution, and compared its distribution with optical-NIR tracers. In Fig. 4 we present the CO total intensity and velocity distributions as obtained from the re-analyzed Rand (1995) data, and in Figs. 5, 6 and 7 the CO distribution is overlaid on (from Knapen et al. 1995a), H (as in Fig. 10a) and (Knapen et al. 1995a) images. The basic notions are clear from this collection of images: the CO is distributed along two spiral arms, coinciding with the dust lanes along the SF spiral arms as seen in H. The CO along the arms is clumpy, with a local maximum of CO emission centered on the nucleus. The CO spiral arms follow the dust lanes out into the large-scale bar, and into the disk of the galaxy (Rand 1995). Our new map confirms observations and numerical simulations by Knapen et al. (1995a,b) that there are local CO peaks located slightly upstream from the four main maxima of SF (upstream in this context means counterclockwise, assuming that the disk and CNR spiral arms are trailing). This is also supported by Sakamoto et al. (1995).
The pair of leading arms, observed in inside the star-forming ring-like region by Knapen et al. 1995a, is visible in the CO morphology. These leading arms are also visible in the CO maps published by Rand (1995) and García-Burillo et al. (1998), in both cases more clearly on the west than on the east side of the nucleus. As explained in Knapen et al. (1995a,b) such leading arms are signatures of a double ILR and are not expected under any different circumstances. The -band image of Ryder & Knapen (1999), of much better angular resolution than the original image in Knapen et al. (1995a), confirms the existence of the leading armlets. The suggestion by García-Burillo et al. (1998) that their appearance is at least partly a result of dust extinction effects is not supported, because these authors publish nor their map, nor the images resulting from the exinction correction based upon it. Knapen et al. (1995a) explained in detail the procedure used to correct the -image for extinction by cold dust, and the underlying assumptions. This exercise resulted in a clearer rather than less obvious view of the leading arms, as well as of the peaks of SF, K1 and K2 (fig. 1d of Knapen et al. 1995a). The leading arms are part of the general twisting of NIR isophotes by an angle of in the leading direction (to the bar) and back.
4 Kinematic results: circular motions
4.1 H
The velocity field of the central region (Fig. 2) shows the basic “spider” pattern indicating circular motions in a rotating disk, with rapidly increasing rotation velocities, but also important deviations from circular velocities. The first effect to note specifically is the S-shaped deviation of the iso-velocity contours near the minor axis, indicating gas streaming along the inner part of the bar. Another important deviation in the velocity field is due to a bar-induced spiral density wave, and seen most clearly toward the NE and SW of the nucleus, at radii of some 9′′. These deviations from circular motions are discussed in detail below (Sect. 5).
In order to describe the circular motions we have derived rotation curves from the H velocity fields at both full ( 07 ) and low (as in CO) resolutions. The exact procedure used is based on the one described by Begeman (1989; see also Knapen 1997). In short, parameters describing the galaxy’s velocity field in terms of a set of concentric rings are fitted to the data using a least-squares algorithm. In the fit, we fixed the position of the center, and the inclination angle (at ). The fits are robust against changes in the central position, but fixing the central position after having determined it in preliminary fits increased the accuracy of the rotation curve fit. The astrometry of the H data set is not good enough to give an accurate kinematic central position, however, the kinematic and morphological center positions as determined from the H data agree to within the errors. We adopted a value for the inclination of the inner disk very close to the one used in our previous H i study of the main disk of the galaxy (Knapen et al. 1993), in the absence of evidence to the contrary. Data points within 30∘ of the minor axis were excluded from the fits.

The rotation curve was fitted at 05 intervals in radius from the center to a radius of 18′′. The fitted values for the major axis position angle and the circular velocity are presented as a function of radius in Fig. 8. The fitted value for the systemic velocity of the galaxy reproduces, within the errors of the fit, the value introduced during the calibration of the data. Using exactly the same parameters we also fitted a rotation curve to the smoothed data set, at resolution. This curve, and the radial run of , are also shown in Fig. 8.
The rotation curve at full resolution shows a very steep rise (to almost in 2′′, or pc), which must in fact be a lower limit to the true rise of the rotation velocities due to the fitting algorithm used (see, e.g., Sofue et al. 1997). We checked whether this steep rise could be due to the instrumental effect of less than perfect continuum subtraction in the nuclear region (which shows up to some degree in the original data) by setting the data values in the central and radius to “blank” in the continuum-subtracted data set, and producing new versions of the first moment (velocity) map and rotation curve fit. In both cases the rise of the rotation curve did not get shallower (it steepened within the errors of the fit in the 2′′ case) and, therefore, the steep rise observed is not due to instrumental effects. It corresponds to the equivalent of a spherically distributed mass of within the inner 140 pc (in agreement with results obtained by Sakamoto et al. 1995).
The observed H rotation curve reaches a local maximum at around at a radius of , the radial range where the bulk of the H emission from the spiral armlets is found. The drop in at larger radii occurs where the density wave streaming motions are strongest (Fig. 2, see also Sect. 5) and is in fact a result of the noncircular motions. The position angle of the major axis is for radii over 6′′, just a few degrees different from the disk value of derived from H i aperture synthesis observations (Knapen et al. 1993).
The rotation curve derived from the resolution velocity field confirms the above findings. Differences are due to the lower angular resolution: the initial rise is slower and the peak at ′′ has slightly shifted.
In Fig. 10d we show a position-velocity (LV) diagram of the full-resolution H data along the major axis. A series of six different slices were produced from the cube, offset by half a resolution element ( 04 ) and parallel to the major axis. These six slices were then median-averaged to produce the LV-diagram shown. The diagram shows the original data, without any profile or ring fitting such as done in the process of producing the rotation curve, yet it confirms the main findings from our rotation curve analysis, as described above.
4.2 CO
We also derived a rotation curve from the CO velocity field, using the same procedure as for the H. However, due to the different characteristics of the data set, we excluded data points within 20∘ from the minor axis, fixed the position angle of the major axis as , and calculated rotation curve data points with 15 spacing in radius. The resulting rotation curve is shown in Fig. 8, compared to the H rotation curve at similar spatial resolution to the CO, as derived in the previous section.
There are two very notable differences between the CO and H rotation curves: the CO curve rises much more slowly than the H curve and reaches much lower maximum “circular” velocities. These differences are largely due to spiral arm streaming motions (discussed in Sect. 5) in combination with the offset of the CO and H inner spiral arms. In particular, examination of a difference map of the two velocity fields (Fig. 9, where this map is shown along with the CO velocity field at the same scale) shows that the main region of discrepancy is close to the beginning of these two arms where they join onto the inner bar (i.e., inside the nuclear ring), within about 60 degrees of the minor axis. Two major SF regions are found here. In these regions the CO and H velocities differ by about in the plane of the galaxy. Since both CO and H measure basically gas dynamics (H because the young massive stars that cause the ionization of the hydrogen are still on the gas orbits of their parent molecular clouds), the observed differences are most probably due to the different spatial distributions of the emission.
To demonstrate this effect, we compare rather extreme rotation curves, formed by excluding points less than 75∘ from the minor axis. The result for CO is shown in Fig. 8; the result for H is very similar to the whole-disk rotation curve in Fig. 8. With the combined influence of the streaming motions and spatial offsets minimized, the rotation curves show much better, although still not perfect, agreement.
This effect of streaming motions on rotation curves was also noted for M51 by Rand (1993). It highlights the difficulties in deriving a correct axisymmetric rotation curve when strong streaming is present and emission is biased to a small range of spiral phase. As discussed further below, these difficulties have important implications for the use of rotation curves in the derivation of galactic potentials for subsequent modeling.
5 Kinematic results: deviations from circular motions
In order to demonstrate the nature of the streaming motions observed in CO and H, we use three different techniques. Firstly, (Sect. 5.1) a mostly qualitative description of the velocity fields, secondly (Sect. 5.2) a study of residual velocity fields obtained after subtracting a two dimensional version of the rotation curve from the observed velocity field (most useful for the H data), and thirdly (Sect. 5.3) an analysis of series of position-velocity diagrams along and parallel to the inner bar minor axis (most useful for the CO data).
5.1 Velocity fields
From the velocity maps in H and CO (Figs. 2, 4) one can easily recognize deviations from circular motions due to two distinct dynamical processes: spiral density wave streaming motions associated with the armlets and gas motions along the inner part of the bar at smaller radii.
Density wave streaming motions are recognizable in the deviations from the regular shape of the velocity contours (isovels), especially toward the NE and SW of the nucleus near radii of some , and most clearly in H due to the higher resolution. They are strongest where we previously inferred the position of the incoming spiral arms, just outside the well-defined dust lanes (Knapen et al. 1995a,b; this is also just outside the radius of the strong H-emitting regions lying along the inner bar’s minor axis, as can be best seen in a comparison of Fig. 2 and Fig. 10a). Although the signature of the streaming motions is most obviously visible near the minor axis of the galaxy, they can in fact be recognized consistently out to some 60∘ on either side of the minor axis. As estimated from the H velocity contours, the (projected) excess or streaming velocities are of the order of 40 km s-1. This kinematic detection confirms that indeed the incoming spiral arms are part of the grand-design density wave system and not a collection of flocculent spiral arm fragments (as proposed by Pogge 1989 and Cepa & Beckman 1990).
In the central ′′, again seen most clearly in H but also in CO, the isovels do not run parallel to the minor axis as would be the case for purely circular motions, but show a deviation characteristic of gas streaming along the preferred major axis of the bar, as expected (Roberts, Huntley & van Albada 1979) and observed (e.g. Bosma 1981) in barred galaxies. The deviations seen here in H and CO occur on the scale of the inner bar-like feature as seen in the NIR, and are confirmed by the numerical modeling (see Sect 6).
The deviations from circular motion due to both the spiral arms and inside the nuclear ring have been found in CO and briefly described by Rand (1995) and Sakamoto et al. (1995). The spiral arm streaming motions can also be seen in the CO map of García-Burillo et al. (1998), and are mentioned briefly by these authors. Arsenault et al. (1988) noted these streaming motions in their H Fabry-Pérot velocity field, although the spatial resolution of their data was not adequate to observe any details.
5.2 Residual velocities
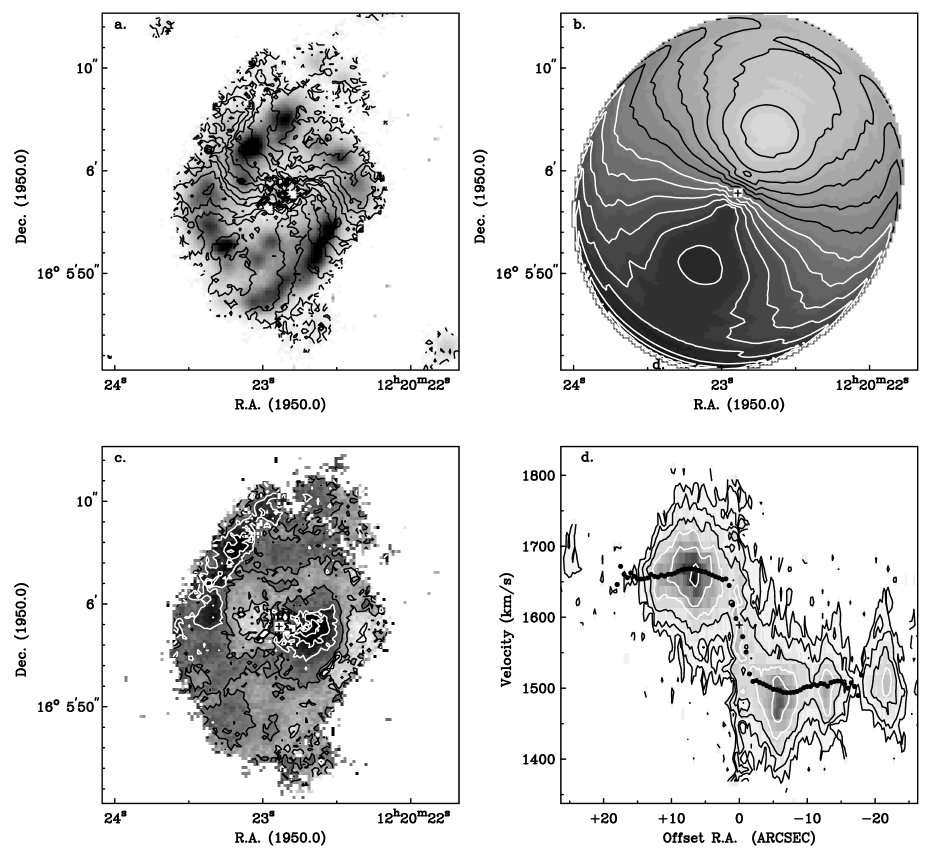
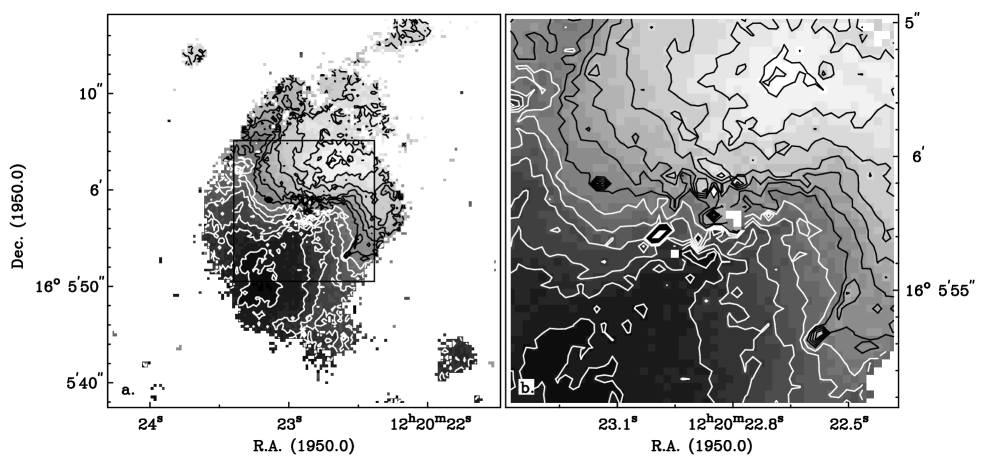
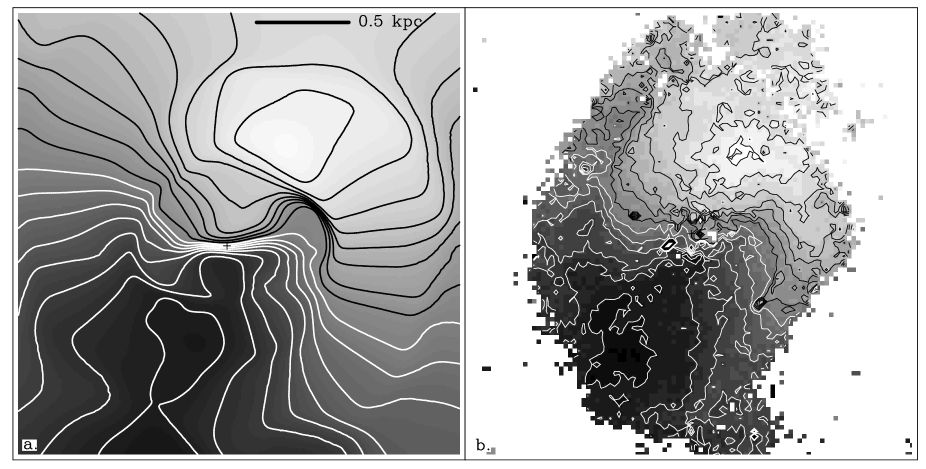
One of the most direct ways to demonstrate the position and amplitude of deviations from circular motion is by converting the derived rotation curve into a two-dimensional axisymmetric velocity model (shown for H in Fig. 10b), and subtracting it from the observed velocity field (Fig. 10a). The residual H velocity field thus obtained (Fig. 10c) shows qualitatively where non-circular motions occur, and where they are strongest. A problem with this approach is that each point on the rotation curve is produced by azimuthally averaging the complete velocity information within a certain radial range. A certain point or range of points on the rotation curve can thus be directly influenced by non-circular motions, such as the ones discussed above, preferentially occurring within the specific radial band or bands corresponding to that point. The rotation curve, and consequently the model velocity field, will thus contain contributions from non-circular motions, which will therefore not appear to their full extent in the residual map. Only position-velocity diagrams (Sect. 5.3) can reproduce the full available information, but since residual velocity fields are so much easier to interpret, we present and discuss those first. In order to minimize the impact of the problem described above, we have used a slightly modified version of the rotation curve for this part of our analysis. Instead of leaving the position angle of the major axis a free parameter in the rotation curve fitting (as in Sect. 4) we now fix the position angle at a value of 153∘. This results in a model velocity field (Fig. 10b) that is less influenced by non-circular motions.
The residual H velocity map ( Fig. 10c) confirms that the most important regions of excess residual velocity are related to the innermost bar, and the incoming spiral arms. The E and W sides of the inner bar show positive (centered at RA , dec 16∘ 06′ 1′′ in Fig. 10) and negative ( , 16∘ 05′ 58′′) residual velocities, respectively, with the spiral arms to the NE and SW exhibiting similar behavior (positive residual velocity component centered at RA , dec 16∘ 05′ 4′′; negative at , 16∘ 06′ 6′′). This is expected for a twofold symmetric deviation from the circular velocities. The magnitude of the residual velocities is a few tens of km s-1, lower than the values obtained from the isovelocity contours in e.g. Fig. 10a or the analysis in Sect. 5.3, as expected (see previous paragraph).
This type of behavior along the major axis of the residual velocity field is interesting: at first slightly negative, then slightly positive when going to larger radii, to both the NW and SE. It indicates that, presumably due to the non-circular motions, the rotation curve as derived from the whole velocity field at first slightly overestimates the circular velocity, then slightly underestimates it. The effect in H is small, but is exactly the same as highlighted in CO when we derived a rotation curve from a very limited part of the velocity field close to the major axis (Fig. 8; Sect. 4.2), indicating the validity of the approach followed in Sect. 4.2, and of the conclusions drawn there about the cause for the differences between the H and CO rotation curves.
5.3 Position-velocity diagrams
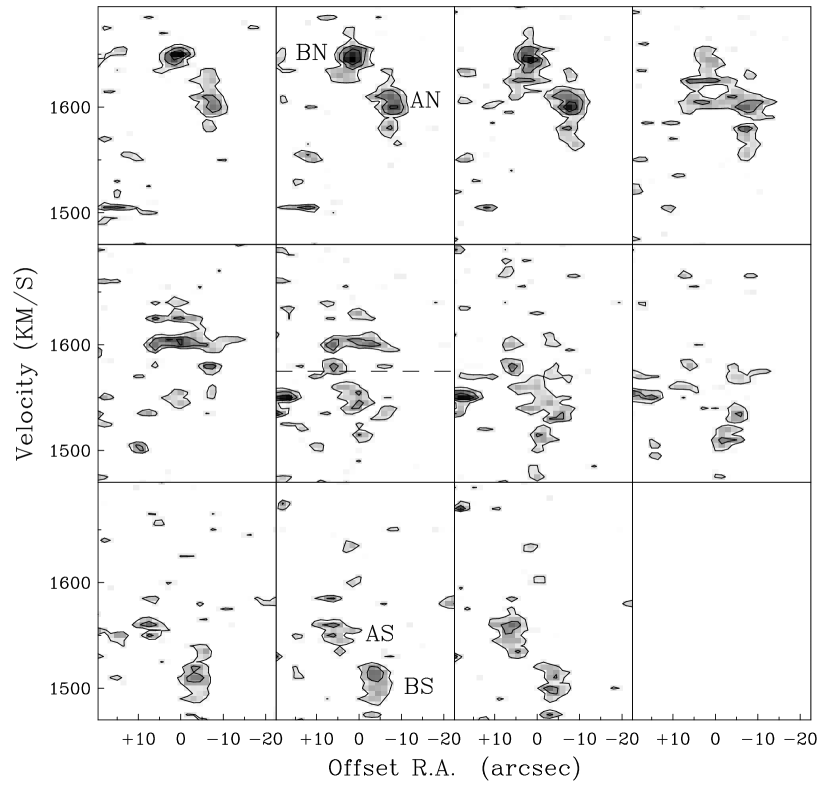
It is generally dangerous to use moment maps for interpretation of kinematical features in regions where profiles may deviate from a Gaussian shape, and/or have multiple peaks. Since the inner region under consideration here is clearly such a region of enhanced risk, we produced a set of position-velocity diagrams along and parallel to the minor axis, shown in Fig. 11 (CO) and 12 (H). It is immediately clear from these panels that multiple velocity components are present, especially in the molecular gas, and that the moment analysis may indeed not be quite adequate in the CNR. The individual diagrams in Figs. 11 and 12 show velocity as a function of offset from the center in the horizontal direction, either along the kinematic minor axis of the galaxy, or along a line parallel to the minor axis but offset from it in the vertical direction. The central panel in Figs. 11 and 12 is the minor axis plot, the others are offset by 15 (CO) and 04 (H; not all panels are shown in Fig. 12), corresponding to roughly half a resolution element in each case. The position angle of the galaxy was taken as 153∘ (Knapen et al. 1993), thus that of the minor axis is 63∘ (the latter is indicated in Fig. 4). As noted by Knapen et al. (1993) in their H i study, the bar of M100 is almost perfectly placed for kinematic studies, its major axis being 110∘, or 45∘2∘ from the kinematic major axis of the galaxy!
In the CO data (Fig. 11) four interesting components show up symmetrically in the position-velocity diagrams, north and south of the minor axis. Two of these (labeled AN and AS in Fig. 11) are visible at RA offsets (North) and (S), with excess velocities with respect to of (N) and (S). We identify these components as the density wave streaming motions near the spiral armlets, seen before in the velocity field. Their offsets, both in RA and in velocity, strongly support this interpretation, as well as their symmetric occurrence in the series of position-velocity diagrams. The positions indicated by letters in Fig. 11 correspond to positions in Fig. 4, the total intensity CO map, of RA= , dec= 15∘ 49′ 22′′ (AN), and , 15∘ 49′ 18′′ (AS). These positions must be used as indications only, because the components can be seen to extent to different offsets from the minor axis (Fig. 11) and because the beam size in CO makes it more difficult to pinpoint positions in Fig. 4.
The second set of components (labeled BN and BS in Fig. 12) has RA offsets of (N) and (S), and excess velocities of (N) and (S). Indicative positions in Fig. 4 would be RA= , dec= 15∘ 49′ 26′′ (BN), and , 15∘ 49′ 13′′ (BS). These components result from the gas streaming along the inner bar-like feature, as again indicated by the symmetric offsets in both position and velocity, and by qualitative and quantitative comparison with the velocity field. This kinematically observed gas streaming confirms the existence of the inner bar component, so prominently seen in our NIR imaging and dynamical modeling (Knapen et al. 1995a,b).
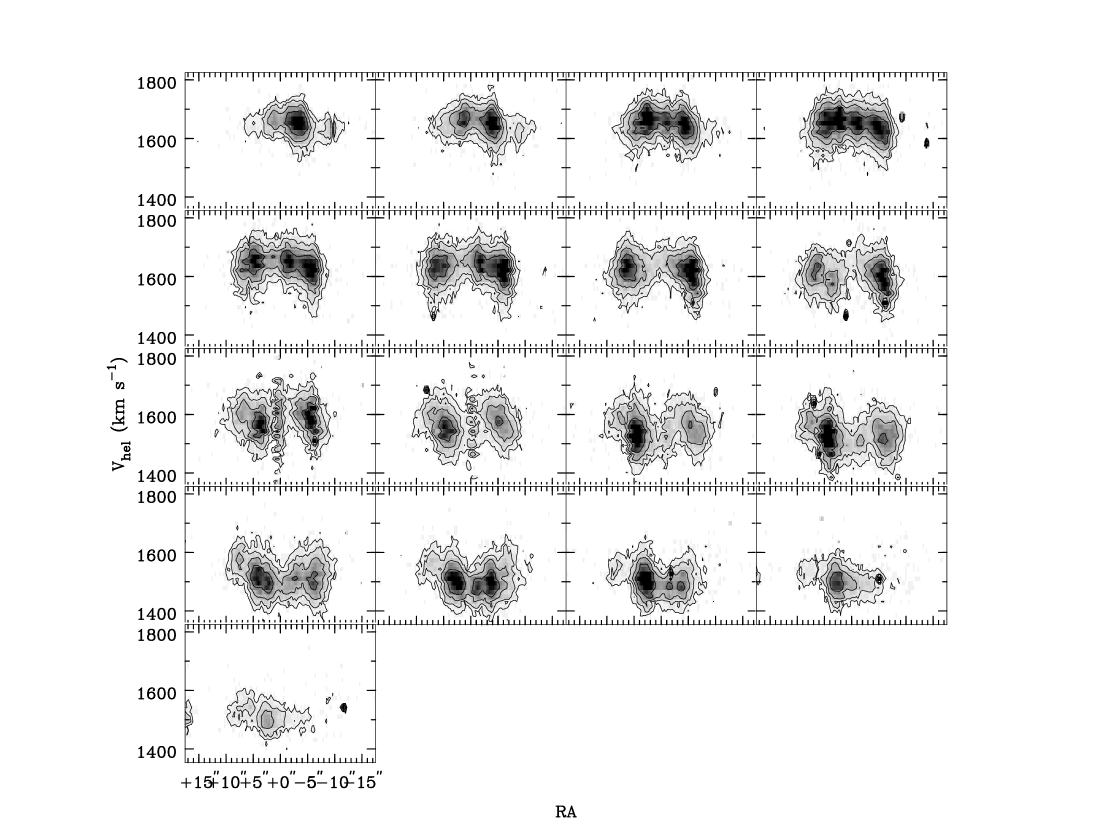
The H position-velocity diagrams, shown in Fig. 12 in an analogous manner to those for CO described above, albeit at higher spatial resolution, are much harder to interpret. The main reason for this is the intrinsically very high velocity dispersion of powerful H ii regions (Rozas et al. 1998; Zurita, Rozas & Beckman, in preparation), which account for most of the H emission in the CNR. This effect can be easily seen in Fig. 12, and to a certain extent masks the effects of gas streaming. Even so, the main trends described before on the basis of the CO position-velocity diagrams, and exemplified by the components AN, AS, BN and BS, can be recognized in Fig. 12, and thus reinforce the conclusions drawn above.
It is interesting to compare the bar-induced deviations described here for the small scales with those due to the large-scale bar, or Fig. 12 of the present paper with fig. 9 of Knapen et al. (1993). The latter are similar position-velocity diagrams along and parallel to the minor axis of M100, but show the H i kinematics on the scale of the large bar, which extends some 4 kpc in radius along a position angle of (the position angle of the inner part of the bar is identical, Knapen et al. 1995b). The similarity between the gas components labeled BN and BS here, and the H i components with velocities symmetrically offset from is striking. The H i behavior was interpreted by Knapen et al. (1993) as streaming along the large-scale bar of the galaxy. The CO velocities similarly represent the streaming along the inner part of the bar. These kinematic observations indicate the geometrical similarity of the gas motions on the large and small scales.
6 Numerical modeling
In order to compare the results of our kinematic observations to our modeling of the central region of M100 in a more quantitative way, we have analyzed the results of the gas motion in our 3D numerical model for stars and gas, in a similar fashion to our analysis of the observational data (using the Q1 model of Knapen et al. 1995b). We used the model parameters at a representative time , when a sufficient amount of gas has accumulated in the CNR due to the gas inflow along the bar from larger radii, and the overall evolution has reached a quasi steady state. The morphology and gas distribution in the model stay similar to that in the CNR of M100, for a few yrs, and we use only the most robust morphological features for comparison with observations. Non-linear orbit analysis (Knapen et al. 1995b) shows that two ILRs exist at this stage, the outer ILR at about 20′′ and the inner ILR at about (the erroneous linear model gives 27′′and 3′′, respectively). This manifests itself by an appearance of the orbits, oriented perpendicularly to the major bar axis. The gas within the corotation radius is losing its angular support due to the gravitational torques from the bar and moves inwards toward the CNR. In this process the gas orbits gradually change their orientation from being aligned with the bar ( orbits) at larger radii to orbits between the ILRs. The two spiral arms coming into the CNR represent the present positions of grand-design shocks in the gas. The incomplete nuclear ring forms where the gas settles down on more circular orbits. Inside the inner ILR, the gas motions gradually orient themselves again with the bar major axis. Knapen et al. (1995a,b) find that the most intensive SF happens at the inner edge of the nuclear ring, i.e., in the vicinity of the inner ILR.
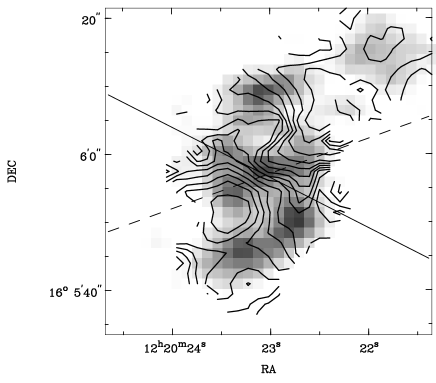
We produced a velocity field from the model output, which is shown in Fig. 13. The model was first rotated to the observed orientation based on the position of the stellar bar. The line-of-sight velocity at the mid-plane was then determined for each pixel using the SPH kernel. The smoothing length used was determined by the radius of a sphere containing a minimum of 96 gas particles and restricted to be no smaller than the adopted pixel size of . In this way the velocity field evaluation is consistent with the hydrodynamical method used in the model, is not sensitive to the pixel size, and has approximately the same accuracy everywhere. The resolution varies from 100 pc at the center to 550 pc at the edges of the frame. The corresponding gray-scale map of shock dissipation in the CNR was published by Knapen et al. (1995b, their fig. 13, frame ).
In comparing the model velocity field with the observational data, a few differences in characteristics must be kept in mind. The spatial resolution in the SPH model map is not constant, as explained above. We smoothed our model results in such a way that the resolution in the map is nowhere higher than that of the H data. For our rotation curve comparison (see below) we used the estimated distance to M100 by Freedman et al. (1994).
A qualitative analysis of the model velocity field (Fig. 13) shows that it agrees remarkably well with the observations. The general shape of the velocity field is similar, with strongly rising circular velocities in the central region, and two regions of maximum velocity indicated by closed contours along the major axis, indicating a maximum in the rotation curve. The two main types of non-circular motion identified in the observations show up prominently and at the expected positions in the model, namely those resulting from streaming of gas along the inner part of the bar (S-shaped isovelocity contours) and from density wave streaming motions near the spiral arms. This indicates that the model reproduces the observed morphology of the central region of M100 and its kinematic structure.
As with the CO observational data, we derived the synthetic gas (i.e., SPH) rotation curve from our model. Fig. 14 shows the full resolution curve, and an additional curve obtained from a velocity field smoothed in such a way that the highest model resolution, in the center, corresponds to that of the CO. We also reproduce the CO rotation curve made while excluding all points from the major axis, as shown in Fig. 8 (abbreviated CO-75). Due to the variable resolution in the model, the CO-75 curve should be compared to the smoothed model curve for , and to the unsmoothed one for .
Comparison between the synthetic and observed gas rotation curves shows that the general shape of the curves is very similar: both curves rise steeply, show a local maximum between and , and fall off after that. The sharp initial rise in the rotation is a clear signature of a central mass concentration in the core of M100. Numerical simulations reveal the expected trend, i.e., gas inflow towards the CNR and its dominant role in re-shaping the gravitational potential there. Whether this evolution is accompanied by a continuous buildup of stellar bulge is an interesting question, but clearly beyond the scope of this work. We only comment that SF processes can affect the evolution of the CNR profoundly, and must be taken into account in any reasonable model. In particular, as shown by Knapen et al. (1995b), this evolution results in the gas being pushed inwards, across the inner ILR. Both modeling and observations display a sharp decrease in the SF within the inner , i.e., close to the inner ILR. Gas “filtering” across the resonance region in the model occurs on a characteristic timescale of about yrs.

7 Discussion and interpretation
7.1 Double or single bar in M100?
There has been some debate in the recent literature as to whether M100 has only one bar of which we observe the inner and outer parts, which have the same pattern speeds (Knapen et al. 1995a; Wada et al. 1998), or whether there are two separate bar systems, with different pattern speeds, which are aligned by chance to within a few degrees in major axis position angle (García-Burillo et al. 1998). Double or nested bars are quite common (e.g., Friedli et al. 1996; Jungwiert, Combes & Axon 1997), and many known cases host a Seyfert or otherwise active nucleus, although precise statistics are not available. Systematic studies of such systems at high resolution are long overdue because nested or double bar systems are of interest to inflow studies, especially with regard to the fueling of nuclear activity (Shlosman, Begelman & Frank 1990).
Although aligned nested bars are expected statistically, they would not be obvious when observing barred galaxies. Nested bars are usually found by studying (deprojected) isophotes. An inner bar with a different pattern speed (co-rotating or counter-rotating) than the primary bar will have different gas and stellar kinematics. This includes dissimilar rotation curves and dispersion velocities, gas/dust and star forming region distributions, and other dynamical characteristics. Evolutionary patterns of the CNRs should differ in all these cases, which are possible to discriminate observationally.
In M100, the observed and modeled morphologies of the CNR, including the distribution of star formation, allow limited freedom for interpretation of gas and stellar dynamics within the central kpc. The remarkable agreement between both ellipticity and major axis position angles of the inner and outer parts of the bar, the distribution of star formation, the gas kinematics and especially the twisting of the NIR isophotes can be convincingly interpreted as evidence for only one bar, dissected by the resonance region hosting nuclear ring.
The following three points support our interpretation of a double ILR in the CNR of M100 (Knapen et al 1995b). First is the observed strong offset of the leading dust lanes from the bar major axis. This offset is directly related to the presence of the family of orbits (Athanassoula 1992). In the absence of the ILR, these orbits disappear and the dust lanes are centered along the bar axis. Nonlinear orbit analysis displays part of the phase space occupied by these orbits. Second is the twisting of isophotes (observed) and density contours (modelled) backwards from the PA of the nuclear ring towards the PA of the bar, both outside and inside the ring. Third, the overall distribution of SF regions in the CNR, characterized by four main peaks of SF, is explained by a global compression wave which is bar-driven and which consists of two pair of arms, trailing and leading, interacting off the bar major axis. The two main SF regions have been shown by the model to lie at the caustic formed by the interaction of both pairs of shocks, and two additional SF sites appear to be regions of gas compression on the bar minor axis, so-called “twin peaks”. The simulations by Wada et al. (1998) are in broad agreement with these findings.
7.2 Star formation in the core region of M100
It is obvious from H imaging (e.g. Arsenault et al. 1988; Pogge 1989; Cepa & Beckman 1990; Knapen et al. 1995a,b; Knapen 1998) that the CNR of M100 is a site of strong massive star formation. Knapen (1998) found that luminosity function (LF) of the H II regions in the CNR is very flat. A flatter LF can in principle be due to an initial mass function (IMF) skewed to enhanced SF at the high-mass end (Rozas 1996; Knapen 1998). However, a proposed change in the IMF slope must be regarded with much suspicion even in the strongly star-forming CNR under consideration, given the rather convincing evidence for a constant IMF slope in an enormous range of environments (see Elmegreen 1999 for a review).
A more realistic explanation of the flattened H ii region LF is an observational one: large numbers of small H ii regions may be present, thus assuring an “underlying” normally-shaped LF, but they cannot be identified in an H image due to crowding effects. An alternative effect, physically different, but leading to the same observational result, is that many smaller H ii regions in a relatively small volume coalesce to make up a much smaller number of much larger H ii regions.
Knapen et al. (1995a,b) discussed the ratio in the CNR, especially as derived from a -band image, and concluded on the basis of population modeling and reasoning that there must be a non-negligible contribution of dynamically young stars to the -band light. This is not surprising: population models show that massive stars formed in a coeval or continuing starburst evolve to a phase where their emission is strongly enhanced after years (e.g. Leitherer & Heckman 1995). Recently, several results on M100 have appeared in the literature confirming this conclusion in a more quantitative way, and due to the implications for several of the models for M100 that have been published recently, we will briefly review those results here.
Wozniak et al. (1998) imaged the CNR of M100 with ISO at wavelengths of 6.75 and m. They found that the emission in the CNR is dominated by three distinct regions, the nucleus, and the sites we identified as K1 and K2 and confirmed to be active sites of star formation by numerical modeling (Knapen et al. 1995a,b). We postulated in reference to optical and NIR morphology that K1 and K2, though different in morphology and luminosity due to the presence of extincting dust, are basically similar sites of strongly enhanced SF. This is well borne out by the mid-IR imaging, much less sensitive to dust than imaging at m. Ryder & Knapen (1999) used a NIR color-color diagram and NIR spectroscopy to study the stellar populations in K1 and K2. They conclude from a comparison of the COsp versus Br line strengths with the models of Puxley, Doyon & Ward (1997) that the stars in K1 and K2 have ages between 20 and 25 Myrs. Finally, both Knapen et al (1995b) and Wada et al (1998) found strong evidence for a significantly changing across the CNR from a comparison of their numerical modeling and NIR imaging, as discussed in more detail below.
7.3 Comparison with other models
The excellent agreement between the predictions of the dynamical model of Knapen et al. (1995b) and the H and CO kinematics presented here is strong evidence in favor of a single bar interpretation. This comes in addition to the perfect alignment between the inner and outer parts of the bar. The kinematic agreement is particularly remarkable since the model was designed to elucidate the underlying physics of CNRs with resonant structures, constrained only by the observed morphology of M100, and constructed without any use of or reference to kinematic observations of the region.
The model proposed by García-Burillo et al. (1998), which claimed two bars rotating at different angular speeds in M100, does not yield a very detailed and close fit either to the morphology or the kinematics of the CNR. In part, this is due to a number of simplifying assumptions made. First, no gas self-gravity was included, whereas the gas mass fraction in the CNR is at least 10%. Sakamoto et al. (1995) measure the overall gas fraction in the inner 18′′ of M100 to be in the range of , and the spiral armlets can be expected to have even more gas. For such a high gas fraction, evolution of models with and without gas gravity is diverging (Shlosman 1999). Shaw et al. (1993) presented an elegant proof that the twisting of the NIR isophotes cannot be reproduced without gas self-gravity either. Second, the gas was treated by means of a sticky particle code with an ad hoc restitution coefficient. Shlosman & Noguchi (1993) showed that gas evolution, including radial inflow rates, depends strongly on this parameter. Third, positions of CNR resonances were inferred from a linear epicycle approximation. This is not suitable for M100-type bars and gives erroneous positions for the ILRs, which require non-linear orbit analysis (Athanassoula 1992; Knapen et al. 1995b). In addition, the use of the 2D light distribution to infer the galactic potential so close to the center, where the stellar disk thickness must be accounted for, and where changes radially and azimuthally, further question the approach taken by García-Burillo et al.
Wada et al. (1998) compared interferometric CO observations by Sakamoto et al. (1995) with a 2-D hydrodynamical model of the CNR in M100. They included self-gravity in the gas, and made a good attempt to follow the variation in within the -band image when deriving the gravitational potential from their best fitting model, based on an analytical description of the bar. The best fitting model invokes wide variations in values, ranging from 1.2 in the older population zones, to 0.2 in what must be regions of recent SF. This confirms a similar conclusion about the variation by Knapen et al. (1995b). The best model of Wada et al. also agrees well with the detailed morphology of the CNR containing a double ILR, and with M100 having a single stellar bar with a pattern speed of 65 km s-1 kpc-1 (in excellent agreement with 68 km s-1 kpc-1 found in Knapen et al.).
8 Conclusions
We compare high angular and velocity resolution two-dimensional kinematic observations in the spectral lines of H and CO of the circumnuclear starburst region in the barred spiral galaxy M100 with kinematics derived from our numerical modeling (Knapen et al. 1995b). Our main results can be summarized as follows:
-
•
We present Fabry-Pérot kinematic mapping of the core region of M100 at a fully sampled resolution of , and CO interferometric observations. We present these data in the form of channel maps, velocity fields, total intensity maps, and selected position-velocity diagrams. From the H data, we derive a rotation curve that rises rapidly in the central 140 pc, and is roughly constant at the disk rotation velocity further out.
-
•
We compare CO and H rotation curves and argue that differences between them are mainly due to the influence of streaming motions in the gas, different for both tracers.
-
•
We study in detail the characteristics of non-circular motions in the core region by considering the CO and H velocity fields, residual velocity fields after subtraction of the rotation curve, and sets of position-velocity diagrams. Non-circular motions are clearly identified from both the H and CO data.By considering where the deviations from circular motions occur in relation to morphological features and how large they are, we can interpret them as the kinematic signatures of spiral density wave streaming in the circumnuclear spiral arms, and as gas streaming along the inner part of the bar.
-
•
We compare our observational data with a two-dimensional velocity field and rotation curve derived from our 1995 dynamical model. The observed and modeled kinematics show good qualitative and quantitative agreement, for both the circular and non-circular kinematic components. We interpret the results in terms of the prevailing orbits in the combined gravitational potentials of stellar and gas components. Our results are compatible with the presence of a global density wave driven by a single, moderately strong stellar bar in M100. Both the morphology and the kinematics of the CNR require the presence of a double inner Lindblad Resonance in order to explain the twisting of the near-infrared isophotes, distribution of star forming region and the 2-D gas velocity field.
-
•
Finally, we review recent observational and modeling results on the circumnuclear region in M100, and discuss the implications for bar structure and gas dynamics in the core of M100 and other disk galaxies.
Acknowledgements.
We thank Françoise Combes for fruitful discussions and Seppo Laine for comments on an earlier draft of this paper. Based on observations obtained at the William Herschel Telescope, operated on the island of La Palma by the Royal Greenwich Observatory in the Spanish Observatorio del Roque de los Muchachos of the Instituto de Astrofísica de Canarias. Financial support from the British Council and the Spanish Acciones Integradas Programme, and from the Spanish DGES, Grant Nos. PB94-1107 and PB97-0219, is acknowledged. I.S. is grateful for support under NASA grants NAG5-3841, WKU-522762-98-06 and HST AR-07982.01-96A.References
- [1]
- [2] Arsenault, R., Boulesteix, J., Georgelin, Y. & Roy, J.-R. 1988, A&A 200, 29
- [3]
- [4] Athanassoula, E. 1992, MNRAS 259, 345
- [5]
- [6] Begeman, K. 1989, A&A 223, 47
- [7]
- [8] Berentzen, I., Heller, C.H., Shlosman, I. & Fricke, K. MNRAS 300, 49
- [9]
- [10] Bosma, A. 1981, AJ 86, 1825
- [11]
- [12] Buta, R. & Combes, F. 1996, Fund. Cosmic Phys., 17, 95
- [13]
- [14] Canzian, B. 1990, Ph.D. thesis, California Institute of Technology
- [15]
- [16] Cepa, J. & Beckman, J.E. 1990, A&AS 83, 211
- [17]
- [18] Combes, F. 1988, in Galactic & Extragalactic Star Formation, eds., R.E. Pudritz & M. Fich, Kluwer: Dordrecht, p. 475
- [19]
- [20] Combes, F. & Gerin, A. 1985, A&A 150, 327
- [21]
- [22] de Vaucouleurs, G., de Vaucouleurs, A., Corwin, H.G., Buta, R.J., Paturel, G., Fouqué, P., 1991, Third Reference Catalogue of Bright Galaxies (RC3), Springer, New York
- [23]
- [24] Elmegreen, B.G. 1994, ApJ 425, L73
- [25]
- [26] Elmegreen, B.G. 1999, in The Evolution of Galaxies on Cosmological Timescales, Ed. J.E. Beckman (ASP Conf. Series), in press
- [27]
- [28] Elmegreen, D.M., Chromey, F.R., Santos, M., Marshall, D. 1997, AJ 114, 1850
- [29]
- [30] Ferrarese, L. et al. 1996, ApJ 464, 568
- [31]
- [32] Freedman, W. et al. 1994, Nature 371, 757
- [33]
- [34] Friedli, D. & Martinet, L. 1993, A&A 277, 27
- [35]
- [36] Friedli, D., Wozniak, H., Rieke, M., Martinet, L., Bratschi, P. 1996, A&AS 118, 461
- [37]
- [38] García-Burillo, S., Sempere, M.J., Combes, F., Neri, R. 1998, A&A 333, 864
- [39]
- [40] Jungwiert, B., Combes, F., Axon, D. 1997, A&AS 125, 479
- [41]
- [42] Kenney, J.D., Young, J.S. 1988, ApJS 66, 261
- [43]
- [44] Kennicutt, R.C. 1994, in Mass-Transfer Induced Activity in Galaxies, ed. I. Shlosman (Cambridge: Cambridge Univ. Press), p. 131
- [45]
- [46] Knapen, J.H. 1997, MNRAS 286, 403
- [47]
- [48] Knapen, J.H. 1998, MNRAS 297, 255
- [49]
- [50] Knapen, J.H., Cepa, J., Beckman, J.E., del Rio, M.S., Pedlar, A. 1993, ApJ 416, 563
- [51]
- [52] Knapen, J.H., Beckman, J.E., Shlosman, I., Peletier, R.F., Heller, C.H. & de Jong, R.S. 1995a, ApJL 443, L73
- [53]
- [54] Knapen, J.H., Beckman, J.E., Heller, C.H., Shlosman, I. & de Jong, R.S. 1995b, ApJ 454, 623
- [55]
- [56] Laine, S., Knapen, J.H., Pérez-Ramírez, D., Doyon, R., Nadeau, D. 1999, MNRAS 302, L33
- [57]
- [58] Leitherer C., Heckman T. M., 1995, ApJS, 96, 9
- [59]
- [60] Maoz, D., Barth, A.J., Sternberg, A., Filippenko, A.V., Ho, L.C., Macchetto, F.D., Rix, H.-W., Schneider, D.P. 1996, AJ 111, 2248
- [61]
- [62] Morgan, W.W. 1958, PASP 70, 364
- [63]
- [64] Planesas, P., Colina L., Pérez-Olea, D. 1997, A&A 325, 81
- [65]
- [66] Pogge, R.W. 1989, ApJS 71, 433
- [67]
- [68] Puxley P. J., Doyon R., Ward M. J., 1997, ApJ 476, 120
- [69]
- [70] Rand, R.J. 1993, ApJ 410, 68
- [71]
- [72] Rand, R.J. 1995, AJ 109, 2444
- [73]
- [74] Roberts, W.W., Huntley, J.M., van Albada, G.D. 1979, ApJ 233, 67
- [75]
- [76] Rozas, M. 1996, PhD thesis, Univ. of La Laguna
- [77]
- [78] Rozas, M., Sabalisck, N., Beckman, J.E., Knapen, J.H. 1998, A&A 338, 15
- [79]
- [80] Ryder, S.D., Knapen, J.H., 1999, MNRAS 302, L7
- [81]
- [82] Sakamoto, K., Okumura, S., Minezaki, T., Kobayashi, Y., Wada, K. 1995, AJ 110, 2075
- [83]
- [84] Schwarz, M.P. 1984, MNRAS, 209, 93
- [85]
- [86] Sérsic, J.L. & Pastoriza, M. 1967, PASP 79, 152
- [87]
- [88] Shaw, M.A., Combes, F., Axon, D.J. & Wright, G.S. 1993, A&A 273, 31
- [89]
- [90] Shlosman, I., Frank, J. & Begelman, M.C. 1989, Nature 338, 45
- [91]
- [92] Shlosman, I., Begelman, M.C., & Frank, J. 1990, Nature 345, 679
- [93]
- [94] Shlosman, I. & Noguchi, M. 1993, ApJ 414, 474
- [95]
- [96] Shlosman, I. 1990, in IAU Colloq. 124 on Paired and Interacting Galaxies, Eds. J. Sulentic & W. Keel (Kluwer: Dordrecht), p. 689
- [97]
- [98] Shlosman, I. 1996, in Proc. Nobel Symposium 98 Barred Galaxies and Circumnuclear Activity, Eds. Aa. Sandqvist, P.O. Lindblad, Lecture Notes in Physics, 474, 141, Springer-Verlag, Berlin
- [99]
- [100] Shlosman, I. 1999, in The Evolution of Galaxies on Cosmological Timescales, Ed. J.E. Beckman (ASP Conf. Series), in press
- [101]
- [102] Sofue, Y., Tutui, Y., Honma, M., Tomita, A. 1997, AJ 114, 2428
- [103]
- [104] Wada, K., Sakamoto, K., Minezaki, T. 1998, ApJ 494, 236
- [105]
- [106] Walterbos, R.A.M., Braun, R. 1992, A&AS, 92, 625
- [107]
- [108] Wozniak, H., Friedli, D., Martinet, L., Pfenniger, D. 1998, A&A 330, L5
- [109]
- [110] Zhang, X. 1996, ApJ 457, 125
- [111]