BeppoSAX unveils the nuclear component in NGC 6240
Abstract
The direct nuclear X–ray emission of the ultraluminous IRAS galaxy NGC6240 has been observed for the first time by BeppoSAX. It is seen through an absorber with cm-2. The 2-10 keV X–ray luminosity of erg s-1 definitely proves that a powerful AGN is hosted in this galaxy, despite the LINER optical appearance. Assuming the typical ratio for quasars, our result implies that it is the AGN and not the starburst that dominates the energy output of NGC6240.
Key words: X-rays: galaxies – Galaxies: Seyfert – Galaxies: individual: NGC 6240
1 Introduction
One of the major open problems with Ultraluminous Infrared Galaxies (ULIRG) is whether they host active nuclei at their centers. In at least a fraction of objects, there is circumstantial evidence that this is the case. One of the best examples in this respect is NGC6240111If is the limiting criterion for ULIRG, strictly speaking NGC6240 belongs to this class only if 65 km s-1 Mpc-1; Genzel et al. (1998)., a well known source in which the presence of two nuclei (Fried & Schulz 1983) suggests an ongoing galaxy merger. Indications of the presence of an AGN come mainly from X–rays: the flat 2–10 keV X–ray spectrum and the prominent iron line complex observed by ASCA (Iwasawa & Comastri 1998) are very similar to those of NGC1068 (Iwasawa, Fabian & Matt 1997; Matt et al. 1997 and references therein) and suggest reflection from cold and warm matter of an otherwise invisible nuclear component. On the other hand, in the optical spectrum all the diagnostic line ratios point towards a classification as a LINER (e.g. Veilleux et al. 1995), and the ISO SWS diagnostic diagram places NGC 6240 in the region of star formation dominance (Genzel et al. 1998). In soft X–rays the spectrum is fairly complex, and best modeled by multi-temperature plasma emission, very likely associated, at least partly, with the powerful starburst and related wind present in this galaxy, a hypothesis strengthened by the ROSAT HRI discovery of rather luminous (1042 erg cm-2 s-1) emission extended over tens of kpc (Komossa, Schulz & Greiner 1998; Schulz et al. 1998). On the other hand, the point–like soft X–ray component is possibly due to scattering of the nuclear radiation (Komossa et al. 1998).
A direct measurement of the nuclear luminosity is needed to assess the relative importance of AGN and starburst emission. The only way to do that is to explore the hard X–ray band, which may reveal the direct nuclear component. If the absorbing matter is moderately thick to Compton scattering (i.e. a few cm-2), the photons emerge above 10 keV, where the most sensitive instrument presently available is the PDS onboard BeppoSAX. This has already added two sources (Circinus Galaxy, Matt et al. 1999; Mrk3, Cappi et al. 1999) to the small list of “moderately–thick” Seyfert 2s, which was previously composed of only one object, NGC4945 (Iwasawa et al. 1993; Done et al. 1996).
2 Observation and data reduction
BeppoSAX (Boella et al. 1997) observed NGC6240 on 1998 August 14–17. In this paper, data from three instruments are discussed: the LECS (0.1–10 keV), the MECS (1.5–10 keV), and the PDS (13–300 keV).
Data reduction and analysis follow the standard criteria, as described in Matt et al. (1997). The total effective exposure time was 52.5 ks in the LECS, 119.4 ks in the MECS and 114.4 ks in the PDS. We accumulated and examined images for the MECS instruments. Comparing the radial profiles in three energy ranges (1.5–4, 4–7.5, 7.5–10 keV) with the corresponding Point Spread Function, no evidence for extended emission is found. Light curves and spectra were extracted within regions of 4′ and of 2′ radius centered on the source for MECS and LECS, respectively (the small LECS extraction radius is chosen to avoid contamination from a nearby, soft source, not visible in the MECS). The light curves are consistent with being constant. The resulting count rate is (8.460.67)10-3 counts s-1 (0.1–4.5 keV) for the LECS and (2.460.07)10-2 counts s-1 (1.5–10 keV) in the MECS. No significant variability was found in the PDS light–curve either, with a count rate of 0.380.04 counts s-1. We restricted the spectral analysis to the 0.1–4.5 keV and 1.5–10 keV energy bands for LECS and MECS respectively, where the latest released (September 1997) response matrices are best calibrated. Standard blank–sky files provided by the BeppoSAX Science Data Center (SDC) were used for the background subtraction.
3 Spectral analysis and results
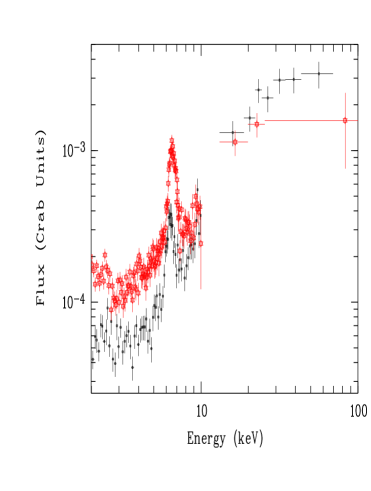
In Fig. 1 we compare the 2 keV spectra of NGC6240 and NGC1068. Both spectra have been normalized to the Crab spectrum; since the latter is a power law with photon index 2, we are basically showing the spectrum. The MECS spectra of the two sources are similar in shape, not surprisingly as we know that in this energy range both sources have been successfully fitted by two reflection components, warm and cold (e.g. Iwasawa et al. 1997; Iwasawa & Comastri 1998). While below 10 keV the flux of NGC6240 is the lowest, the opposite occurs in the PDS band. Clearly, in NGC6240 a new component emerges at high energies. No known bright sources are present in the field of view of the PDS, and the probability of a serendipitous source in the PDS field with a flux equal or larger than that of NGC6240 is , if the 2–10 keV ASCA LogN–LogS (Cagnoni et al. 1998) is adopted, and a power law spectrum with photon index 1.8 is assumed. Thus the best explanation for this component is nuclear emission piercing through an absorber with column density a few1024 cm -2, i.e. Compton–thick but still permitting partial transmission above 10 keV. In Fig.2, the broad band spectrum is fitted following Iwasawa & Comastri (1998): an excess is evident in the PDS band. We therefore modeled the continuum above 2 keV with: i) a power law, representing the intrinsic emission, with a photon index fixed at a typical value of =1.8, absorbed by a column density allowed to be free (leaving the index as a free parameter, a value consistent with the adopted one, but very loosely constrained, is found); ii) a second, unabsorbed power law with the same index, standing for the warm reflection component; iii) a pure cold reflection component (PEXRAV model in XSPEC) generated by a power law with the same index.
As we are interested here in the high energies, and because below 2 keV ASCA is superior to BeppoSAX as far as both sensitivity and spectral resolution are concerned, we content ourselves with adopting in this band the best fitting model of Iwasawa & Comastri (1998). It consists of a multi-temperature optically thin plasma, which probably originates in a powerful starburst. In particular we use a two–temperature MEKAL model, where the absorption of the coldest MEKAL was fixed at the Galactic value (NH = 5.8 1020 cm-2), while the absorption of the other MEKAL was allowed to be a free parameter. We applied the latter absorption to all the AGN components. The envisaged scenario is then one in which an external starburst region, associated with the cooler MEKAL component, absorbs emission from the inner regions of NGC6240 (e.g. Fabian el al. 1998).
A prominent and broad iron K line complex, very similar to that seen in NGC1068, is also evident. Because of this similarity we assume that the line is actually a blend of: the 6.4 keV K and 7.06 keV K fluorescent lines from cold iron (the intensity of the latter has been forced to be equal to 1/9 that of the former, as expected from atomic physics); the 6.7 and 6.97 K recombination lines from He– and H–like iron. In summary the complete model, , we used to fit our data can be written as:
where: is the absorption associated with the Galactic column, is the absorption related to the starburst, is the absorption acting on the nuclear emission (including the Compton cross section), possibly associated with the molecular torus shrouding the nucleus, is the power–law modeling the nuclear component, and are respectively the warm (optically thin) and cold (optically thick) reflection components, and are respectively the cold and hot thermal components and are the four Gaussian lines modeling the iron blend.
| Component | Parameter | Value |
|---|---|---|
| NH(1022cm-2) | 1.99 | |
| NH(1022cm-2) | 218 | |
| 1.8(fixed) | ||
| Fluxat1keVa | 4.1() | |
| Eline | 6.4(fixed) | |
| Ilineb | 2.23() | |
| Eline | 6.7(fixed) | |
| Ilineb | 0.70() | |
| Eline | 6.97(fixed) | |
| Ilineb | 0.53() | |
| Eline | 7.06(fixed) | |
| Ilineb | 0.11Iline(6.4keV) | |
| 1.8(fixed) | ||
| Fluxat1keVa | 0.24() | |
| 1.8(fixed) | ||
| Fluxat1keVa | 2.4() | |
| (keV) | 0.51 | |
| Fluxc | 9.4() | |
| (keV) | 0.70 | |
| Fluxc | 1.3() | |
aPhotons cm-2 s-1 keV-1; bPhotons cm-2 s-1; cBolometric flux in erg cm-2 s-1
In Fig. 3 we show the deconvolved best fitting model with all the components. The best fit parameters are listed in Table 1. The fit is acceptable, /d.o.f.=131/119. If we do not include the transmission component, and try therefore to account for the spectral component emerging in the PDS band with pure Compton reflection (as in NGC1068, Matt et al. 1997), the fit is significantly worse (dof; see Fig.2). It must be noted that the absorber of the nuclear emission, , is Compton–thick. A proper model, including Compton scattering within the matter (see Matt et al. 1999 and Matt, Pompilio & La Franca 1999 for details on this model) should have then been used, if this absorber has a significant covering factor (as for example for a torus geometry with no significant vertical density gradient). When this is done, however, the parameters of the various components do not differ significantly from those obtained with the simpler model, apart from the flux associated with the intrinsic emission, which turns out to be about one third that reported in Table 1. This is because a fraction of the photons emitted towards other directions are now scattered into the line of sight, and the nuclear luminosity required to explain the observed flux is therefore lower.
The same fit but without is also acceptable (dof). In this case, the observed 6.4 keV iron line would entirely originate in the thick absorbing medium, which is possible provided that the covering factor is not much smaller than unity, as we have verified by Monte Carlo simulations. Therefore, the presence of the cold reflection component is not certain in this source. If is instead excluded, the fit is significantly worse (dof).


4 Discussion
The main result of the BeppoSAX observation of NGC6240 is the discovery and measurement of the nuclear emission. The 2–10 keV nuclear luminosity, after correction for absorption, is 3.61044 erg s-1 (assuming =50 km s-1 Mpc-1), or about one third of this if the absorber covers a large solid angle, like in a torus.
As discussed above, the presence of cold reflection is not unambiguously established in this source. Let us, however, assume that it does exist, and take the best fitting parameters listed in Table1. The ratio between the 2–10 keV cold reflection and intrinsic fluxes is about 0.3% for the higher value of the intrinsic luminosity and 3 times larger for the lower value. Assuming a torus geometry like that adopted by Ghisellini, Haardt & Matt (1994), and consistently the lower figure for the intrinsic luminosity, we derive an inclination angle of the torus axis with respect to the observer of 35∘ (45∘ if the upper figure is instead adopted). It is worth noting that both NGC 6240 and Circinus Galaxy (Guainazzi et al. 1999) appear to be observed at moderate inclinations, while NGC 1068, which is totally obscured, is possibly seen almost edge-on (Greenhill et al. 1996, Matt et al. 1997; but see Kishimoto 1999 for a different point of view). This would suggest a decrease in the density of the X–ray absorbing medium with increasing distance from the equatorial plane.
The ratio between 2–10 keV warm reflection and intrinsic fluxes is about 0.5% (1.5% for the lower luminosity). The He– and H–like lines have EW with respect to the warm reflection component of about 1 and 0.8 keV, respectively. From these values we estimate the column density of the warm mirror (e.g. Matt, Fabian & Brandt 1996; Guainazzi et al. 1999), , to be between 1021 and 1022 atoms cm-2, roughly consistent with the value estimated from the ratio between the normalizations of the warm reflection and of the intrinsic emission.
The 2-10 keV X–ray luminosity is 10 to 30 times lower than the IR luminosity (calculated as prescribed by Mulchaey et al. 1994), consistent with the usual values for Seyferts (e.g. Mulchaey et al. 1994; Awaki 1997). In the case of NGC6240, therefore, a ULIRG turns out by no means to be a peculiar AGN, as far as X–ray properties are concerned. If 0.03, as typical for QSO (Elvis et al. 1994), our result implies that it is the AGN that dominates the energy output, and not the starburst as deduced by Genzel et al. (1998) on the basis of the ISO spectrum.
In the optical, NGC6240 is classified as a LINER. Possibly, the NLR is obscured by the starburst region, whose column density, from our analysis, corresponds to A10. It is worth noting that NGC 6240 is not the first LINER that, when observed in X-rays, turns out to be an AGN (see e.g., NGC 4945, Done et al. 1996; NGC 1052, Guainazzi & Antonelli 1999). Differently from them (but similarly to two other ULIRG, IRAS23060+0505: Brandt et al. 1997 and IRAS20460+1925: Ogasaka et al. 1997), NGC6240 has a high X–ray luminosity, and it may be called an obscured QSO. While it would be premature to draw conclusions on ULIRGs as a class, one cannot help noting that the so far elusive type 2 QSO should be better searched for in X–rays rather than in the optical band.
-
Acknowledgements.
We thank the referee, R. Antonucci, for valuable comments. We acknowledge the BeppoSAX SDC team for providing pre–processed event files and the support in data reduction. GM and GCP acknowledge financial support from ASI, WNB from NASA LTSA grant NAG5-8107. MG acknowledges an ESA Research Fellowship. BeppoSAX is a joint Italian-Dutch program.
References
- Awaki H., 1997, in “Emission Lines in Active Galaxies: New Methods and Techniques”, ASP conf. series Vol 113, p. 44
- Boella G., Butler R.C., Perola G.C., et al., 1997, A&AS 112, 299
- Brandt W.N., Fabian A.C., Takahashi K., Fujimoto R., Yamashita A., Inoue H., Ogasaka Y., 1997, MNRAS 290, 617
- Cagnoni I., Della Ceca R., Maccacaro T., 1998, ApJ 493, 54
- Cappi M., Bassani L., Comastri A., et al., 1999, A&A 344, 857
- Done C., Madejski G.M., Smith D.A., 1996, ApJ 463, 63
- 1 Fabian A.C., Barcons X., Almaini O., Iwasawa K., 1999, MNRAS 297, L11
- 2 Fried J.W., Schulz H., 1983, A&A 118, 166
- Genzel R., Lutz D., Sturm E., et al., 1998, A&A 498, 579
- Ghisellini G., Haardt F., Matt G., 1994, MNRAS 267, 743
- Greenhill, L. J., Gwinn, C. R., Antonucci, R., Barvainis, R., 1996, ApJ 472, L21
- Guainazzi M., Matt G., Antonelli L.A., et al., 1999, MNRAS in press (astro-ph/9905261)
- Guainazzi M., Antonelli, L.A., 1999, MNRAS 304, L15
- Iwasawa K., Koyama K., Awaki H., et al., 1993, ApJ 409, 155
- Iwasawa K., Fabian A.C., Matt G., 1997, MNRAS 289, 443
- Iwasawa K., Comastri A., 1998, MNRAS 297, 1219
- Kishimoto M., 1999, ApJ 518, 676
- Komossa S., Schulz H., Greiner J., 1998, A&A 334, 110
- Matt G., Brandt W.N,, Fabian A.C., 1996, MNRAS 280, 823
- Matt G., Guainazzi M., Frontera F., et al., 1997, A&A 325, L13
- Matt G., Pompilio F., La Franca F., 1999, New Astronomy 4/3, 191
- Matt G., Guainazzi M., Maiolino R., et al., 1999, A&A 341, L39
- Mulchaey J.S., Koratkar A., Ward M.J., 1994, ApJ 436, 586 309
- Ogasaka Y., Inoue H., Brandt W.N., et al., 1997, PASJ 49, 179
- Schulz H., Komossa S., Bergöfer T.W., Boer B., 1998, A&A 330, 823
- Veilleux S., Kim D.-C., Sanders D.B., Mazzarella J.M., Soifer B.T., 1995, ApJSS 98, 171