A photometric and kinematic study of the stars and interstellar medium in the central two kpc of NGC 3379 111Based on observations obtained at the ESO 3.6m telescope
Abstract
HST images of NGC 3379 show that the V and I luminosity profiles in the inner 13″ of this E1 galaxy are represented by two different components: a stellar bulge following a Sérsic Law with exponent = 2.36, and a central core ( 07) with a characteristic “cuspy” profile. Subtraction of the underlying stellar component represented by the fitted Sérsic profile revealed the presence of a small ( 105 pc) dust disk of about 150 , oriented at PA = 125° and inclined 77° with respect to the line of sight. The same absorption structure is detected in the color-index image. The stellar rotation in the inner 20″ is well represented by a parametric planar disk model, inclined 26° relative to the plane of the sky, and apparent major axis along PA 67°. The gas velocity curves in the inner 5″ show a steep gradient, indicating that the gas rotates much faster than the stars, although in the same direction. The velocity field of the gaseous system, however, is not consistent with the simple model of Keplerian rotation sustained by the large (7 within a radius of 90 pc) central mass implied by the maximum velocity observed, but the available data precludes a more detailed analysis.
1 Introduction
High spatial resolution images obtained with the Hubble Space Telescope revealed the presence of small nuclear stellar disks in several early type galaxies (van den Bosch et al. 1994; van den Bosch, Jaffe & van der Marel 1998) as well as patchy absorption due to dust near their nuclei (van Dokkum & Franx 1995). The presence of stellar disks in elliptical galaxies has important consequences on the mechanisms of galaxy formation since it suggests a continuity between spirals, lenticulars, and ellipticals, implying that a single mechanism may control the morphology of the protogalaxy (Bender et al. 1989; Capaccioli 1990). If, on the other hand, it is assumed that elliptical galaxies are formed by merger of spirals (Illingworth & Franx 1989; Balcells & Quinn 1990; Hernquist & Barnes 1991) or coalescence of dwarf systems (Coté, Marzke & West 1998), it is difficult to explain the survival of such small disks over large time scales after the merger event.
NGC 3379 is a bright E1 galaxy with almost perfectly elliptical isophotes (Lauer 1985). Detailed surface photometry based on photographic plates and CCD images covering the range from 18 mag arcsec-2 to 29 mag arcsec-2 yielded a mean ellipticity of and a major axis mean position of PA = 70° (Capaccioli et al. 1990). The isophote twist is smaller than 5° and the ellipticity varies by less than 0.06 between 10″ and 100″ (Capaccioli et al. 1990; Peletier et al. 1990). The stellar rotation curves measured up to R = 30″ show evidence of slow (50 km s-1) rotation around the photometric minor axis (Franx, Illingworth & Heckman 1989; Bender, Saglia & Gerhard 1994), and a mean stellar velocity dispersion of 180 km s-1. Higher velocity dispersion is observed in the galaxy core ( 2″; Bender et al. 1994).
Although this galaxy is often regarded as the prototype for its morphological type, there have been several suggestions that it may actually be a face-on S0 galaxy (Capaccioli 1987; Nieto 1989) or at least a flattened elliptical (Strom et al. 1976; Statler 1994). Its intrinsic shape was found to be almost oblate in the inner R/R 0.4 (Re 54″) region, with axial ratios of b/a = 0.9 and c/a = 0.5, and triaxial in the outer regions (b/a = 0.75 and c/a = 0.5) (Capaccioli et al. 1991, hereafter C91). These authors also remarked the presence of a small stellar disk in the central regions of the galaxy. Combining photometric and kinematic data with dynamical models, Statler (1994) concluded that this object is in fact an elliptical galaxy, ruling out very flattened, triaxial shapes, but Statler & Smecker-Hane (1999), hereafter SS99, using more detailed stellar kinematic data, suggested that the two-dimensional velocity field of NGC 3379 indicates a two-component structure for the galaxy, with kinematical features closely resembling those seen in the rotation curve of the edge-on S0 galaxy NGC 3115.
Macchetto et al. (1996) (hereafter Paper I) mapped the ionized gas of about 80 early-type galaxies, using H+[N II] narrow-band imagery and found that NGC 3379 presents a small (20″ 14″) central disk of ionized gas with an estimated mass of 2.2 calculated from the H luminosity. Recent high spatial resolution photometric and kinematic studies (Magorrian et al. 1998; van der Marel 1999) showed that this galaxy could harbor a central Massive Dark Object (MDO) of . The best fitting 3-integral models of Gebhardt et al. (1996) also indicates, besides the presence of a central MDO, that the intrinsic shape of the galaxy would be an E6 seen at an inclination of 27°.
In this work we address the stellar and gas kinematics, and the dust morphology in the central two kpc of NGC 3379 using new spectroscopic observations taken as part of our program to study the interstellar medium in early type galaxies, as well as archival HST images. This paper is organized as follows: Section 2 presents the observations and data reduction. The luminosity profiles and dust distribution derived from HST images are discussed in Section 3.1. The stellar kinematics is explored in Section 3.2, where we test the simple case of disk rotation in a spherical potential, and the gas kinematics is discussed in Section 3.3. The conclusions are summarized in Section 4. To allow direct comparison with our previous results (Paper I; Ferrari et al. 1999) we adopt H∘ = 55 km s-1Mpc-1, and a distance to NGC 3379 of 14.5 Mpc, although a number of different values can be found in the literature (Sakai et al. 1997; Ciardullo, Jacoby & Ford 1989). At this distance, 1″ corresponds to 70 pc in the plane of the sky 222For a distance of 10 – 11 Mpc, the linear scale is 50 pc arcsec-1, and the masses calculated in Section 3.1 would be overestimated by a factor of two..
2 Observations and Data Reduction.
2.1 The HST images
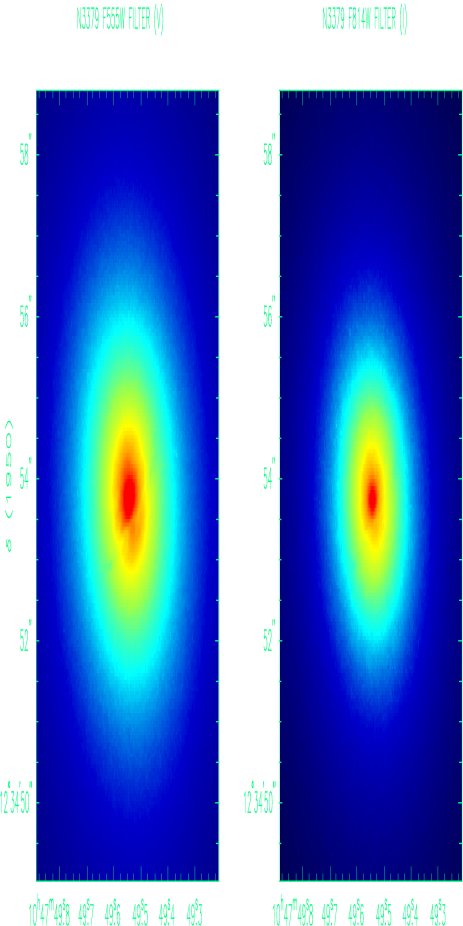
Archival HST V and I images were used to analyze in detail the photometric properties of the central ( 15″) region of NGC 3379. The images were obtained with the Wide Field Planetary Camera 2 (WFPC2) F555W and F814W filters, with the nucleus of the galaxy placed on the PC frame resulting a spatial scale of 0.046 arcsec/pixel and a resolution of 01. The details of the observations are given in Table 1. Data reduction of the individual images followed the standard pipeline procedures for flat fielding and bias correction. The individual images for each filter (four images with the F555W and two with the F814W) were combined to remove cosmic rays, resulting a total exposure time of 1660s and 800s for F555W and F814W final images, respectively. Those were then flux calibrated in order to convert the F555W and F814W counts to the Johnson system at V and I (Biretta et al. 1996). The V and I HST integrated magnitudes in a 10″ aperture centered in the nucleus agree within 0.13 and 0.15 mag, respectively, with the ground-based data, implying very small uncertainties when deriving relative color maps of the galaxy. The final F555W and F814W images are shown in Figure 1.
2.2 Spectroscopy
To study the kinematics of the ionized gas detected in Paper I and to explore earlier suggestions about the presence of a stellar disk in the inner 30″ of NGC 3379 (C91; SS99), long-slit spectra were obtained at position angles 70°, 115°, and 160°, corresponding respectively to the major, intermediate, and minor axes of the gas distribution. The slit positions are shown in Figure 2, superimposed on the H[N II] image and R-band isophotal map of NGC 3379 from Paper I.
The observations were conducted at the ESO 3.6m telescope EFOSC1 at La Silla, Chile. In order to maximize the coverage of the relevant stellar absorption and gaseous emission lines, we used the O150 grism in the range 5140–6900 Å with a dispersion of 3.4 Å/pixel and the CCD #26 (Tektronik 512 512 pixels), with a spatial scale of 0.61 arcsec/pixel and 1″ resolution. The slit width was set to 1″, with an useful length of 3′. The observational procedure was to obtain two exposures of 40–45 minutes at each position angle in order to increase the S/N ratio and facilitate the removal of cosmic rays. The observations are summarized in Table 2. The stability of the instrument has been checked by comparing the position of the sky emission lines present in the galaxy spectra, and we found that the relative shift is always less than 0.2 pixels, with a rms of about 0.1 pixels ( 17 km s-1). We also verified the correct alignment of the CCD Y axis with the dispersion direction by tracing, for each spectrum, the position of the centroid of the galaxy or star light distribution along each detector row. No systematic misalignment was found, with the tilts never larger than 005 (0.5 pixels). Several kinematic (giant stars in the spectral type range K0-K4 III, with rotation velocity less than 20 km s-1) and spectrophotometric standards were observed at the beginning and the end of each night. The data reduction was carried out the usual way, using IRAF 333IRAF is distributed by the National Optical Astronomy Observatories, which are operated by the Association of Universities for Research in Astronomy, Inc., under cooperative agreement with the National Science Foundation. tasks. The mean bias level was subtracted and the frames divided by a normalized dome flat-field to remove pixel-to-pixel variations. The averaged sky flat was used to correct for the non-uniformity of the response along the slit. Wavelength calibration was obtained fitting a low order polynomial to the centroid of the brightest, non-saturated lines in the HeAr comparison lamp spectra, with residuals of less than 0.15 Å. Relative velocities were measured with an uncertainty of 5 km s-1.
A cross correlation algorithm, working in pixel space, has been used to derive the stellar kinematics (Dalle Ore et al. 1991). Briefly, the continuum of the galaxy and template star spectra were fitted with a polynomial of order 20, and subtracted. Each resulting galaxy spectrum was then cross-correlated with that of the kinematic template star, and the center of a Gaussian fitted to the central peak of the correlation function gives the radial velocity of the galaxy with respect to the template star.
3 Results
3.1 Luminosity profiles and image
Elliptical galaxies have central surface-brightness distributions of two distinct types: those with steep profiles that do not show a break in the slope – called “power-law” galaxies; and those that do show a break at a given radius , from a steeper outer profile to a flatter core – called “core” galaxies (Lauer et al. 1992, 1995; Crane et al. 1993; Ferrarese et al. 1994; Forbes, Franx & Illingworth 1995; Faber et al. 1997). NGC 3379 was classified by Faber et al. (1997) as a “core” type galaxy, and in addition to the characteristic luminosity profiles, we found that the HST V and I images reveal a well defined nuclear dust structure (see Figure 1), similar to that observed in the E2 galaxy NGC 6251 (Ferrarese & Ford 1999). The presence of such nuclear dust disk raises the possibility that the observed central luminosity profile could be altered by absorption, creating an artificial break and mimicking a “core” type profile. To analyze the role that the dust plays on the luminosity profile, we carried out detailed surface photometry of the central region of NGC 3379 using the IRAF task ellipse to measure the main isophotal parameters (position angle, ellipticity and Fourier coefficient ). The fitting results are shown in Figure 3 as a function of the distance in arcsec, along the isophotal major axis.
The position angle of the major axis presents an almost constant value of 75° between 2″ and 13″, decreasing slightly to 70° for larger distances. Within the inner 2″, on the other hand, the PA changes considerably, first decreasing to lower values of up to 50° at 1″, and then increasing again to reach a value of PA = 120° at 04, which is close to the orientation of the dust disk’s major axis. The isophotes external to 5″ show a constant ellipticity with a value of 0.12, but internal to this radius the ellipticity increases to up to 0.24 at 05. It is very significant that the changes in both the PA of the major axis and the ellipticity of the isophotes start at approximately 2″, in close correspondence with the presence of the dust disk.
The parameter is related to the shape of the isophotes: ellipticals with “core” profiles tend to present “boxy” isophotes ( 0), while “power-law” galaxies tend to be more disk-like ( 0) (Nieto, Bender & Surma 1991). In NGC 3379, the parameter external to 2″assumes an almost constant value of zero, while internal of this radius it first rises to positive values up to 12 and then oscillates around zero in the innermost regions. Such behaviour indicates that, outside the region where the dust disk is present, this galaxy has indeed almost perfectly elliptical isophotes, and that the dust affects the very inner isophotes making them appear more disk-like where they would be expected to be “boxy” based on the classification of NGC 3379 as a “core” galaxy (Faber et al. 1997; Kormendy 1999).
The derived V and I luminosity profiles along the major axis at PA = 70° show evidence of a change in slope at 07. In order to verify if this depression could be attributed to the presence of the dust disk, we performed the ellipse fitting with the region occupied by the disk masked-out, and found the same profiles as in the previous case (without masking). Therefore, the presence of dust has a negligible effect on the profiles. The change in the profile slope makes necessary to use two different laws for the fitting:
– from 008 to 068, where the profiles are shallower, a cuspy law was used:
| (1) | |||||
– from 068 to 15″, the Sérsic law (Sérsic 1968) provides a better fit:
| (2) | |||||
The resulting parameters of the fit are shown in Table 3.
Figure 4 shows the observed (star symbols) and fitted profiles (solid line) from the V image. The interval 07 9″ is well reproduced by a Sérsic law with index , indicating that the profile is more concentrated than the usual de Vaucouleurs light distribution, which fails to reproduce the observed luminosity. The very inner region ( 07) is expanded in the zoomed insert to the right, where it can be clearly seen where the Sérsic law breaks up and the nuclear profile dominates.
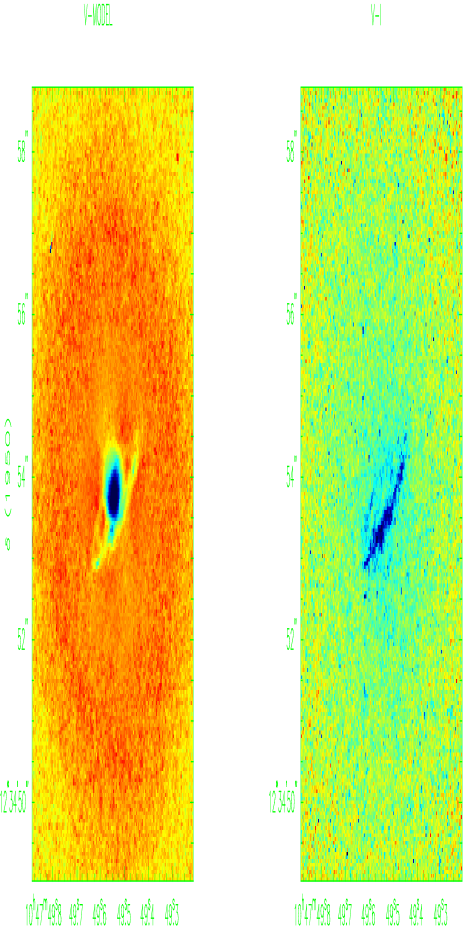
The fitted Sérsic profile was assumed to represent the stellar light distribution for 10″, and a model image was built using the IRAF task bmodel. This model was then subtracted from the V image and the result is shown in the left panel of Figure 5. For 07, where the “cuspy” law dominates, the nuclear core appears now very clearly in absorption, since its profile is 0.2 mag fainter than the external profile extrapolation. The subtraction also reveals a very conspicuous dust structure at 15, reminiscent of the dust disk seen in NGC 6251 (Ferrarese & Ford 1999). The color-index image, shown in the right panel of Figure 5, confirms the presence of dust disk with major and minor axes 3″and 08 long, respectively, with the major axis oriented along PA 125°. Assuming that the disk is circular, the observed axial ratio implies an inclination of 77° between the line of sight and the normal to the disk.
From our data, we measured a mean extinction of 0.11 mag inside the disk. Assuming that the dust is in a uniform layer with 15 (105 pc) and is composed mainly of silicate grains with mean size 0.08 m, a dust mass of 150 was estimated following the method discussed in Ferrari et al. (1999). The analysis in that paper also indicated presence of a more extended, asymmetric dust cloud extending about 5″ to the South, with an estimated mass of 100, and mean extinction of 0.027 mag. The much larger mass and extiction measured in the disk over that of the southern extended dust cloud, indicates the presence of a dust gradient towards the central regions of the galaxy.
The fit of the I band luminosity profile yields very similar results, as can be seen in Table 3 and Figure 6. Since the I band should be less affected by reddening, the presence of the central cusp in the I profile shows that absorption by dust cannot be the primary cause for the observed change of slope. The isophotal parameters discussed above indicate that dust indeed plays a role in distorting the inner isophotes, but it is not a strong enough effect to modify the global luminosity profiles.
This galaxy therefore presents a characteristic “cuspy” core, with the steeper outer (Sérsic) profile breaking up at 07 to be replaced by a shallower inner profile, given by Eq. 1 with = 0.21. Note that the profile break is located about 08 from the most absorbed part of the dust disk, and therefore the light depletion observed in the luminosity profile cannot be explained by dust absorption, since it is not present where this latter is stronger. This same conclusion is reinforced by the color-index image (Fig. 5), where only the dust ring is visible, evidencing that the central cusp is not an effect of localized absorption.
Several models have been proposed to account for core formation, such as: a) an isothermal sphere with density profile ; b) black holes (BH) adiabatically grown in homogenous isothermal cores (Young 1980; Van der Marel 1999); c) the orbital decay of massive black holes acreted in mergers, where the decaying BHs may heat and eject stars from the center, eroding the power-law if any exists and creating a core (Faber et al. 1997 and references therein); or d) remnants formed by mergers of disk galaxies, where the dissipation in the gas and ensuing star formation during the merger process leaves a dense stellar core in the remnant (Mihos & Hernquist 1994). These last models can account for the extra light at small radius (over a Sérsic or de Vaucouleurs functions) in the luminosity profile of “power-law” type galaxies (Kormendy 1999), but cannot reproduce the broken light profile observed in NGC 3379, which is fainter than the Sérsic distribution in the inner region.
Magorrian et al. (1998) constructed dynamical models for a sample of 36 early-type galaxies, including NGC 3379, using HST photometry and ground-based kinematic data. The models assume that the galaxies are axisymmetric, described by a two integral distribution function, with an arbitrary inclination angle, a position-independent stellar mass-to-light ratio, and a central massive dark object (MDO) of arbitrary mass. Such approach was able to provide acceptable fits to 32 galaxies in the sample, and a model with an MDO mass of 3.9 and a mass-to-light ratio of 5.3 was found to be an adequate description for the stellar kinematics of NGC 3379. In a similar approach, Gebhardt et al. (1996) used axisymmetric, 3-integral models to fit both HST/FOS and ground-based spectroscopy along the major and minor axes. HST/WFPC2 and ground-base images were used to constrain the light distribution. The best fit model for NGC 3379 also required the presence of a central MDO with mass of 6 .
Recently, van der Marel (1999) studying the models first proposed by Young (1980) of adiabatically grown black holes, predicted that the luminosity profiles should behave as for asymptotically small radii, but as at radii observable with HST, with the index increasing monotonically with the mass of the central object. The index can assume all the observed values and therefore, both “core” and “power-law” profiles can be reproduced. Within this approach, the luminosity profile of NGC 3379 can be reproduced with the inclusion of a central black hole of mass of 1.9 .
3.2 Stellar Kinematics: an inner disk?
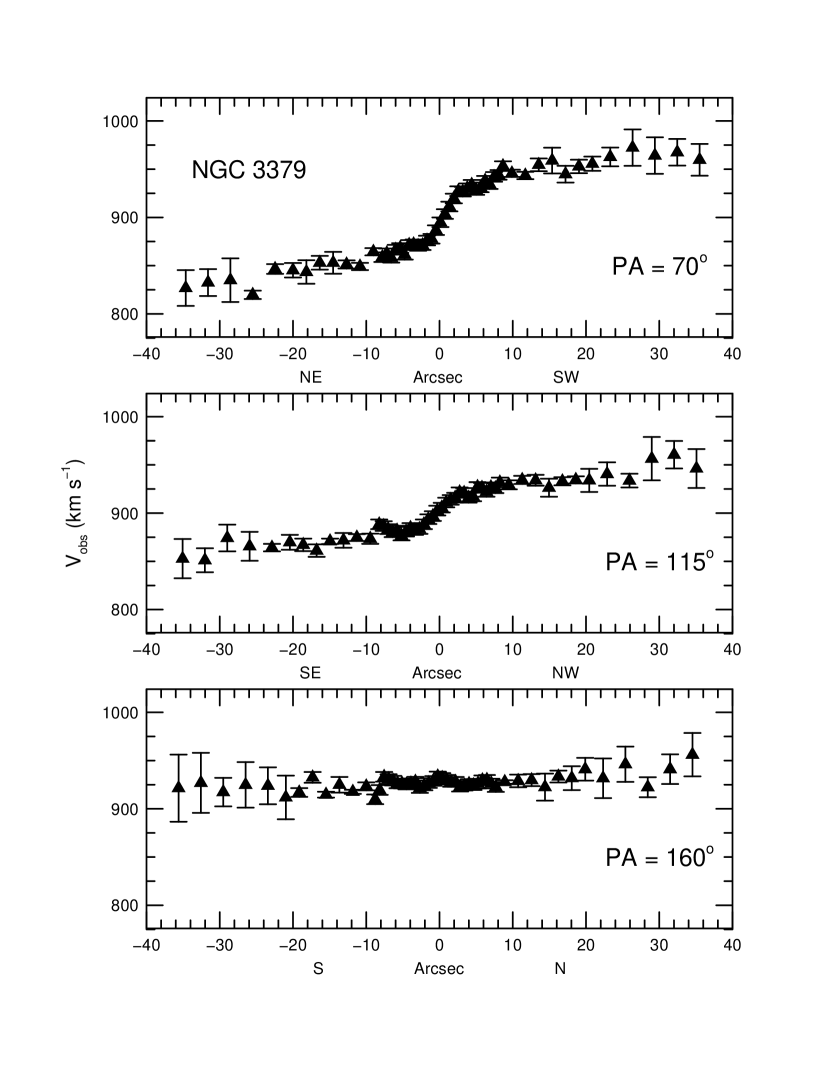
In this section, we use the spectroscopic data described in Section 2.2 to explore the possible presence of a stellar disk as well as to study the kinematics of the ionized gas shown in Paper I. The observed stellar rotation curves are presented in Figure 7. In agreement with previous results (Franx at al. 1989; Bender et al. 1994; SS99), it can be seen that the galaxy shows a fairly symmetric rotation curve along PA = 70°and 115°, with a steeper velocity gradient observed in the inner 6The rotation curve along PA = 160° is almost flat, confirming once more the presence of rotation around the galaxy’s minor axis. The kinematic breaks remarked by SS99 at 5″ are also clearly discernible in our data.
To model the stellar kinematics, we assumed that the stars follow circular orbits in a plane, and used Bertola et al. (1991) analytic expression as a first order approximation for the observed rotation curve:
| (3) |
where is the systemic velocity, is the radius in the plane of the disk and , , and are parameters that define the amplitude and shape of the curve. If is the observed radial velocity at a position in the plane of the sky, where is the projected radial distance from the nucleus and its corresponding position angle, we have:
| (4) |
with
where is the inclination of the disk ( for a face-on disk) and the position angle of the line of nodes.
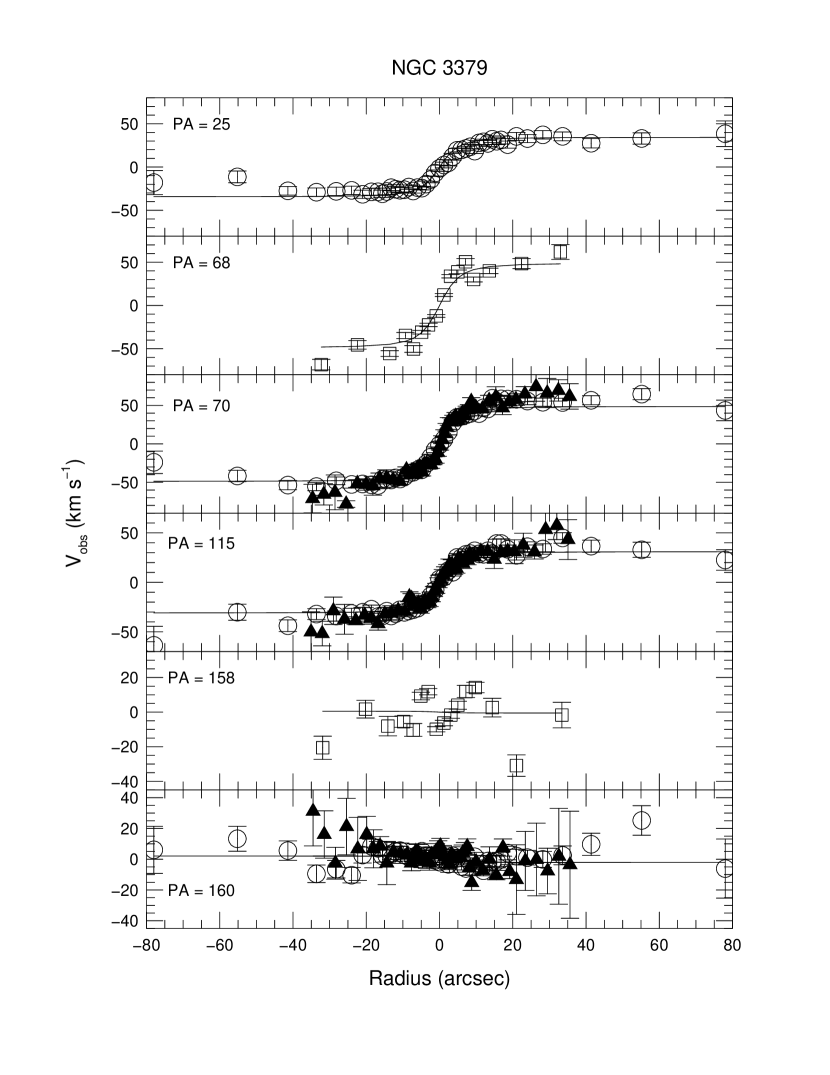
The stellar rotation curves for PA = 70°, 115°, and 160° described above were combined with the data from Franx et al. (1989) for PA = 68° and 158°, and from SS99 for PA = 25°, 70°, 115°, and 340°. Our data agree very well with the rotation curves given by SS99 along the same PAs (see Figure 8). The various parameters were determined simultaneously by minimizing the residuals , with and being the model and observed radial velocities at the position in the plane of the sky, respectively.
We used a Levenberg-Marquardt non-linear least-squares algorithm to fit the above model. The data from the nine sets were first fitted with and as free parameters, with having the same value for all data points (except for the SS99 data where was inittially set to zero). Then, to take into account possible zero point velocity offsets between the data sets, each one was separately fitted allowing to vary, but keeping the remaining parameters fixed to the values obtained before. The resulting systemic velocity for each set was subtracted from the observed values and all data refitted with and as free parameters. Finally, the effect of the initial guess on the parameters was explored running a Monte Carlo search for a wide interval of values for each parameter, while the others were given their best fit values as the initial guess. An unstable fit will show as a large deviation from the original model.
The best solution (Table 4 and solid line in Fig. 8) corresponds to an asymptotically flat rotation curve. The model is a good representation for the data up to R 20″, and indicates that the stellar disk is inclined 26° relative to plane of the sky, with the apparent major axis located at PA 67°. These values are in very good agreement with the V and I isophotal parameters analyzed in Section 3.1, where it was shown that the PA of the major axis has almost constant value of 75° between 2″ and 13″, converging to 70° for larger distances, and the ellipticity of the isophotes external to 5″ has a constant value of 0.119, which (assuming that the isophotal contours originate in a circular stellar disk) imply an inclination of 28°. Our results are also in agreement with the parameters derived photometrically by CP91. The observed deviation of the data points from the planar rotation model at larger radii is also expected within C91’s analysis, where the triaxiality of the bulge grows outward and our model of purely planar rotation cannot represent the more complex stellar velocity field. We stress that our analysis does not prove the existence of a stellar disk in NGC 3379. It shows that such a disk is indeed a plausible first order representation, but with the limited spatial resolution of ground-based observations it is not possible to fully deconvolve the triaxial motions of an elliptical or bulge system and show that a planar disk is the only possible model for the observed stellar kinematics.
3.3 Gas kinematics
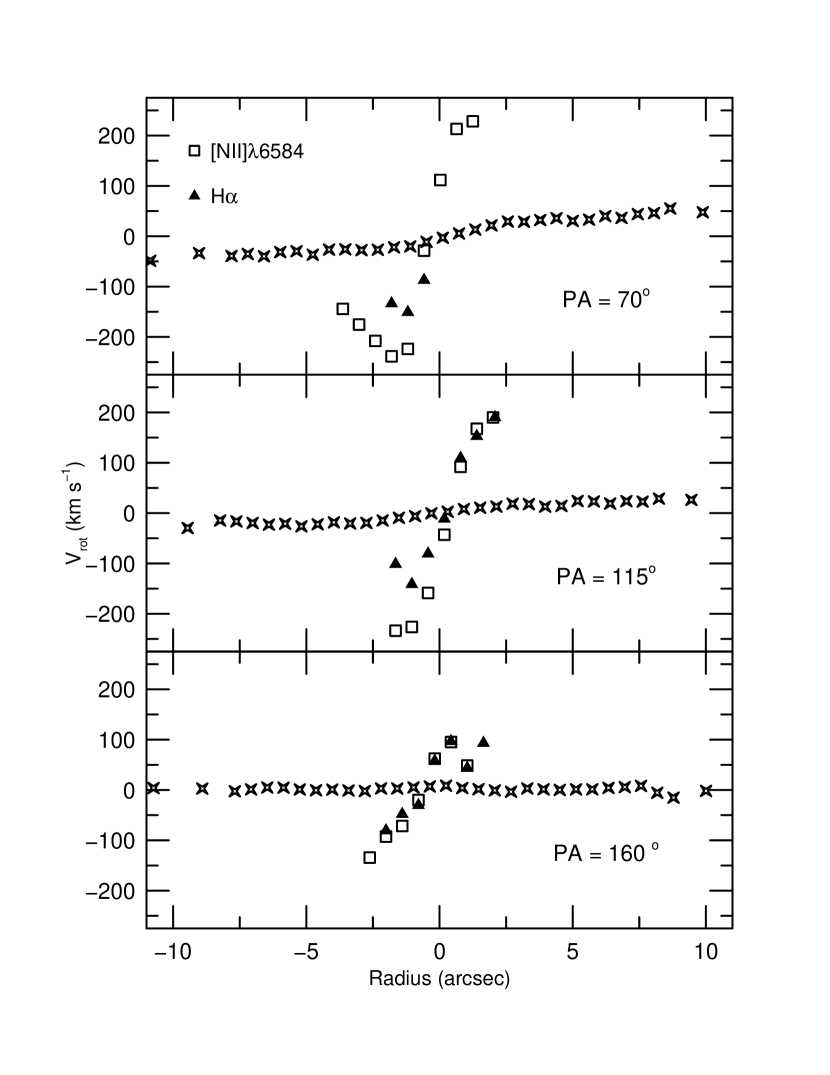
To analyze the gas kinematics, we have used the H[N II] 6584 emission lines which are the only ones detected in our data. The underlying stellar continuum was obtained integrating the spectra outside the line-emitting region, and then subtracted from the central rows. The gas velocity was measured by interactively fitting a single Gaussian component to the emission lines in each individual spectrum. Reliable measurements were obtained only in the inner 5″, corresponding to approximately half the extension of the ionized gas region detected in Paper I. The gas velocities along the three observed positions are shown in Figure 9 superimposed on the stellar rotation curves.
In the inner 5″, the observed velocities are of up to 240 km s-1 at PA=70°, and up to 210 km s-1 at PA = 115°; a smaller rotation (v 90 km s-1) is still observed at PA = 160°. The steeper gradient of the gas rotation curves indicates that it rotates much faster but in the same direction as the stars. Since similar maximum rotational velocities are observed at both PA = 70° and 115°, we can quite safely assume that the position angle of the major axis of the gas disk would be approximately halfway, namely at PA 85°. Assuming that the gas is indeed in a disk, the axial ratio derived from the isophotal fitting in the H[N II] image implies a inclination of 25°. Using these two values for the projection angles, the deprojected velocity of the gas at = 13 (91 pc) is 580 km s-1. If the gas was in pure Keplerian rotation, this value would imply that the total mass inside this radius is 7 . Therefore, a quite large gravitational mass would be required inside the inner 2″ in order to support the gas rotation. The limited amount of data, however, precludes a more detailed analysis.
4 Conclusions
From our analysis of archival V and I HST images and ground based spectra of NGC 3379, we conclude that:
-
1.
The V and I luminosity profiles in the inner 13″ cannot be represented by a single component, with the fitting revealing two different systems: the external one following a Sérsic Law with a = 2.36 index, and therefore steeper than the usual de Vaucouleurs profile; and a central core ( 07) with a characteristic “cuspy” profile.
-
2.
The color index image and the subtraction of the underlying stellar component represented by the fitted Sérsic profile from the V image revealed the presence of a small ( 105 pc) dust disk, oriented at PA 125° and inclined 77° with respect to the line-of-sight, with mass 150.
-
3.
The stellar rotation in the inner 20″ can be quite well described by a parametric disk model. The model indicates that the disk is inclined 26° relative to the sky plane, with the apparent major axis located at PA 67°. While our analysis does not unambiguously demonstrate the existence of a stellar disk in NGC3379, it shows that within the limitations of the data, rotation in a planar disk is a plausible fit to the observed stellar rotation curves.
-
4.
The gas in the inner 5″ rotates in the same direction, although much faster, than the stars.
References
- (1)
- (2) Balcells, M. & Quinn, P. J. 1990, ApJ, 361, 381.
- (3)
- (4) Bender, R., Capaccioli, M., Macchetto, F. D. & Nieto, J.-L. 1989, The Messenger, 55, 6.
- (5)
- (6) Bender, R., Saglia, R. P. & Gerhard, O. E. 1994, MNRAS, 269, 785.
- (7)
- (8) Bertola, F., Bettoni, D., Danziger, J., Sadler, E., Sparke, L. & de Zeeuw, T. 1991, ApJ, 373, 369.
- (9)
- (10) Biretta, J. A., et al. 1996, WFPC2 Instrument Handbook, Version 4.0 (Baltimore:STScI).
- (11)
- (12) Capaccioli, M. 1987, in IAU Symp 127 “Structure and Dynamics of Elliptical Galaxies”, ed. T. de Zeeuw (Dordrecht:Reidel), p. 47.
- (13)
- (14) Capaccioli, M. 1990, in “Bulges of Galaxies”, ed. B. Jarvis & D. M. Terndrup (Garching:ESO), p. 231.
- (15)
- (16) Capaccioli, M., Held, E. V., Lorenz, H. & Vietri, M. 1990, AJ, 99, 1813.
- (17)
- (18) Capaccioli, M., Vietri, M., Held, E. V. & Lorenz, H. 1991, ApJ, 371, 535. (C91)
- (19)
- (20) Ciardullo, R., Jacoby, G. H. & Ford, H. C. 1989, ApJ, 344, 715.
- (21)
- (22) Coté, P., Marzke, R. O. & West, M. J. 1998, ApJ, 501, 554.
- (23)
- (24) Crane, P., et al. 1993, AJ, 106, 1371.
- (25)
- (26) Dalle Ore, C., Faber, S. M., Jesus, J., Stoughton, R. & Burstein, D. 1991, ApJ, 366, 38.
- (27)
- (28) de Vaucouleurs, A., & Longo, G. 1988, “Catalogue of Visual and Infrared Photometry of Galaxies from 0.5m to 10m (1963 – 1985)”, Univ. of Texas Monographs in Astronomy (Austin:Univ. of Texas).
- (29)
- (30) Faber, S. M., et al. 1997, AJ, 114, 1771.
- (31)
- (32) Ferrarese, L. & Ford, H. C. 1999, ApJ, 515, 583.
- (33)
- (34) Ferrarese, L., van den Bosch, F. C., Ford, H. C., Jaffe, W. & O’Connell, R. W. 1994, AJ, 108, 1598.
- (35)
- (36) Ferrari, F., Pastoriza, M. G., Macchetto, F. D. & Caon, N. 1999, A&AS, 136, 269.
- (37)
- (38) Forbes, D. A., Franx, M. & Illingworth, G. D. 1995, AJ, 109, 1988.
- (39)
- (40) Franx, M., Illingworth, G. D., & Heckman, T. 1989, ApJ, 344, 613.
- (41)
- (42) Kormendy, J. 1999, in “Galaxy Dynamics”, ed. D. R. Merrit, M. Valluri, & J. A. Sellwood (San Francisco:ASP), in press.
- (43)
- (44) Gebhardt, K., Richstone, D., Kormendy, J., Bender, R., Faber, S., Lauer, T., Magorrian, J., & Tremaine, S. 1996, BAAS, 189, 111.03.
- (45)
- (46) Hernquist, L. & Barnes, J. E. 1991, Nature, 354, 210.
- (47)
- (48) Illingworth, G. D. & Franx, M. 1989, in “Dynamics of Dense Stellar Systems”, ed. D. Merrit (Cambridge:Cambridge Univ Press), p. 13.
- (49)
- (50) Lauer, T. R. 1985, MNRAS, 216, 429.
- (51)
- (52) Lauer, T. R., et al. 1995, AJ, 103, 703.
- (53)
- (54) Lauer, T. R., et al. 1995, AJ, 110, 2622.
- (55)
- (56) Macchetto, F. D., Pastoriza, M. G., Caon, N., Sparks, W. B., Giavalisco, M., Bender, R. & Capaccioli, M. 1996, A&AS, 120, 463. (Paper I)
- (57)
- (58) Magorrian, J., et al. 1998, AJ, 115, 2285.
- (59)
- (60) Nieto, J.-L. 1989, in “Proc. 2nd Extragalactic Astronomy Regional Meeting” (Cordoba, Argentina) (Cordoba:Academia de Ciencias), p. 239.
- (61)
- (62) Nieto, J.-L., Bender, R. & Surma, P. 1991, A&A, 244, 25.
- (63)
- (64) Peletier, R. F., Davies, R. L., Davis, L. E., Illingworth, G. D. & Cawson, M. 1990, AJ, 100, 1091.
- (65)
- (66) Poulain, P. & Nieto, J.-L. 1994, A&AS, 103, 573.
- (67)
- (68) Sakai, S. , Madore, B. F., Freedman, W. L., Lauer, T. R., Ajhar, E. A. & Baum, W. A. 1997, ApJ, 478, 49.
- (69)
- (70) Sérsic, J. L. 1968, Atlas de Galaxias Australes (Cordoba:Universidad de Cordoba), p 141.
- (71)
- (72) Statler, T. S. 1994, AJ, 108, 111.
- (73)
- (74) Statler, T. S. & Smecker-Hane, T. 1999, AJ, 117, 839. (SS99)
- (75)
- (76) Strom, S. E., Strom, K. M., Goad, J. W., Vrba, F. J. & Rice, W. 1976, ApJ, 204, 684.
- (77)
- (78) van den Bosch, F. C., Ferrarese, L., Jaffe, W., Ford, H. C. & O’Conell, R. W., 1994, AJ, 108, 1579.
- (79)
- (80) van den Bosch, F. C., Jaffe, W. & van den Marel, R. P. 1998, MNRAS, 293, 343.
- (81)
- (82) van Dokkum, P. G. & Franx, M. 1995, AJ, 110, 2027.
- (83)
- (84) van der Marel, R. P. 1991, MNRAS, 2503, 710.
- (85)
- (86) van der Marel, R. P. 1999, AJ, 117, 744.
- (87)
- (88) Young, P. 1980, ApJ, 242, 1232.
- (89)


| Rootname | Filter | Exp. time |
|---|---|---|
| (s) | ||
| U2J20F01T | F555W | 500 |
| U2J20F02T | 500 | |
| U2J20F03T | 500 | |
| U2J20F04T | 160 | |
| U2J20F05T | F814W | 400 |
| U2J20F06T | 400 |
| Object | Pos. Angle | Exp. time |
|---|---|---|
| (deg.) | (s) | |
| NGC 3379 | 70 | 2 2700 |
| 115 | 2 2700 | |
| 160 | 2 2700 | |
| Kinematic standards | ||
| HR 2305 | par. angle | 1 |
| HR 3110 | par. angle | 1 |
| HR 25074 | par. angle | 1 |
| HR 3122 | par. angle | 1 |
| Spectrophotometric standards | ||
| LTT 7379 | par. angle | 120 |
| EG 274 | par. angle | 180 |
| LTT 7987 | par. angle | 180 |
| Parameter | V | I |
|---|---|---|
| Cuspy Law | ||
| (mag) | 15.05 0.02 | 12.98 0.02 |
| 0.210 0.004 | 0.203 0.005 | |
| Sérsic Law | ||
| (mag) | 19.1 0.1 | 17.0 0.2 |
| (″) | 12.7 0.5 | 12.4 0.6 |
| 2.36 0.05 | 2.39 0.07 | |
| Parameter | Model |
|---|---|
| A (km s-1) | 113 (110 – 117) |
| p | 1.0 |
| Co (″) | 5.8 (5.7 – 5.9) |
| (°) | 67 (67 – 72) |
| (°) | 26 (25 – 28) |