The Evolution of 3CR Radio Galaxies from z=1
Abstract
We present the results of a comprehensive re-analysis of the images of a virtually complete sample of 28 powerful 3CR radio galaxies with redshifts from the HST archive. Using a two-dimensional modelling technique we have derived scalelengths and absolute magnitudes for a total of 16 3CR galaxies with a median redshift of . Our results confirm the basic conclusions of Best, Longair & Röttgering (1997, 1998) in that we also find 3CR galaxies to be massive, well-evolved ellipticals, whose infrared emission is dominated by starlight. However, we in fact find that the scalelength distribution of 3CR galaxies at is completely indistinguishable from that derived for their low-redshift counterparts from our own recently-completed HST study of AGN hosts at . There is thus no evidence that 3CR radio galaxies at are dynamically different from 3CR galaxies at low redshift. Moreover, for a 10-object sub-sample we have determined the galaxy parameters with sufficient accuracy to demonstrate, for the first time, that the 3CR galaxies follow a Kormendy relation which is indistinguishable from that displayed by low-redshift ellipticals if one allows for purely passive evolution. The implied rather modest level of passive evolution since is consistent with that predicted from spectrophotometric models provided one assumes a high formation redshift () within a low-density Universe. We conclude that there is no convincing evidence for significant dynamical evolution among 3CR galaxies in the redshift interval , and that simple passive evolution remains an acceptable interpretation of the relation for powerful radio galaxies.
keywords:
galaxies: active – galaxies: evolution – galaxies : fundamental parameters1 Introduction

It has been known since the early 1980’s that the hosts of powerful radio galaxies display a tight relation between the -band magnitude and redshift (Lilly & Longair 1984). In recent years it has been shown that, at least out to , essentially the same relation is followed by both the less powerful Parkes Selected Regions (PSR) and 6C radio galaxies (Dunlop et al. 1989; Eales et al. 1997) and by X-ray selected brightest cluster galaxies (Collins & Mann 1997). When the -band magnitudes of the 3CR galaxies are corrected for the expected effects of passive evolution of their stellar populations they appear to represent rather good standard candles from the present day out to redshift one and greater. Consequently, for many years it was widely accepted that the tightness of the relation for the 3CR radio galaxies could be most naturally explained by the most powerful radio galaxies having a rather well-defined mass, being formed at , and evolving basically passively thereafter.
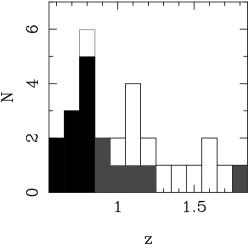
However, this long-held view has recently been challenged in a series of papers by Best, Longair & Röttgering (1997,1998), hereafter BLR. Between 1994–1996 BLR undertook an extensive study of a virtually complete sample of powerful FRII 3CR galaxies in the redshift range (see Fig 1). BLR obtained V and I–band HST images, J and K–band UKIRT images, and complimentary radio observations at 8.4 GHz with the VLA.
BLR made use of the four broad–band images they obtained for each of their sources to perform spectral synthesis fitting. The four broad–band fluxes where fitted by a simple two-component model consisting of an old stellar population and a power-law contribution which represented any possible aligned component. The stellar population SED’s were constructed from the models of Bruzual & Charlot (1993), and assumed a 1-Gyr burst of star formation at , with the stars evolving passively from that point onwards to the redshift of the particular 3CR galaxy. The assumed form of any possible nuclear/aligned emission was a power-law of the form which was used as a compromise between the likely contributions of quasar/starburst/dust scattered emission. The results of this fitting procedure (BLR 1998) show that the broad–band fluxes from these 3CR galaxies are fully consistent with that expected from an old passively evolving stellar population, as required in the traditional interpretation of the relation.
However, the results of the determination of the elliptical galaxy half-light radii performed by BLR, combined with a summary of the literature concerning the environments of 3CR galaxies at high and low redshift, led BLR to challenge the traditional view of the relation. Using the method of fitting de Vaucouleurs templates to azimuthally averaged luminosity profiles, BLR produced best–fit scalelengths for 19 of their 28 objects (excluding 3C41 and 3C22 which have a large nuclear contribution (Leyshon & Eales 1998) not dealt with in the BLR fitting scheme). The results of this profile fitting revealed a mean scalelength of kpc (). As pointed out by BLR this is significantly larger than the kpc found to be typical of low redshift ellipticals by Schombert (1987), and only around a factor of two smaller than the average scalelength of low- brightest cluster galaxies (BCG), kpc, found by the same author. Combining this result with the relation found by Kormendy (1977), and confirmed by our HST AGN host galaxy study (Dunlop et al 2000), BLR argue that even at the hosts of 3CR radio galaxies are highly evolved massive systems, possibly larger by a factor of two than their low- counterparts.
Combining the apparent similarity of the 3CR galaxies to BCG at the same redshift, with results from the literature concerning the environments of high redshift radio galaxies (see BLR 1998 for a review), BLR concluded that the passive appearance of the relation is a cosmic conspiracy. The general picture given by existing studies is that the environments of 3CR’s are consistent with moderately rich clusters; galaxy–galaxy cross-correlation function measures are consistent with Abell class 0, or richer (Hill & Lilly 1991), while multi-colour imaging shows many companion objects consistent with passively evolving coeval galaxies (Dickinson 1997). As pointed out by BLR, the same is not found in existing studies of the environments of low redshift 3CR’s (Prestage and Peacock 1988), where it has been reported that these objects reside in fairly low-density environments and have smaller characteristic sizes and luminosities than their high-redshift counterparts (Lilly and Prestage 1987).
On the basis of the apparent redshift dependence of 3CR cluster environments BLR argued that the 3CR galaxies at and cannot be linked by a simple “closed-box” passive evolution scheme. In the picture favoured by BLR, the relation can be explained by the two 3CR galaxy samples having different dynamical evolutionary histories, but being observed at the points in their respective histories where they both contain a characteristic mass of stars; a few times . The 3CR galaxies would reach this mass first due to their location in a larger density peak producing strong merging between . The 3CR galaxies at low- would reach the characteristic mass later through merging within their weaker cluster environment between and the present day, as is expected in many hierarchical galaxy formation models (Kauffmann 1999). The 3CR galaxies at would obviously also grow through merger activity in this redshift range and would become the radio dormant BCG we see today at low redshift, radio activity having ceased presumably due to the lack of available gas to feed their central black-hole. Although this picture is both consistent and appealing, it is dependent on the acceptance of environmental studies which now date back years, together with the finding that 3CR galaxies at have sizes comparable to BCG at that epoch, something which is not found to be true for low- 3CR galaxies.
It was a careful examination of the methods used by BLR in determining their scalelengths which provided the original motivation for this paper. As mentioned above, scalelengths were presented by BLR for 19 of their 28 object sample (the images of the excluded 9 objects having poor signal-to-noise or suffering from extreme aligned emission). However, only 6 of these 19 scalelengths where actually determined from the high resolution HST imaging. The reason for this is that the one-dimensional profile fitting technique employed was unable to cope with the masking of significant contamination by companion objects or aligned emission. The majority of the scalelength information presented by BLR was in fact derived from the analysis of their -band imaging data obtained at UKIRT. As reported by BLR, this imaging was obtained in seeing conditions with typically 54 minutes of on-source integration which, considering the redshift range of the objects, leaves a relatively small amount of data which has both good signal-to-noise and is free from substantial seeing effects. The use of an analytical gausian function to represent what has proven to be the extremely complicated IRCAM3 PSF (McLure et al 1999b) casts further doubt on the quoted scalelength values.
Experience gained from the comparison of our modelling results of AGN host galaxies (McLure et al 1999a, McLure et al 1999b) with those previously obtained from typically -band imaging (Dunlop et al. 1993, Taylor et al. 1996) has demonstrated to us that the twin benefits of high resolution and a temporally stable PSF tend to combine to revise the best-fitting galaxy scalelength downwards. The main reason for this systematic trend appears to be that the high spatial resolution provided by HST allows the reliable identification of separate companion objects and their subsequent masking from the modelling process, preventing the inclusion of extra flux from biasing the scalelength determination to higher values. This effect is obviously only going to be strengthened at redshifts of where the angular separation between companion objects and the target can easily be of the same order as the typical seeing experienced during the BLR UKIRT observations.
Given these considerations it was felt worthwhile to re-examine the publically available HST data to determine whether the use of the full two-dimensional analysis utilised in the quasar host galaxy programme would produce significantly different scalelength figures from those published by BLR.
2 Data Reduction
| Source | z | Filter | Exp Time/s | /′′ | /kpc | / | ||
|---|---|---|---|---|---|---|---|---|
| 3C22 | 0.938 | F814W | 1400 | 0.7 | 5.9 | 22.3 | 19.8 | 0.306 |
| 3C34∗ | 0.690 | F785LP | 1700 | 3.0 | 23.8 | 24.2 | 18.8 | 0.002 |
| 3C41∗ | 0.795 | F785LP | 1700 | 0.8 | 6.3 | 22.2 | 19.7 | 0.170 |
| 3C49∗ | 0.621 | F814W | 1400 | 2.0 | 15.0 | 23.0 | 18.9 | 0.000 |
| 3C65 | 1.176 | F814W | 1760 | 1.2 | 9.9 | 24.5 | 20.9 | 0.088 |
| 3C217 | 0.897 | F814W | 1700 | 0.7 | 5.8 | 22.0 | 20.1 | 0.007 |
| 3C226∗ | 0.820 | F785LP | 1700 | 1.0 | 8.5 | 22.6 | 19.4 | 0.050 |
| 3c239 | 1.781 | F814W | 2200 | 1.3 | 10.8 | 23.5 | 19.7 | 0.041 |
| 3C247∗ | 0.749 | F814W | 2400 | 3.1 | 25.2 | 24.1 | 18.6 | 0.025 |
| 3c252 | 1.105 | F814W | 1700 | 0.9 | 7.3 | 23.2 | 20.5 | 0.000 |
| 3C277.2∗ | 0.766 | F814W | 2400 | 0.9 | 7.6 | 22.5 | 19.7 | 0.005 |
| 3C289 | 0.967 | F814W | 1800 | 2.1 | 18.0 | 24.9 | 20.0 | 0.063 |
| 3C337∗ | 0.635 | F814W | 1400 | 0.8 | 6.4 | 22.5 | 19.8 | 0.055 |
| 3C340∗ | 0.775 | F785LP | 1700 | 0.5 | 4.3 | 21.3 | 19.7 | 0.000 |
| 3C352∗ | 0.806 | F814W | 1800 | 2.2 | 18.1 | 24.7 | 19.6 | 0.024 |
| 3C441∗ | 0.708 | F785LP | 1700 | 1.4 | 10.9 | 22.7 | 19.1 | 0.023 |
All the HST images taken of the 3CR galaxies in the 28-object BLR sample were obtained from the HST archive facility111http://archive.stsci.edu. A detailed list of redshifts, filters and exposure times can be found in Table 1 of BLR (1997). An investigation of the shorter-wavelength exposures of each object (mainly F555W, F622W) confirmed that they were either of insufficient signal-to-noise to be useful, or dominated by emission aligned with the radio axis. Of the 28 objects in the sample, preliminary analysis of the -band images revealed a total of 16 which could be successfully modelled with our two-dimensional technique. The observational parameters of these 16 objects are detailed in Table 1 and illustrated as part of the full sample in Fig 2 .
For each object there are two cr-split -band exposures of unequal length available, together giving a typical exposure time of seconds. The initial processing of the images, flat-fielding and bias removal, was carried out by the standard HST pipeline. The two exposures were then combined using the iraf task crrej, which successfully removes cosmic ray events using a sophisticated sigma-clipping algorithm. The next step in the reduction process was the fitting of a plane to the image with the 3CR galaxy masked out, to accurately determine the sky background while allowing for any residual flat-fielding gradients that may have been present. The final step was the production of a two-dimensional mask for each source which eliminated any companion objects, or aligned emission, from the model-fitting process, as well as any regions of the image that could have been biased by scattered light from nearby bright stars.
In the vast majority of cases the high resolution provided by the HST allowed the identification, and subsequent masking, of companion objects and diffuse aligned emission in a straightforward fashion. For a small number of sources (3C252 & 3C239) the question of which areas of the images should be masked was more ambiguous, due to the HST images revealing double nuclei which are not apparent in near-infrared images (BLR 1997). As mentioned by BLR, the detection of two nuclear components in these sources suggests either that they are the products of recent mergers, or alternatively, contain a central dust lane. Given the undisturbed appearance of the K–band images of these sources (BLR 1997), it was decided that no attempt would be made to mask the central regions of the HST images before modelling.
None of the objects comprising the 10-object sub-sample (see Section 4) appear to be highly disturbed in the HST images, and consequently return model fits which are largely insensitive to the details of aligned-emission masking. The advantage of being able to mask areas of the HST images, while still running the model fitting in two-dimensions, has allowed us to take greater advantage of the HST data than was possible with the one-dimensional analysis techniques employed by BLR.
2.1 Empirical PSF Determination
Simple radial surface-brightness plots for the 16 objects chosen for modelling reveals that there is sufficient signal-to-noise to allow fitting to a typical radius of . It is therefore necessary to have a point spread function (PSF) to convolve our model galaxies with which has good signal-to-noise out to at least this radius. Due to the synthetic PSF’s produced by the tinytim software package (Krist 1995) being unable to reproduce the WFPC2’s scattered light halo outside a radius of , it is clear that an empirical PSF is required for the modelling of these data. A glance at Table 1 reveals that all of the exposures utilised here were imaged through either the F785LP or F814W filters. This required the acquisition of two relatively deep PSF’s imaged with the correct filter/chip combination, which were also located close to the average chip position of the 3CR galaxies, in order to avoid the noticeable positional variation of the WFPC2 PSF. An interrogation of the HST PSF search tool 222http://www.stsci.edu/instruments/wfpc2/ produced disappointing results, with all available PSF’s either too faint or too small in angular extent.
Fortunately, two suitable stars were present on the exposures of 3C41 (F785LP) and 3C239 (F814W). Due to the need for sufficient depth in the PSF wings, both of these stars had saturated cores in even the shortest exposures. To overcome this problem a modified version of the PSF re-sampling technique described in McLure et al 1999b was implemented. Both PSF’s were only saturated within a radius of of their core, well inside the radius where tinytim can accurately reproduce the empirical PSF. Making use of this, the two PSF’s had their core replaced with the equivalent tinytim model, the relative scaling being determined by matching the flux in an annulus between . Another advantage of this approach is that due to tinytim’s ability to produce model PSF’s at up to 50 times oversampling, sub-pixel centring of the PSF can be matched to that of the galaxies to an accuracy of . Although not as crucial as with the quasar host work it is still important to overcome the severe undersampling of WFPC2, especially as several of the 3CR galaxies modelled proved to have a substantial point-source contribution.
3 Modelling
| Source | z | ||
|---|---|---|---|
| 3C34 | 0.690 | 21.7 | 24.9 |
| 3C41 | 0.795 | 19.4 | 24.5 |
| 3C49 | 0.621 | 20.5 | 24.5 |
| 3C226 | 0.820 | 19.7 | 24.9 |
| 3C247 | 0.749 | 21.2 | 25.4 |
| 3C277.2 | 0.766 | 19.5 | 24.4 |
| 3C337 | 0.635 | 19.9 | 23.7 |
| 3C340 | 0.775 | 18.5 | 24.4 |
| 3C352 | 0.806 | 21.1 | 24.7 |
| 3C441 | 0.708 | 20.1 | 24.7 |
The modelling of these objects proceeded in an identical fashion to that of the AGN sample studied by McLure et al. (1999a) and Dunlop et al. (1999). Each object was modelled with both a standard Freeman disc template and de Vaucouleurs profile, with no a priori assumptions being made about position angle, axial ratio or any possible central point-source contribution. Prior to the modelling of each source a maximum radius, outside of which pixels would be excluded for insufficient signal-to-noise, was determined by an examination of the one-dimensional surface-brightness profile. The median value for this outer radius was , corresponding to a physical radius of kpc at the median redshift of (). This is reasonably well matched to the outer radius of ( kpc) used for each of the radio galaxies in the AGN sample, ensuring that the same physical region of the galaxy light distribution is under investigation in both redshift regimes. The modelling technique strongly preferred a host galaxy for all objects analysed. The quality of the fits was good, with no significant residual flux.
4 Results

In this section the scalelength, absolute luminosity and Kormendy relation results from our two-dimensional modelling of the objects are presented. Due to the significant effect that choice of cosmology can have on angular diameter, cosmological dimming and look-back time over this redshift range, we give these results for a range of possible cosmologies. Four different representative scenarios are considered featuring two values of (50,70), together with both open () and flat () geometry.
The results from the modelling of all 16 HST objects are presented in Table 1. The main conclusions reached from this modelling work are based largely on the results for a 10-object sub-sample. The sub-sample consists of the low-redshift end of the BLR sample and is illustrated in Fig 2. The remaining 6 objects () have been excluded from the following analysis due to the incursion of the Å break into the HST F814W filter. The throughput of the F814W filter is shown in Fig 3 complete with the system response and CCD quantum efficiency. As can be seen from this Figure, for objects with redshifts this filter will bridge the Å break, meaning that it can no longer be assumed that the detected flux has originated from the dominant old stellar population. Given that the alignment effect in radio galaxies is stronger in the rest-frame UV than at longer wavelengths it is to be expected that these objects are contaminated by a significant aligned component. The -object sub-sample has the advantage of having a tight redshift distribution with a mean of and a median of , which is well matched by the distribution of the radio galaxies studied at low-, with its mean redshift of and median of . This allows a direct comparison between the two samples without the added complication of allowing for significant evolutionary effects within the samples themselves.
4.1 Scalelengths

| median / kpc | / kpc | ||
|---|---|---|---|
| 1 | 50 | 9.7 | |
| 1 | 70 | 8.2 | |
| 0.1 | 50 | 11.5 | |
| 0.1 | 70 | 8.2 |
The results of our determination of galaxy half-light radius () for the 10-objects in the sub-sample are presented in Table 3. Two features of this table are immediately obvious. Firstly, it is clear that regardless of cosmology the derived half-light radii are remarkably consistent, with both the mean and median values agreeing to within 4 kpc. Secondly, the mean scalelength is systematically larger than the median in all four cosmologies, consistent with the suggestion from Fig 4 that the distribution of scalelengths from the full 16-object sample, and indeed our 20 radio-loud AGN at , has a substantial tail toward high values.
Given that the scalelength results obtained by BLR are quoted assumming it is straightforward to investigate what differences exist between their scalelength determinations and those presented here. Due to the fact that most of the BLR scalelength information is derived from their K–band observations rather than the HST images, it is not the case that they have published a scalelength value for each of the objects re-modelled in this paper. In order to perform a comparison between the two sets of results it has been necessary to simply base the BLR figures on the 8-objects from our 10-object sub-sample for which they have derived a scalelength value.
Assuming the mean scalelength of the 10-object sample is kpc with a median of kpc. The corresponding BLR-derived values for of these objects are kpc with a median of kpc. Given the small number statistics that are available, and the inherent difficulty in constraining galaxy scalelengths, the median is the more robust measure of the typical scalelength. Using the median it can be seen from these figures that the one-dimensional analysis technique employed by BLR has systematically overestimated the characteristic size of the 3CR galaxies by .
In order to check that the use of these two cut-down samples was not overtly biasing the results, a comparison was also performed between the full -object sample and the -objects from this sample for which there is also a BLR-derived scalelength figure available. The mean scalelength of the -object sample is kpc with a median of kpc. The corresponding BLR-derived values for of these objects are kpc with a median of kpc. It can be seen from this that the use of the expanded samples strengthens the conclusion that the BLR scalelengths are overestimated, with the median BLR scalelength being greater than the two-dimensional modelling results presented here.
4.2 Absolute Magnitudes
| Median MI | ||||
|---|---|---|---|---|
| 1.0 | 50 | 0.2 | 24.52 | |
| 1.0 | 50 | 0.8 | 24.60 | |
| 1.0 | 70 | 0.2 | 23.69 | |
| 1.0 | 70 | 0.8 | 23.87 | |
| 0.1 | 50 | 0.2 | 24.54 | |
| 0.1 | 50 | 0.8 | 24.98 | |
| 0.1 | 70 | 0.2 | 23.80 | |
| 0.1 | 70 | 0.8 | 24.25 |
The absolute Cousins -band magnitudes for the and sub-samples are listed in Table 4 for the four different cosmologies. The values shown are calculated from integrating the best-fit de Vaucouleurs profile to infinite radius in order to be consistent with the published results for the low- AGN hosts (McLure et al 1999a, Dunlop et al 1999). As was pointed out in Section 2 the objects comprising the sub-sample were imaged through two separate HST filters; F814W and F785LP. The F814W filter is a member of the standard HST filter set and closely mimics the Cousins -band filter. As a result, it was decided to convert all of the integrated apparent magnitudes to their equivalent Cousins -band value. The objects from the sub-sample imaged with the F814W filter had no correction applied to them since the similarity of the F814W and Cousins -band filters is such that for elliptical galaxies the difference in magnitude is expected to be less than in all cases. This level of photometric accuracy is substantially greater than is possible in the face of the uncertainties in determining the host magnitudes.
The throughput for the F785LP filter is significantly different from that of the Cousins -band filter. The conversion from magnitudes obtained through this filter to Cousins -band magnitudes is therefore more complicated. The original strategy to overcome this problem was to make use of the one object from the -object sample (3C239) for which there are exposures in both filters available with comparable signal-to-noise. However, this object has the highest redshift, , of all of the objects in the BLR sample and subsequently the two images were too faint to get a reliable conversion. In addition to this, 3C239 has a highly distorted morphology in the HST images (BLR 1997), making it unclear whether a conversion factor obtained from this object would be applicable to the mostly undistorted objects in the sub-sample. In light of this, the method used to convert the F785LP fluxes for each host to the equivalent F814W figure, and hence Cousins I-band magnitude, was to predict the count rates (pixel-1) of a source of apparent visual magnitude in the two filters using the filter ratios of Holtzman et al 1995.
The cosmology-independent k-corrections for each object, produced by the blueward shifting of the -band filter along the galaxy spectrum with increasing redshift, were calculated from the figures presented for a burst-elliptical galaxy by Rocca-Volmerange & Guiderdoni (1988). Given that the predictions produced by different spectral synthesis codes can differ significantly (Charlot et al 1996) it was considered worthwhile to make an independent check of the validity of these k-corrections. Due to the restriction of this analysis to the -object sub-sample, for which the images sample galaxy light longward of the Å break, it is possible to estimate the necessary cosmological k-corrections by modelling the galaxy spectrum as a power-law of the form , where is the spectral index. The value of appropriate for radio galaxies imaged in the -band was estimated to be from a typical old (Gyr) elliptical galaxy spectrum. Alternatively, the mean colour of the sub-sample objects can be used to estimate the spectral index, a process which also results in a figure of . Both of these estimates are in good agreement with the value of needed to reproduce the k-corrections of Rocca-Volmerange and Guiderdoni (1988). The question of whether the absolute magnitudes presented in Table 4 are substantially different from the results previously obtained for the radio galaxies is addressed within Section 5.
4.3 The Kormendy Relation
Given that the hosts of the radio galaxies within the sub-sample are well fitted by a standard de Vaucouleurs galaxy template, it is interesting to see whether the parameters obtained from these fits produce a Kormendy relation comparable to that followed by both low- inactive ellipticals (and the hosts of the AGN, see Section 5). The values required to construct the Kormendy relation have been corrected for the cosmological dimming of surface-brightness according to:
| (1) |
where a value of has been assumed. The resulting relations for the four cosmologies are given in Table 5.
It is clear from this that the choice of cosmology makes no significant difference to the slope of the Kormendy relation (as expected given the small redshift range of the objects), and that in all cases this slope is consistent with that of displayed by inactive low- ellipticals (Kormendy 1977).
It is worth noting that the and parameters from the one-dimensional modelling of BLR failed to produce a relation which was consistent with the expected slope of . The modelling results of BLR had the 3CR galaxies lying along a constant luminosity slope of , exactly as is expected when the galaxy luminosities have been well determined but the scalelengths have not been constrained (Abraham et al. 1992). The fact that the relation presented above is consistent with the Kormendy relation, within the errors, can therefore be taken as further evidence that our two-dimensional modelling has been much more successful in constraining the scalelengths of the sub-sample objects. The possibility of using the Kormendy relations derived above to test for the effects of passive or dynamical evolution is explored in section 5.3.
5 Comparison with low-redshift Radio Galaxies
5.1 Scalelengths
| median / kpc | / kpc | ||
|---|---|---|---|
| 1 | 50 | 11.3 | |
| 1 | 70 | 8.1 | |
| 0.1 | 50 | 11.9 | |
| 0.1 | 70 | 8.5 |
The derived median and mean scalelengths for the 10-source radio galaxy sample from our low- AGN host galaxy study (McLure et al. 1999a, Dunlop et al. 1999) are presented in Table 6. A comparison of these results with those presented for the sub-sample in Table 3 shows the two groups of galaxies to have very similar characteristic scalelengths. The poorest agreement between the two sets of results is for the cosmology. However, even in this case the figures are consistent to within the errors. In the other three cosmologies the median and mean scalelengths for the two samples are basically identical, differing by kpc in all cases. The similarity between the scalelength distributions of the two sub-samples is confirmed by an application of the Kolmogorov–Smirnov (KS) test. For the two cosmologies the KS test returns a probability of 0.68 that the two samples are drawn from the same underlying distribution. This conclusion is even stronger in the cosmologies where the KS test returns a probability of 0.97 that the two distributions are the same. Therefore, we find no evidence that the galaxies comprising the sub-sample are systematically larger than their counterparts.
5.2 Absolute Luminosity
In order to allow a direct comparison of the characteristic luminosities of the low- and high-redshift radio galaxy sub-samples, and thereby look for any evidence of significant merger activity, it is first necessary to correct for the different filters and the expected passive evolution of the stellar populations. To achieve this it was decided to convert the -band magnitudes to their -band equivalents, and then to predict the brightening of the stellar population between and due to passive evolution alone. The present-day colour of an elliptical galaxy formed at high redshift () has been taken as (Fukugita et al. 1995). The corrections to be made for the effects of passive evolution have been calculated using the synthetic galaxy spectral models of Jimenez et al. (1996) using our chosen set of four possible cosmologies. Several different galaxy formation redshifts were considered to investigate their effects on the resulting correction. A comparison between the predicted amount of -band passive evolution between and and the difference in median absolute luminosity of the two samples is presented in Table 7.
It is immediately clear from these results that the difference in absolute -band luminosity between the and samples is inconsistent with the amount of passive evolution predicted by the stellar synthesis models within the two Einstein-de Sitter cosmologies. This is still true even in the model which allows present-day ellipticals to be as old as possible (); this model still requires 2.5 times more magnitudes of passive evolution than is seen in the data.
Adoption of either of the open cosmologies results in a measured difference in absolute luminosity of mags between the two galaxy samples (columns 3 & 4). As can be seen from Table 7, this luminosity difference is formally consistent with the expected passive evolution in both open cosmologies, for all alternative formation redshifts. However, it is interesting to note from Table 7 that the cosmology clearly provides the best match between the data and the spectrophotometric model predictions. In this cosmological picture the model predictions are perfectly consistent with the data for all star formation redshifts of , in good agreement with recent discoveries of old stellar population ellipticals at redshifts of (Dunlop et al. 1996, Spinrad et al. 1997, Stiavelli et al. 1999 ).
| Mmed | Mmean | Mmodel | ||||
|---|---|---|---|---|---|---|
| 1 | 50 | 0.17 | 0.180.16 | 0.52 | 0.60 | 0.70 |
| 1 | 70 | 0.17 | 0.180.16 | 0.63 | 0.60 | 0.56 |
| 0.1 | 50 | 0.52 | 0.440.16 | 0.26 | 0.24 | 0.46 |
| 0.1 | 70 | 0.43 | 0.450.16 | 0.38 | 0.51 | 0.64 |
5.3 Kormendy Relation

| 1.0 | 50 | -0.24 | 0.43 | 0.56 |
|---|---|---|---|---|
| 1.0 | 70 | -0.24 | 0.44 | 0.58 |
| 0.1 | 50 | 0.18 | 0.60 | 0.84 |
| 0.1 | 70 | 0.19 | 0.60 | 0.84 |
If the two samples of radio galaxies can truly be linked by a single population of passively evolving ellipticals it is to be expected that they should follow Kormendy relations which are identical except for a simple vertical shift in surface-brightness. After making the appropriate surface-brightness corrections (Section 4.3) and -band filter transformation (Section 5.2) the least-squares fit to the Kormendy relations formed by the radio galaxies are shown in Table 8.
It can be seen from this that, as for the galaxies, the choice of cosmology makes little difference to the slope of the Kormendy relation, although the normalization does change significantly. It is also apparent that the low- objects appear to follow a substantially flatter relation, with a slope of 2.9 instead of 3.5, although clearly both values are consistent with the expected slope (due to the fairly substantial formal error in the fitted slope, which is predominantly a result of the small sample size and lack of dynamic range in radius). To facilitate a fair comparison of the high- and low- radio galaxy Kormendy relations, the least-squares fitting was repeated with an enforced intermediate slope of 3.20 . If it is indeed the case that these two galaxy populations can be linked by passive evolution alone then the vertical shift required to reconcile the Kormendy relations should be in good agreement with both that required to match the absolute magnitudes, and the passive evolution predictions of the stellar synthesis modelling. To explore what range of vertical magnitude shifts are allowed by the data, we performed the least-squares fitting (with fixed slope=3.20) not only with the best estimate of for each galaxy, but with the scalelengths of the sub-sample shortened and lengthened such that the KS test showed its scalelength distribution to differ from that of the sub-sample at the level. The results of this process are presented in Table 9. A comparison of the figures from Table 9 with those of Table 7 shows that in the models considered here it is only possible to reconcile the luminosity evolution predicted by the Kormendy relations with that predicted by the spectral modelling and the absolute magnitude distributions, separately. In these cosmologies it is impossible to force both alternative measures of the amount of luminosity evolution, and the predictions of the spectral modelling, into agreement. In contrast, the predictions from the Kormendy relations in the cosmologies comfortably bracket the offsets given in Table 7, thus leaving both alternative measures of the luminosity evolution in excellent agreement.
In theory, the Kormendy relations for the low and high-z sub-samples presented here offer an opportunity to constrain both cosmology and the prevalence of merger activity. However, in practise the effects of these are very closely coupled. For example, our results can be reproduced either by pure passive evolution since in an open Universe, or by modest growth ( growth in scalelength & luminosity) since in an Einstein-de Sitter Universe. Despite this inherent degeneracy the Kormendy relations can firmly exclude very strong growth () from mergers in the redshift range .
6 Conclusion
The results from a thorough re-examination of the BLR HST images of a sample of 3CR radio galaxies have been presented. It has been shown that, in terms of scalelength, absolute magnitudes and Kormendy relation there are no significant differences between and 3CR radio galaxies. The two populations appear to be fully consistent with being comprised of old stellar populations formed at high redshift and evolving passively thereafter.
It is obviously true that the fact that both the high and low-redshift radio galaxies have absolute luminosities consistent with pure passive evolution can easily be reconciled with the involvement of some dynamic evolution. In the dynamical model this simply requires that the proto-galactic clumps which merge to produce the final galaxies where formed reasonably coevally. The results presented here do not then require that these radio galaxies must have formed in a monolithic collapse at a single redshift. However, they do suggest strongly that the vast majority of merger activity within this population of massive ellipticals must have been completed before . Although semi-analytical galaxy formation models in a cosmology predict as much as 70% of present day ellipticals to already be in place by (Kauffman & Charlot 1999), it is worth remembering that the same is not true of BCGs, which are still predicted to grow by a factor of between and the present day (Aragón-Salamanca et al. 1998).
The crucial question still to be answered is whether or not it can be proven that a significant difference in cluster environment does exist between the two populations. If it can be shown that this is definitely the case then the argument forwarded by BLR that we are observing the effects of dynamical evolution producing the characteristic mass required for powerful radio emission at the two different epochs remains tenable; the correlation between luminosity and scalelength would actually predict the and sub-samples to have similar scalelength distributions. However, as was discussed in Section 1, while there have been numerous surveys carried out recently tackling the environments of high- radio sources, the work on the low- environments looks to be subject to possible systematic error. This suspicion is further strengthened by our new deep R–band HST images of the 10 radio galaxy sub-sample (McLure et al. 1999a, Dunlop et al. 2000). These images show numbers of apparent companion objects which appear consistent with Abell classes . This is in good agreement with our recent work to model the first to fourth-ranked brightest cluster galaxies (BCG) in clusters spanning Abell classes , imaged with HST (Dunlop et al. 1999). This work has shown that the scalelengths of these objects are not significantly different from the radio galaxy scalelength results presented here.
In an attempt to disentangle the radio galaxy environment problem, more near-infrared observations of the low- radio galaxies and quasars from our HST programme are planned, to compliment our existing R and B–band images of this sample. This combined dataset will allow a fully qualitative investigation of the cluster environments of the low- radio galaxies with which to compare with the existing high- environmental data.
If it transpires that there is no significant difference in 3CR environments at high and low-, then a much simpler picture of powerful radio galaxy evolution emerges. Combined with the scalelength evidence presented here, this would suggest that the host galaxies of powerful radio sources are basically the same sort of objects at all redshifts from . In this picture the fall-off in 3CR radio power over this redshift range would simply be due to the progressively smaller amount of gas available to feed the central engine.
7 Acknowledgements
We thank the referee Philip Best for comments which undoubtedly improved a number of aspects of this paper. Based on observations with the NASA/ESA Hubble Space Telescope, obtained at the Space Telescope Science Institute, which is operated by the Association of Universities for Research in Astronomy, Inc. under NASA contract No. NAS5-26555. This research has made use of the NASA/IPAC Extragalactic Database (NED) which is operated by the Jet Propulsion Laboratory, California Institute of Technology, under contract with the National Aeronautics and Space Administration. MJK acknowledges the award of a PPARC PDRA, and also acknowledges support for this work provided by NASA through grant numbers O0548 and O0573 from the Space Telescope Science Institute, which is operated by AURA, Inc., under NASA contract NAS5-26555. RJM acknowledges a PPARC studentship.
8 References
Abraham R.G., Crawford C.S., McHardy I.M., 1992, ApJ, 401, 474
Aragón-Salamanca A., Baugh C.M., Kauffmann G., 1998, MNRAS, 292, 427
Best P.N., Longair M.S., Röttgering H.J.A., 1997, MNRAS, 292, 758
Best P.N., Longair M.S., Röttgering H.J.A., 1998, MNRAS, 295, 549
Bruzual G., Charlot S., 1993, ApJ, 405, 538
Charlot, S., Worthey G., Bressan. A., 1996, ApJ, 457, 43
Collins C.A., Mann R.G., 1998, MNRAS, 297, 128
Dickinson M., 1997, in Tanvir N.R., Aragon-Salamanca A., Wall J.V., eds, HST and the high redshift Universe. Singapore: World Scientific, p.207
Dunlop J.S., Peacock J.A., 1993, MNRAS, 262, 936
Dunlop J.S., Taylor G.L., Hughes D.H., Robson E.I., 1993, MNRAS, 264, 455
Dunlop J.S., et al., 1996, Nature, 381, 581
Dunlop J.S., et al., 2000, MNRAS, in preparation
Eales S., Rawlings S., Law-Green D., Cotter G., Lacy M., 1997, MNRAS, 291, 593
Fukugita M., Shimasaku K., Ichikawa T., 1995, PASP, 107, 945
Hill G.J., Lilly S.J., 1991, ApJ, 367, 1
Holtzman J.A., et al, 1995, PASP, 107, 1065
Jimenez R., MacDonald J., 1996, MNRAS, 283, 721
Kauffmann G., Charlot S., 1999, astro-ph/9810031
Kormendy J., 1977, ApJ, 217, 406
Krist J., 1995, Astronomical Data Analysis and Systems IV, ASP Conference Series, Vol 77, R.A. Shaw, H.E. Payne, and J.J.E. Hayes, eds, 349
Laing R.A., Riley J.M., Longair M.S., 1983, MNRAS, 204, 151
Leyshon G., Eales S.A., 1998, MNRAS, 295,10L
Lilly S.J., Longair M.S., 1984, MNRAS, 211, 833
Lilly S.J., Prestage R.M., 1987, MNRAS, 225, 531
Oke J.B., Gunn J.E., 1983, ApJ, 226, 713
Madore B.F., et al., 1999, ApJ, 515, 29
McCarthy P.J., van Breugel W.J.M., Spinrad H., Djorgovski S., 1987, ApJ, 321, L29
McLure R.J., et al., 1999a, MNRAS, 308, 377
McLure R.J., et al., 1999b, MNRAS, submitted
Perlmutter S., et al., 1999, ApJ, 517, 565
Prestage R.M., Peacock J.A., 1988, MNRAS, 230, 131
Rocca-Volmerange B., Guiderdoni B., 1988, A&AS, 75, 93
Schombert J.M., 1987, ApJS, 64, 643
Spinrad H., et al., 1997, ApJ, 484, 581
Stiavelli M., et al., 1999, A&A, 343, L25
Taylor G.T., Dunlop J.S., Hughes D.H., Robson E.I., 1996, MNRAS, 283, 930