Energy Spectrum and Chemical Composition of Cosmic Rays between 0.3 and 10 PeV determined from the Cherenkov-Light and Charged-Particle distributions in Air Showers
Abstract
Measurements of the lateral distribution of Cherenkov photons
with the wide-angle atmospheric Cherenkov light detector
array AIROBICC and of the charged particle lateral distribution
with the scintillator matrix of the HEGRA air-shower detector
complex in air showers are reported.
They are used in conjunction to determine the energy spectrum and
coarse chemical composition of charged cosmic rays in the energy interval
from 0.3 PeV to 10 PeV.
With the atmospheric shower-front sampling technique
these detectors measure the electromagnetic component of an
extensive air shower via
the lateral density distribution of the shower particles and
of the Cherenkov photons.
The data are compared with events generated with the CORSIKA
program package with the QGSJET hadronic-event generator.
Consistency checks performed with primary energy-reconstruction
methods based on different shower observables indicate
satisfactory agreement between these extensive air shower simulations and
the experimental data.
This permits to derive results concerning the energy spectrum and
composition of charged cosmic rays.
The energy spectrum features a so called “knee” at an energy
of = PeV.
Power law fits to the differential energy spectrum yield
indices of below and
above the knee.
The best-fit elongation rate
for the whole energy range is determined to
78.3 1.0 (stat)
6.2 (syst) g/cm2. At the highest energies
it seems to decrease slightly.
The best-fit fraction of light nuclei decreases
from (combined
statistical and systematic) to
(combined
statistical and systematic) in the energy range discussed here.
A detailed study of the systematic errors reveals that a non-changing
composition cannot be excluded.
Key words: cosmic rays
1 Introduction
The origin of extra solar cosmic rays (CR) is one of the important
unresolved astrophysical questions.
Galactic shell type supernova remnants (SNR) have been proposed as plausible
acceleration sites for cosmic rays up to energies of several PeV
([Völk 1997]) and - for very massive
SN progenitors - to even higher energies ([Biermann et al. 1995]).
Recently direct experimental evidence for electron acceleration
in these objects has been found in the X-ray
([Koyama et al. 1995]; [Koyama et al. 1997]; [Allen et al. 1997]) and TeV -ray range
([Tanimori et al. 1998]).
Somewhat surprisingly, similar searches for evidence of hadron
acceleration have only yielded upper limits on the expected -ray
emission from the interaction of the hadrons with interstellar matter
up to now
([Prosch et al. 1996]; [Heß 1997]; [Buckley et al. 1998]).
An indirect approach to distinguish between different theoretical
models aiming to describe the acceleration of charged cosmic rays (CR)
is to measure the energy spectrum and composition of CR
and compare the results with model predictions.
Here the energy regime around the so called “knee” between 1 and
10 PeV is especially interesting([Watson 1997]).
In this energy range the all-particle CR energy spectral slope
- that is constant within measurement errors for lower energies -
suddenly increases.
The riddle of the origin of the knee and of the cosmic radiation
with energies exceeding it, is not yet finally resolved.
The following general solutions have been discussed:
1. The change in index is due to some propagation
effect in an “original” cosmic-ray population that
displays an unbroken power law from low energies
up to energies above the knee. The most
popular idea is that the energy dependence
of the diffusion constant of cosmic rays in the Galaxy
could change in the knee region ([Peters 1961]; [Ptuskin et al. 1993]).
Because of the dependence of the
diffusion constant on the nuclear
charge Z a modest decrease in the fraction of “light”
elements (hydrogen and helium)
would be expected. In the simplified chemical model we
use below (heavy elements
modelled by 65 oxygen and 35 iron, light elements
by 40 hydrogen and 60 helium)
the fraction of light elements would be expected
to decrease from an assumed value of 60 %
below the knee to 43 % above the knee.
In such a model (barring a special
cancellation of effects) the knee is expected
to be a relatively smooth
feature, extending over about a decade in energy.
A principal problem with this approach is
that no plausible Galactic source of cosmic rays has been identified
which is quantitatively
capable of producing the “original” cosmic-ray population.
2. The knee signals in some way the maximum energy
for the sources responsible for low energy cosmic rays.
The cosmic rays at higher energies could be “re-accelerated”
low energy cosmic-rays, e.g. at the shock front of a Galactic
wind (Jokipii Morfill 1987) or an ensemble of shock fronts in
clusters of massive stars ([Bykov et al. 1997]).
In this case a phenomenology similar
to the diffusion model in the previous paragraph would be expected.
Alternatively, above the knee a completely new population
of cosmic rays dominates. In this case typically dramatic
changes in chemical composition are expected, e.g. to pure hydrogen
in the extragalactical model of Protheroe ([1992])
and nearly pure heavy elements (fraction of light elements
0.3 far above the knee) in a model with special SNRs by
Stanev et al. ([1993]). The special properties
of these new sources could in principle allow to understand a
knee relatively “sharp” in energy.
To definitely discriminate between
a composition changing
as expected in models with an
energy dependent diffusion constant (discussed
above under 1.) and an unchanging composition,
it is necessary to achieve an
error of smaller than 10 in the experimental
determination of the fraction
of light elements in the total cosmic radiation above the knee.
While the cosmic-ray composition and energy spectrum are well known
from direct balloon and space-borne observations
up to energies of
about 100 TeV, no general agreement has been reached at higher energies
([Watson 1997]).
The results obtained for CR around the “knee” suffer seriously
from the fact that due to the low flux of CR above 1 PeV, only large
ground based installations observing the extensive air showers (EAS)
induced by cosmic rays in the atmosphere can provide experimental
data.
However the sensitivity of EAS observables to the mass of the
primary CR is weak. The analyses are rendered even
more difficult due to theoretical uncertainties concerning the
high energy interactions in the atmosphere
([Knapp et al. 1996]; [Gaisser 1997]).
Here we present an analysis of EAS between 300 TeV and 10 PeV
which restricts to observables related to the electromagnetic shower
component.
In the following sections the experimental setup (section 2),
the Monte-Carlo simulations (section 3),
the event reconstruction
(section 4) and analysis methods (section 5)
are described.
Sections 6 presents the results concerning the CR energy spectrum
and the coarse mass composition.
A more detailed study of the
systematic errors and a discussion of methods to analyse the composition
without relying on the absolute penetration depth are
discussed in section 7.
The paper ends with conclusions in section 8.
2 The experimental Setup
The air-shower detector complex HEGRA covers an area of
180180 m2 at a height of 2200 m a.s.l. (790 g/cm2) ([Lindner et al. 1997]; [Karle et al. 1995];
[Krawczynski et al. 1996] ; [Rhode et al. 1996]).
In the present analysis only data of the scintillator array
and part of the AIROBICC array were used.
The former consists of 243 huts with plastic scintillators
of an area of 0.96 m2,
covered with 5 mm of lead on a grid
with 15 m spacing (with a denser part
with 10 m spacing in the centre of the array).
The part of the latter used in this analysis is formed by 49 open
photo-multipliers fitted with Winston cones, restricting the
viewed solid angle to 0.835 sr and
measuring the air Cherenkov light of EAS on a grid
with 30 m spacing.
The gain nonlinearity of all components
in the Cherenkov-light measurement was carefully checked,
both with a LED light source with variable light intensity
and a direct charge source. While the used Cherenkov light
photomultiplier tubes
were found to be linear, the used amplifier showed an antilinearity
(gain rises with input amplitude)
which was corrected in the data analysis.
Above 10 PeV the amplifier begin to show signs of saturation
and therefore no data above 10 PeV are included in the present
analysis.
The trigger conditions used for the data analysed here demand
a signal from at least 14 scintillator or 6 AIROBICC stations
within 150 ns.
This corresponds to an energy threshold for
primary protons and iron nuclei of
25 and 80 TeV respectively.
3 Monte Carlo Simulations
EAS events were simulated using the CORSIKA code in its versions
5.20 with the QGSJET/GHEISHA options ([Knapp & Heck 1993];
[Heck et al 1998])).
This generator is based on the quark-gluon string model (QGS)
with an allowance for semihard processes (JET) ([Kalmykov et al. 1997]).
Complex nuclei were treated with the
“complete fragmentation” ansatz.
The energy cutoff for particles of the electromagnetic cascade
was set to 3 MeV.
Proton, helium, oxygen and iron induced showers were produced
at zenith angles of 0∘,6∘,
12∘ and 18∘
at discrete energies between 300 TeV and 10 PeV
(4400 independent showers of which 1000 are above 1 PeV)
as well as an independent sample with a continuous
energy distribution at zenith angles of 6∘ and 12∘
between 50 TeV and 1 PeV (4330 independent
showers) and following a power law
of E-1 between 2.5 PeV and 6.5 PeV (240 showers).
The events continuously distributed in energy were
spectrally weighted and used in the fits
to infer the chemical composition (section 5.2),
while the samples with discrete energies were employed
to develop the reconstruction methods and to correct
the results obtained with biased estimators of the primary energy
(section 5.1).
Note that the simulation of an EAS induced by a 1 PeV primary proton
including the Cherenkov light production requires about 3 h
CPU time on a 300 MHz Pentium-II PC (during the same time the HEGRA
experiment registers more than 350 showers with energies larger
than 1 PeV).
The detector performance was modelled with two independent detector
simulations:
a full detector simulation ([Martinez et al. 1995]),
and an empirical simulation using measured
response functions ( [Haustein 1996]; [Horns 1997]).
Each independent generated EAS was used 20 times with core positions
inside and outside the HEGRA area to take into account
the detector related fluctuations of observables and
to check the event selection criteria. With the standard cuts described
below, each shower was used on the average two times in the
discrete and once in the continuous MC sample.
Special care has been taken to simulate the
density profile and absorption features of the atmosphere
above La Palma correctly.
Weather balloon measurements as well as comparisons between
TeV photon data registered by the HEGRA system of
imaging air Cherenkov telescopes and simulations were employed
for this purpose ([Bernlöhr 1999];[Konopelko et al. 1999]). The shower development and
light emission were modelled with the U.S. standard atmosphere,
and the light propagation was then simulated with a special
program ELBA ([Haustein 1996]), assuming a tropical maritime atmosphere
for the summer.
This atmosphere is a good approximation for the conditions
at Tenerife,
an island neighbouring the experimental site ([Bernlöhr 1999]).
4 Event Reconstruction and Data Selection
The core position of an EAS is reconstructed independently from the data of the scintillator matrix and from AIROBICC where the latter data allow to tag core positions beyond the HEGRA boundary. If the core position lies inside the area covered with detector elements the scintillator derived core coordinates have a resolution of for protons (iron) at energies above 300 TeV (a little more accurate compared to AIROBICC mainly due to the smaller grid distances of the scintillator huts).

The direction of the primary particle is reconstructed nearly
independently from the scintillator and AIROBICC arrival time
data (where the scintillator derived core position is used here).
The particle density measured by the scintillator array is fitted
by the NKG formula ([Greisen 1956]) with a Moliére radius
of 106 m, yielding the shower size and an
age value.
is a factor 1.6 larger than (the “true”
shower size at detector level, denoting the number of charged particles
above a kinetic energy of 3 MeV) due to
coverage of the detector huts with a lead layer
and the fact that the NKG function
does not correctly parametrise the electromagnetic part of hadronic showers.
The dependence of the Cherenkov photon density , as measured
by AIROBICC, on the distance r from the shower axis can be
well described by an exponential in the region
20 m r 100 m
([Patterson & Hillas 1983]):
| (1) |
The parameter slope (in units of [1/m]) is the most
important one in our analysis methods.
As an illustration Fig.1 shows the lateral
charged-particle and Cherenkov-light distributions for a single shower.
The amplitude calibration of the scintillator array is done
for samples of 50000 events by
comparing the ADC spectra of the individual huts
- which display a single peak essentially corresponding
to the energy deposited by minimum ionising electrons
and muons -
with the result of
MC simulations for identical conditions.
The absolute amount of the air Cherenkov light registered by
AIROBICC was calibrated by comparing the energy inferred
from the
lateral Cherenkov light density in the spectral range from 300 nm to 500 nm
registered at a shower core distance of 90 m
(referred to as in the following)
and the energy derived from and
slope in the interval
(refer to section 5.1 below for energy reconstruction methods).
The absolute Cherenkov-light
calibration thus depends on the CR mass composition,
because we do not apply a primary-mass independent energy reconstruction
here.
We used the low-energy composition at 100 TeV as specified by
Wiebel-Sooth et al.([1998]) (60 light elements, see below
section 5.2 for details) for this calibration.
If a pure proton (iron) composition is assumed
the energy reconstructed from Cherenkov light alone is shifted by
3 (13)% to higher (lower) energies.
To select well-reconstructed events the EAS core positions
and directions as reconstructed with AIROBICC and the scintillator
matrix are demanded to be consistent.
Additional cuts ensure the quality of the directional as well as the
fits to the lateral particle and Cherenkov light density
distributions.
Events with the true shower-core position
within the HEGRA array boundaries for the detector
components used in this analysis (distance to edge of array 10 m)
and a zenith angle below 150
are used for the further analysis.
The efficiency to select EAS events with true core positions in the
regarded 160160 m2 area is about 98% for
primary energies above 300 TeV (independent of the primary mass).
The contamination of the sample with EAS, where the true shower cores
lay beyond the HEGRA boundary but which were erroneously reconstructed
to fulfil the cuts is less than 1% from
our simulations.
Nights with perfect weather conditions are selected by
data of the Carlsberg Meridian Cycle ([Argyle 1997]) and by comparing the
Cherenkov light measurements with data from the scintillators
for samples of 50000 events (accumulated in about one hour with the
used setup and trigger conditions).
The data set solely contains nights without any technical problems
of the used detector stations.
In total it comprises (dead-time corrected) an on-time of
208 h. This corresponds to about 150000 events
after all cuts with an energy above about
100 TeV and a zenith angle below 150.
5 The Analysis Methods
Monte Carlo simulations revealed that the distance between detector and shower maximum (defined as the point in the shower development with the maximal number of charged particles) can be reconstructed independently of the primary mass with the shape parameter slope of the lateral Cherenkov light density distribution:
| (2) |
From this relation the distance to the shower maximum is determined with a resolution (i.e. root mean square (RMS) of a (dmax(true)-dmax(reconstructed) distribution) ranging from 40 g/cm2 at 300 TeV to 20 g/cm2 at 10 PeV (including all detector effects but no systematic error in the mean dmax). The most important technical improvement in the data presented here to previous experiments is that these values are distinctly smaller than the width of natural shower fluctuations of proton induced showers in the atmosphere (see below Table 3). This makes the shape of the penetration-depth distribution a sensitive parameter for the chemical composition (see section 7). Simple geometrical relations permit to infer , the depth of the shower maximum in the atmosphere, from . Relation 2 is only weakly energy dependent ([Lindner 1998a]). This dependence is neglected here.
5.1 Energy Reconstruction
Methods have been developed to reconstruct
the primary CR energy from the scintillator
and AIROBICC data independently of the primary mass with an
accuracy better than 35%
([Lindner 1998a]; [Cortina et al. 1997]; [Cortina et al. 1998a]).
However, these methods lead to a
relatively strong correlation between reconstructed energy
and
(showers with a maximum position that fluctuated to smaller
values compared to the mean , are reconstructed
with higher energies).
In order
to infer the chemical composition, a careful modelation of the response
function between the variables (or ) and slope
on the one hand and energy and composition (or penetration depth)
on the other hand ( e.g. via two-dimensional regularised unfolding)
is then necessary. Such procedures have been employed
in some analyses of HEGRA data ([Wiebel-Sooth 1998]; [Kornmayer 1999]).
Two reasons lead us to
prefer to circumvent the mentioned
problem with the use of two simpler energy estimators here.
One reason is that the methods described below are based on
physically transparent properties of air-showers
inferred from the Monte-Carlo simulations.
Whether these properties really hold, is
tested to some degree using different energy estimators
with different biases and comparing the obtained results.
These consistency checks are an important
advantage over more refined and
complete methods when it is doubtful how well the Monte-Carlo
simulation describes the data.
The other reason is
that the Monte Carlo statistics at the highest energy
is still rather limited and mean shower properties
are inferred with higher certainty than a complete
response matrix.
The mass independent energy reconstruction methods will be
applied to the data in a forthcoming publication
together with a discussion of the influence of different EAS
simulations.
The energy estimators used in this paper and described
below are based on and slope, or . Both
estimators are used under the assumption that all primary
CR are either protons or iron nuclei. These extreme assumptions
lead to a bias which then has to be corrected for.
Using and slope
the energy of the primary cosmic-ray nucleus is reconstructed
in two basic steps here ([Lindner 1998b]; [Cortina et al. 1997]; [Plaga et al. 1995]):
first slope (a measure of the distance to the shower maximum)
is combined with to estimate the number of
particles in the shower maximum which is proportional to the
energy contained in the electromagnetic component of the EAS.
In the second step a specific primary mass is assumed;
with the assumption of primary proton (iron) we denote
the methods as 1 (2).
This allows to calculate the primary energy from the energy
deposited in the electromagnetic component.
The following relation was used in our analysis:
| (3) |
Here were obtained from the discrete Monte Carlo data as 0.965,2.545 (0.890,2.010) for protons (iron). is the shower size at the maximum of shower development and is inferred from as:
| (4) |
with given as (0.57833,-85.146,6181.8,-71054)
for all primary nuclei.
This procedure is valid because the shape of the shower
development is only weakly dependent on the mass of the
CR nucleus A, especially after the shower maximum ([Lindner 1998a]).
Only the fraction of the total energy fed
into the electromagnetic cascade depends on A for
a given energy per nucleus. The comparison of the results assuming
initially proton and iron primaries is a consistency
check for the dependence of shower size at the maximum of
shower development on the energy per nucleon.
Alternatively the energy is reconstructed from the
AIROBICC data alone (method 3 (4) with the assumption
of proton (iron) primaries).
Here it turns out that is a good
estimator of the energy contained in the electromagnetic EAS
cascades.
From simulations the relation
| (5) |
was derived, where the coefficients and are given as 0.958,1.810 (0.840,1.061) for primary protons (iron). slope (the parameter used to estimate the primary mass composition, see next section) is not involved in this energy reconstruction. For ease of reference the four energy-reconstruction methods are summarised in Table 1.
| Method # | parameter used | primaries assumed to be |
|---|---|---|
| 1 | and slope | protons |
| 2 | and slope | iron nuclei |
| 3 | light density | protons |
| 4 | light density | iron nuclei |
The agreement of analyses based on and
is a consistency test for the accurate description
of the longitudinal shower development
by the Monte Carlo simulation.
Naturally (because the fraction of the primary energy deposited in
electromagnetic cascades depends on the energy per nucleon of the
primary particle)
the mean of the calculated energy is only correct for the assumed
particle type (Figure 2).
The biases shown in Figure 2 have to be corrected for,
to derive the real energy spectrum and CR mass composition
from our measurements (see section 5.2, 5.3).

In order to check that our final results do not depend on the
assumed primary-particle mass, we shall always compare the results
based on the four energy reconstruction methods below.
The distribution of the reconstructed energy compared to the
simulated energy is shown for examples in Figure 3.
Note that the energy reconstruction from alone
shows Gaussian distributions while the energy obtained
from and slope exhibits tails to high values
which have to be taken into account properly in the analyses.
Figure 4 shows the relative energy resolution achieved
for different primary particles
and energy reconstruction methods 1 and 3.
If is involved in the energy reconstruction
the energy resolution is limited by the experimental accuracy
of the shower size determination at the detector level.
Due to the smaller of iron compared to proton induced
EAS the accuracy of the energy reconstruction for iron showers is a
little worse than for proton showers.
The energy resolution obtained from
is mainly determined by fluctuations in the shower development
(being larger for proton than iron induced showers) and could not
be decreased much by improving the detector.


In all analyses below we bin the data in six equidistant energy intervals from log [TeV]=2.5 to log [TeV]=4.0 (see e.g. Fig.9). Event samples defined to contain events in a certain reconstructed-energy interval for the four energy-reconstruction methods then contain events with different true primary energies. It should always be kept in mind that these four samples are not independent because they are all based on the same total data sample.

5.2 Chemical Composition
The composition of CR is determined by analysing
the EAS penetration depth () distributions
in intervals of the reconstructed primary
energy.
Information is contained
in the differences of the mean
values for different primaries (protons penetrate about 100 - 130 g/cm2
deeper than iron in the energy range considered here) and also
in the the different fluctuations of the shower maxima
position. Including experimental resolution
we obtained
RMS( and
RMS( at 1 PeV).
The RMS values of the depth distributions of
Monte-Carlo events
slightly decrease with rising energy, an effect
that is partly due to
an improving measurement of slope.
We perform an analysis which uses both of these
parameters in one fitting procedure. As the error
from such an analysis turns out to be already quite
large, we do not perform an analysis based on mean
penetration depth alone. An analysis based mainly
on the fluctuation of penetration depths is discussed in section
7.
The present data are not sensitive enough on the chemical
composition to allow a analysis with several
mass groups; therefore
we restrict ourselves
to a determination of the fraction of light nuclei (protons
and helium) by fitting the expected
to the measured distributions.
To define the MC expectations for light nuclei, the generated
distributions for primary protons and helium nuclei are added
with weights of 40% and 60% (the ratio derived from direct measurements
at energies around 100 TeV (Wiebel-Sooth et al. [1998])).
The distribution of heavier nuclei is constructed analogously by summing
65% oxygen and 35% iron induced EAS.
Variations in this ratio at higher energies are
possible and are an additional potential source for
systematic errors that is not further considered below.
The spectrally weighted Monte-Carlo data
are fitted to
the measured penetration-depth distributions
for each of the four energy-reconstruction methods.
Because spectrally weighted
Monte-Carlo data were available only for
the energy bins log10 = 2.5 - 2.75
and 3.5 - 3.75 the energy bins between 2.5 - 3.25 (3.25 - 4) were fitted
with the former (latter)
distribution. The MC events used in energy intervals other than
the two for which the simulations were done, were
shifted in the mean penetration depth
according to the elongation rate of the various elements.
To avoid any systematic uncertainties related to imperfect
parameterisations of the MC distributions and to take into
account the statistical uncertainty of the simulated event sample
we directly fit the MC generated distributions to the experimental data.
Due to the primary
dependent energy-reconstruction
method the results
for the
“fraction of light nuclei” (abbreviated “(p + )/all” below)
are biased.
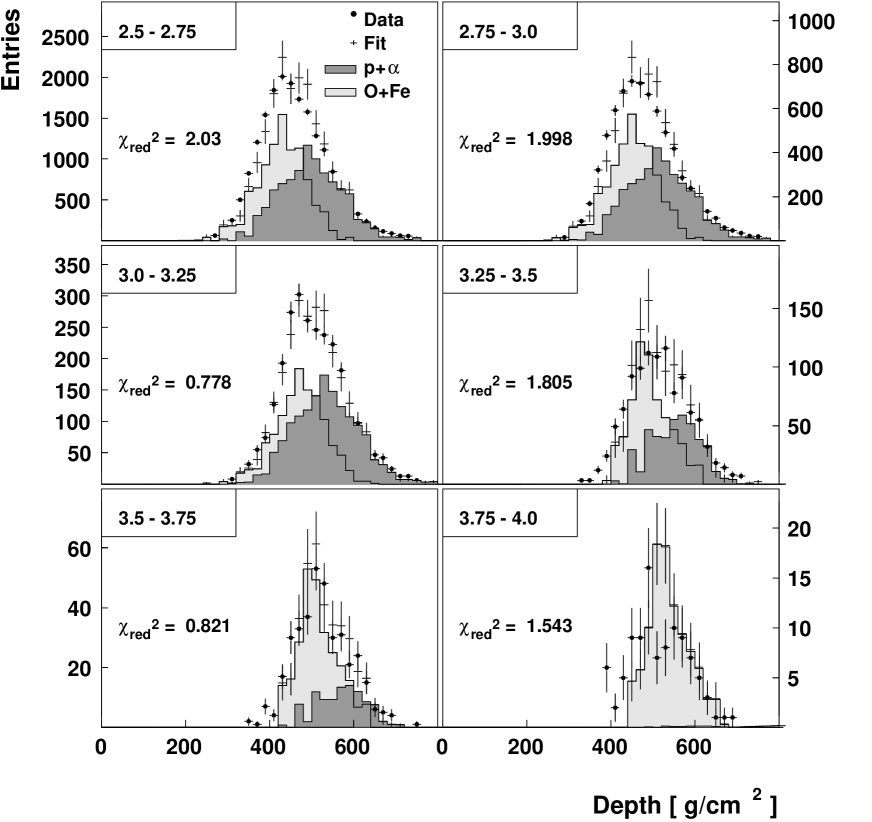
The results for these fits in the chosen energy bins are shown for
method 3 in Fig.9. The obtained (p + )/all
ratios are then corrected for the A dependent bias which
is illustrated in Fig.2.
The correction can be
described as a single overall factor for the (p + )/all
ratio for each energy bin
- rather than a transformation of the penetration depth
distribution -
to a good approximation because of the independence
of our energy reconstruction methods
of as discussed in section 5.1.
These correction factors were derived from spectrally weighted
Monte-Carlo data via determining the true
(p + )/all in the Monte Carlo
that yields the fitted biased (p + )/all in the given
reconstructed-energy bin.
In this way the ratio of biased to
true (p + )/all at the true mean energy
of the Monte-Carlo showers in the energy bin for a given energy
reconstruction method is obtained.
As an illustration the correction factors
for the case of energy reconstruction
method 3 are shown in Table 2.
For the spectral weighing of the Monte-Carlo sampling a primary-spectrum
as obtained from low-energy measurements
(Wiebel-Sooth et al. [1998]) with a power
law index of =2.67 and a “knee”
at 3.4 PeV with a change in the power-law
index to =3.1 was assumed.
An iterative repetition of this procedure with the energy
spectrum as inferred below from the present data is possible.
However,
it was found that the contribution to the systematic error introduced
by not performing the iterations is negligible for the initial
parameters chosen.
Two Monte-Carlo samples were used for bias corrections in
this work,
the Monte-Carlo sample
with events continuously distributed in energy, mentioned
in section 3, and a “toy Monte-Carlo sample”
with unlimited statistics, which was created by randomly choosing
all measured parameters (like reconstructed energy, etc.)
of a shower with a given true primary energy
from one dimensional distributions inferred from the Monte Carlo
sample with discrete energies.
It was checked that the corrections obtained with these samples
are very similar in energy regions where the continuously
distributed Monte-Carlo data were available.
| Reconstructed energy | p + /light | correction factor |
|---|---|---|
| 2.5 - 2.75 | 0.502 | 0.741 |
| 2.75 - 3. | 0.493 | 0.763 |
| 3. - 3.25 | 0.553 | 0.813 |
| 3.25 - 3.5 | 0.406 | 0.800 |
| 3.5 - 3.75 | 0.272 | 0.806 |
| 3.75 - 4. | 0.09 | 0.820 |
5.3 Energy spectra, elongation diagrams and penetration depth fluctuations
Energy spectra obtained with the four
energy-reconstruction methods were corrected
for the A dependent bias by dividing the flux
values in bins with true and reconstructed energy in the
Monte-Carlo samples. The chemical composition as determined with
the methods in the previous section is used.
These factors were
applied to the flux in each energy bin when going from reconstructed
(Fig. 6) to true energy (Fig. 7).
as a function of true energy is
obtained if the mean is plotted
at the mean true energy
of the events in a given reconstructed-energy bin, as
calculated with the measured chemical composition.
This procedure leads to correct results as long
as the elongation rate of different nuclei is
identical; this is fulfilled to a good approximation
for all hadron generators.
The RMS of the shower penetration depth distributions
were directly calculated from the distributions
calculated with a given energy-reconstruction method,
i.e. no procedure to remove the bias was applied.
These results were compared with RMS values
from Monte Carlo data treated in the same way.
5.4 Experimental Statistical and Systematic Uncertainties
For the energy spectrum
the statistical uncertainties correspond to the square root
of the energy-bin contents N for the energy spectrum and the
mean divided by for the penetration depth.
In all other cases
statistical errors were obtained
by changing the fit parameter from its
best-fit value until the increases by 1. In case
of best fit ’s in excess of 1.5 the best fit
value of the fit parameter was increased until doubled.
Systematic uncertainties of the Monte-Carlo
simulation of hadronic air-showers - estimated
by using different hadronic Monte-Carlo generators - will be
considered in a forthcoming paper.
Here we concentrate on experimental uncertainties
related to the slope reconstruction.
These are contributions from remaining uncertainties in the
characteristics of the
AIROBICC amplifier (3% uncertainty for slope) and
non-perfect knowledge of the layer structure and the light absorption
of the atmosphere above the detector (4% and 2%).
Models of the atmosphere have been carefully checked using
the large statistics of photon induced air showers which
were registered with the HEGRA imaging air Cherenkov
telescopes in 1997 ([Konopelko et al. 1999]).
Added in quadrature the systematic uncertainty of slope
amounts to 5%.
The mean for 300 TeV proton (iron)
induced showers is then determined with an uncertainty in the absolute
values of
20 (13) g/cm2.
The uncertainties for different primaries are
strongly correlated.
For the chemical composition, the energy spectrum
and the variation of with energy (elongation rate),
the systematic error was evaluated by changing all slopes
by 5 % (the systematic error of this parameter) up or down.
The whole analysis, including energy reconstruction, was then repeated
and the deviation of the results thus obtained to the
original ones was taken as the systematic error (errors beyond
the tick mark in Figs. 10,11 and shaded bands in
Figs. 7,8).
The shaded band in Fig. 11 is obtained by
varying the best-fit composition within its total systematic and
statistical error.
In the case of the elongation rate the systematic error was found
to be dominated by the differences in the four energy-reconstruction
methods, this is dicussed in detail in the Results section
6.4.
In case of the RMS of the penetration depths, the spectral
fit parameters (knee position, power-law indices)
and the elongation rate, the systematic error
was estimated as the sample standard deviation of the best
fit parameters obtained with the four energy-reconstruction methods.
6 Results
In this section the methods explained in section 5 are applied to the data set discussed in section 4.
6.1 and spectra
Fig. 5 shows the and spectra. These spectra display a relatively sharp knee at values consistent with a primary energy for the knee as determined below.
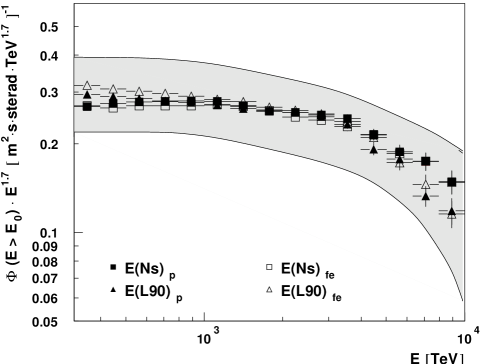
6.2 Energy Spectra
Figure 6 displays the integral energy spectra uncorrected for an A dependent bias obtained with the four reconstruction methods. The differences in absolute normalisation and spectral slope originate from the different mass dependent biases.

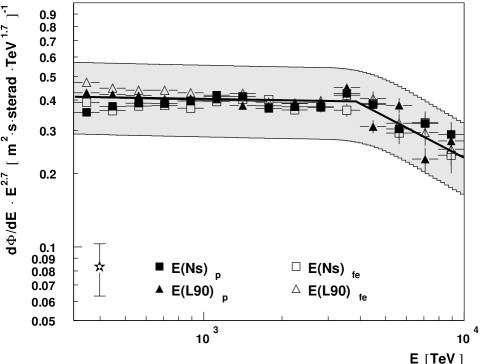
After the correction of the chemical bias the integral spectra are similar (Figure 7). This nontrivial fact is in favour of the internal consistency of data analysed here; a longitudinal shower development different from the one predicted by the Monte Carlo or errors in the calibration of and could have spoiled the agreement of spectra obtained with different energy reconstructions. The differential energy spectrum is shown in Figure 8.
A steepening of the energy spectrum is visible around an energy of 4 PeV. There seems to be no “fine structure” in the energy spectrum around the knee in excess of 20 . Apparent structure with smaller amplitudes that appears in the spectrum reconstructed with a given energy-reconstruction method is not reproduced with other methods. This is expected due to the A dependent bias of our energy-reconstruction methods (see Fig.2). Note that with these methods, a potential structure in the energy spectrum consisting of different nuclei is smeared out. If two different power laws, smoothly connected at the knee (corresponding to a “sharp” knee), are fitted to the differential spectra we obtain:
-
–
a “knee” position of (Knee) = PeV,
-
–
a spectral index of below and above the knee.
The reduced values of the fits to the differential
spectrum (12 d.o.f.) were 6.75, 4.03, 3.53 and 1.47 with energy reconstruction
methods 1 to 4 respectively. Some of these values are much larger than one.
It is then difficult to specify a statistical
error; we specify the statistical errors for method 4 that has
a marginally acceptable reduced value.
The large values for the analysis with
energy-reconstruction methods
1-3 can be interpreted as an argument in favour of a knee
not absolutely sharp in energy.
However, the fact that one of the fits
is acceptable on the 90 confidence level means
that we cannot reject the hypothesis of a “sharp”
knee (two power laws with no transition region) within
our systematic errors.
The large statistical error on the knee position
further indicates that
we cannot reject the hypothesis of a spectrum
without a knee in the limited energy range of this
analysis with high significance.
The spectral index for the spectrum below the knee is consistent
with direct measurements at lower energies
(Wiebel-Sooth et al. [1998])
and a recent Cherenkov-light based determination
of the spectral
index in the TeV range ([Aharonian et al. 1999]); there is therefore
no evidence for any change in spectral index from the TeV range
right up to the knee.
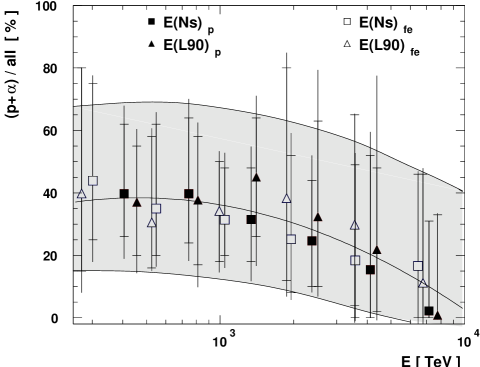
6.3 Composition of CR
The fraction of light nuclei as a function of reconstructed energy - obtained from the fits to the measured penetration-depth distributions (see section 5.2)- is presented in Figure 10. At energies below the knee the composition is mixed and consistent with direct measurements around 100 TeV, namely ()/all = 0.54 0.08 ([Watson 1997]). The data points seem to indicate a gradual enrichment of heavy elements above about 1 PeV though the error bars are large (remember that there are only six independent data points). We will discuss in section 7 how reliable the qualitative conclusion of a gradual enrichment in heavy elements is within our systematic errors. The data rule out a predominantly light composition at all energies and does not give evidence for a drastic change of composition at the knee.
6.4 Elongation rate
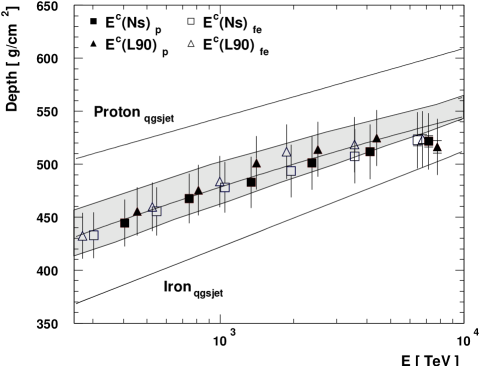
Figure 11 shows the corrected mean shower maximum depth as a function of energy. A least-squares fit to the values as a function of energy, using only the statistical errors,
| (6) |
yields an elongation rate
ER=78.3 1.0 (stat) 6.2 (syst) g/cm2 and mean depth parameter
ERB=243.1 2.6 (stat) 15.7 (syst) g/cm2. The specified
mean values and statistical errors
are the mean of fit values with the four energy-reconstruction
methods. The systematic error is estimated as the
standard deviation of the mean values inferred with the four
energy-reconstruction methods. The systematic error
introduced by the systematic uncertainty in slope
is smaller (about 3 and 14 g/cm2 for ER and ERB respectively).
The reduced values of the fit to relation
(6) (4 d.o.f.)
are very large (6.6,9.2,17.2,23.5) for energy-reconstruction
methods 1-4, i.e the systematic errors dominate over the rather small
statistical errors for the mean . Therefore the
specified estimates of the
statistical errors obtained
with the procedure explained in section 5.4 have to be
treated with caution.
The data point at the highest energy lies
about 20 g/cm2 higher in the atmosphere than expected for a
constant elongation rate.
These results are not in contradiction with previous
measurements in this energy range ([Wdowczyk 1994]; [Turver 1992]).
This elongation rate, and also the absolute
, is consistent with data at
higher energies, obtained mainly by the Yakutsk and Fly’s
Eye collaboration ([Watson 1997]). A constant elongation rate of
73 g/cm2 from 300 TeV up to 107 TeV
(dotted fit line in the summary diagram 10 in ([Watson 1997]))
is an intriguing hypothesis which is
not in contradiction with our data.
6.5 Fluctuation of shower penetration depth
The RMS of the penetration depth distributions - calculated in reconstructed-energy bins, i.e. biased in favour of the light component of CR especially at low energies - is shown in Table 3. It does not show any obvious trend towards a heavy composition. Therefore the fact that the composition at the highest energy seems to be heavy with all energy reconstruction methods (Fig. 10) is mainly determined by the fact that the in the highest energy bin lies about 20 g/cm2 below a constant elongation rate.
7 Further studies of systematic uncertainties; analysis methods independent of absolute
The trend for an enrichment in heavy elements above the knee - which Fig.10 suggest - is not significant within our errors. In this section we elucidate this fact further, and explore what it would take to detect significantly a modest trend for an enrichment in heavy elements - as expected e.g. in a diffusion model of the knee (see Introduction) - with the present techniques.

The agreement between
the distribution shape at low energies - predicted assuming
a composition at low energies which is not very different
from the one obtained by direct experiments - and the
data (see Fig.9) is satisfactory. This is an argument
in favour of a correct MC simulation.
To explore the effect of our systematic
error in slope (section 5.4)
Fig.12 shows the results derived
with an initial assumption of slope
changed by 5 % from its preferred value for
energy-reconstruction method 3 and 4.
It becomes clear that not only the mean but even
the overall apparent
“trend” may change, e.g. for method 3 with slope
increased by 5 % the composition appears to become lighter
from the knee up to the penultimate bin.
It should be stressed that none of the discussed “trends”
is significant within our statistical errors.
The deviation of the penetration depth at the highest
energy point from a constant elongation rate
discussed in subsection 6.5
is of the order of disagreements between different Monte Carlo
codes at this energy([Heck et al 1998]).
Therefore the possibility remains open that
this deviation is due to a change in cascade characteristics
not reliably modelled by the Monte Carlo, rather than to an enrichment in
heavy elements. As it is also quite
similar in size to our systematic error
in slope, an origin in the HEGRA experiment for this
deviation is also difficult to rule out.
Previous conference publications ([Plaga et al. 1995]; [Cortina et al. 1997a]; [Cortina et al. 1998]) are superseded by the present results - differences are mainly due to a more sophisticated amplifier calibration and the simpler energy reconstruction for the present analysis.
| Rec. energy | Data | MC:mixed comp. | MC:p | MC:Fe |
|---|---|---|---|---|
| 2.5 - 2.75 (ca. 0.32 - 0.56 PeV) | 84 0.6 1.8 | 77 2 | 83 4 | 50 3 |
| 2.75 - 3. (ca. 0.56 - 1 PeV) | 80 0.9 1.4 | |||
| 3. - 3.25 (ca. 1 - 1.79 PeV) | 80 2 1.0 | |||
| 3.25 - 3.5 (ca. 1.79 -3.16 PeV) | 73 2 1.1 | |||
| 3.5 - 3.75 (ca. 3.16 - 5.62 PeV) | 67 3 1.5 | 45 5 | 73 17 | 48 11 |
| 3.75 - 4. (ca. 5.62 - 10 PeV) | 67 7 0.9 |
In the last two of these publications, we tried to
lessen the dependence of our composition result on the correct
absolute values by allowing a free “shift parameter”;
the fit to the was then performed with two free
parameters: the ratio of light to all nuclei and an overall
shift in penetration depth of all MC distributions.
In this way the result is mainly determined by the shape
of the distributions (in first order its
width, i.e. RMS value).
This width depends only weakly on a systematic uncertainty
in the determination
of slope, relative to the expected difference of a purely light
or heavy composition.
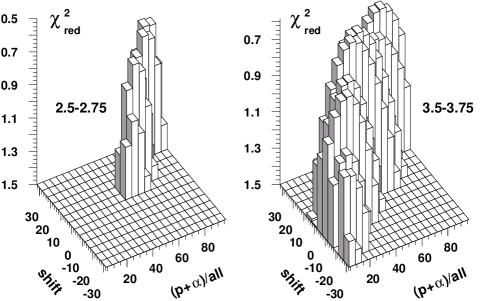
Fig.13 displays the result of such an attempt
in a two dimensional plot showing the reduced for
various “fraction of light nuclei” - “shift parameter”
combinations for the data lowest and highest in energy.
The shift is varied in an interval 30 g/cm2,
estimated from the likely systematic uncertainty of our detector
and the Monte Carlo code.
While in the low energy bin small
(p+)/all ratios lead to unsatisfactory values
for all shift values,
in the highest energy bin - well above the knee - practically
all fractions give acceptable values for appropriate shifts
as seen in Fig.13.
The reason for this behaviour is that
- given the small number of events in the high-energy bin -
the
distribution can be fitted both with the relatively broad
predominantly light composition shifted to larger depths in the atmosphere
and a mixed heavy/ light composition (where the difference in mean
penetration depth of the heavy and light component contributes
to the total width) shifted to small penetration depth.
We have to conclude that it is not reliably
possible to determine the composition based mainly on the
width of the distribution.
We found in numerical experiments that with this
method, and
assuming a Monte-Carlo simulation describing
the experimental data well, together with
a statistics increased by about a factor of 100 (which is difficult
but not impossible to reach in future experiments)
it will just be possible
to reach the desired precision of 10 %
mentioned in the introduction on a 2 level
beyond the knee.
8 Conclusion
The results of this paper demonstrate
that our data seem to be
well described by the QGSJET hadron generator within
the CORSIKA program: The energy spectra derived
with different air-shower observables and assumptions
about the chemical composition of CR
differ only within the estimated systematic errors.
This is an argument in favour of the contention that the “knee”
is a feature in the primary flux of cosmic rays, rather than
some new effect in the interaction of cosmic rays at very high
energies. Such a new effect
would probably lead to inconsistencies
in the data analysed by a generator that does not
take them into account.
Up to the knee
we find a mixed composition and an energy-spectrum power law index
consistent with the results of direct experiments at energies
around 100 TeV.
The data favour a gradual enrichment in heavy elements at energies above the
knee but the systematic errors of our
experiment do not allow to
rule out a constant composition.
An abrupt change of composition or a substantial enrichment in light
elements at the knee is ruled out.
We find an elongation
rate of about 78 g/cm2 and a mean penetration depth
consistent with other experimental
data on CR with energies higher than studied here ([Watson 1997]).
-
Acknowledgements.
We thank the Instituto de Astrofisica de Canarias (IAC) and the ORM observatory for support and excellent working conditions. We are grateful to the authors of CORSIKA and to the KASCADE collaboration for many stimulating discussions.
The experiment HEGRA is supported by the German BMBF and DFG and the Spanish CICYT.
References
- Aharonian et al. 1999 Aharonian F.,Akhperjanian A.G.,Barrio J.A.,et al.(HEGRA coll.),1999, Phys.Rev. D59,092003
- Allen et al. 1997 Allen G.E.,Keohane J.W.,Gotthelf E.V.,et al.,1997, ApJ 487,L97
- Amenomori et al. 1996 Amenomori M.,Cao Z.,Dai B.Z.,et al.(TIBET AS coll.), ApJ,1996, 461,408
- Argyle 1997 Argyle B.,1997,CAMC, Royal Green. Obs., priv. comm.
- Bernlöhr 1999 Bernlöhr K.,1999,astro-ph/9908093, Astropart. Phys. in press
- Bird et al. 1993 Bird D.J.,Corbató S.C.,Dai H.Y.,et al. (FLY’S EYE coll.),1993, In:D.H.Leahy(ed.) Proc. 23th ICRC Calgary, vol.2,p.38
- Biermann et al. 1995 Biermann P.L.,Gaisser T.K.,Stanev T.,1995, Phys.Rev.D51,3450
- Boothby et al. 1997 Boothby K.,Chantell M.,Green K.D.,et al.(DICE coll.),1997, ApJ 491,L35
- Buckley et al. 1998 Buckley J.H.,Akerlof C.W.,Carter-Lewis D.A.,et al.(WHIPPLE coll.),1998, A&A 329,639
- Bykov et al. 1997 Bykov A.M.,Toptygin I.N.,1997, In:M.S.Potgieter et al.(eds.) 25th ICRC Durban 1997 Proc. vol.4,p.365.
- Cassiday et al. 1990 Cassiday G.L.,Cooper R.,Corbató,et al. (FLY’S EYE coll.),1990, In: R.J.Protheroe (ed.) Proc. 21st ICRC Adelaide),vol.3,p.154
- Cortina et al. 1997 Cortina J.,Arqueros F.,Lorenz E.,1997, J.Phys.G 23,1733
- Cortina et al. 1997a Cortina J.,Horns D.,Kornmayer H.,et al. (HEGRA coll.),1997a, In:M.S.Potgieter et al.(eds.) 25th ICRC Durban 1997 Proc. vol.4,p.69.
- Cortina et al. 1998 Cortina J.,Horns D.,Kornmayer H.,et al. (HEGRA coll.) ,1998, In:J.Medina,(ed.) Proc 16th ECRS Alcala de Henares 1998,p.531
- Cortina et al. 1998a Cortina J., 1998a, PhD thesis, University of Madrid
- Dyakonov et al. 1993 Dyakonov M.N.,Ivanov A.A.,Knurenko S.P.,et al.,1993, In:D.H.Leahy (ed.), Proc. 23th ICRC vol.4 p.303
- Gaisser 1997 Gaisser T.K.,1997, Nucl.Phys.B (Proc. Suppl.) 52B,10
- Greisen 1956 Greisen K.,1956, Prog. Cosmic Ray Physics 3,1
- Haustein 1996 Haustein V.,1996 , PhD Thesis, University of Hamburg
- Heck et al 1998 Heck D.,Knapp J.,Capdevielle J.N., Schatz G.,Thouw T.,1998, FZKA report 6019
- Heß 1997 Heß M., 1997, In: In:M.S. Potgieter et al.(eds.) Proc. 25th ICRC,Durban vol.3,p.229
- Hillas 1997 Hillas A.M.,1997, Nucl.Phys.B (Proc. Suppl.) 52B,29
- Horns 1997 Horns D., 1997, Diploma Thesis, HH-HEGRA/97-02, University of Hamburg
- Jokipii & Morfill 1987 Jokipii J.R.,Morfill G.,1987, ApJ 313,842
- Kalmykov et al. 1997 Kalmykov N.N.,Ostapchenko S.S.,Pavlov A.I.,1997, Nucl. Phys. B (Proc.Suppl.) 52B,17
- Karle et al. 1995 Karle A.,Merck M.,Plaga R.,et al.,1995, Astropart.Phys. 3,321
- Knapp & Heck 1993 Knapp J.,Heck D.,1993, KFK report 5196B
- Knapp et al. 1996 Knapp J.,Heck D.,Schatz G.,1996, FZKA report 5828
- Konopelko et al. 1999 Konopelko A.,Hemberger M.,Aharonian F.,et al. (HEGRA coll.),1999, Astropart.Phys. 10,275
- Kornmayer 1999 Kornmayer H.,1999, PhD thesis, University of Munich.
- Koyama et al. 1995 Koyama K.,Petre R.,Gotthelf E.,et al.,1995, Nat 378,255
- Koyama et al. 1997 Koyama K.,Kinugasa, K.,Matsuzaki, K.,et al.,1997 PASJ 49,7
- Krawczynski et al. 1996 Krawczynski H.,Prahl J.,Arqueros, F.,et al.(HEGRA coll.),1996, Nucl.Inst.Meth A 383,431
- Lindner et al. 1997 Lindner A.,1997, In:M.S.Potgieter et al.(eds.) Proc. 25th ICRC, Durban, vol.5,p.113
- Lindner 1998a Lindner, A.,1998a, Astropart.Phys.8,235
- Lindner 1998b Lindner A., 1998b, HEGRA coll. internal note “On the Energy Spectrum and Composition: a new Analysis assuming primary Protons”.
- Martinez et al. 1995 Martinez S.,Arqueros F.,Fonseca V.,1995, Nucl.Inst.Meth. A 357,567
- Paling et al. 1997 Paling S.,Hillas A.M.,Berley D.,et al. (CACTI coll.),1997, In:M.S.Potgieter et al.(eds.), Proc. 25th ICRC, Durban, vol.5,p.253
- Patterson & Hillas 1983 Patterson J.R., Hillas A.M. J.,1983, Phys.G 9,1433
- Peters 1961 Peters B.,1961, Nuovo Cim. 22,800
- Plaga et al. 1995 Plaga R.,Karle A.,Arqueros F.,et al.(HEGRA coll.),1995, In: N.Iucci(ed) 24th ICRC Rome 1995 Proc. vol.2,p.693
- Prosch et al. 1996 Prosch C.,Feigl E.,Plaga R.,et al.(HEGRA coll.),1996, A&A 314, 275
- 1992 Protheroe,R.,Szabo, A.P.,1992, Phys.Rev.Letters. 69, 2885
- Ptuskin et al. 1993 Ptuskin V.S.,Rogovaya S.I.,Zirakashvili V. N.,et al.,1993, A&A 268,726
- Rhode et al. 1996 Rhode W.,Becker K.H.,Daum K.,et al.,1996, Nucl.Inst.Meth. A378,399
- 1993 Stanev T., Biermann P.L., Gaisser T.K.,1993, A&A 274,902
- Tanimori et al. 1998 Tanimori T.,Hayami Y.,Kamei S.,et al.,1998, ApJ 497,L25
- Turver 1992 Turver K.E.,1992, Nucl.Phys.B (Proc. Suppl.) 28B,16
- Völk 1997 Völk H.J., 1997,In: O.C.de Jager (ed.), Proc. Krüger Park Work. on TeV Gamma Ray Astrophysics, p.87, astro-ph/9711204.
- Watson 1997 Watson A.A.,1997, In:M.S.Potgieter et al.(eds.) Proc. 25th ICRC (Durban), Invited and Rapp. Talks, vol.8,p.257
- Wdowczyk 1994 Wdowczyk J.,1994, Phys. G 20,1001
- 1998 Wiebel-Sooth B.,Biermann P.L.,Meyer H., 1998, A&A 330,389
- Wiebel-Sooth 1998 Wiebel-Sooth B.,1998, PhD thesis University of Wuppertal, WUB-DIS 98-9