(driebe@speckle.mpifr-bonn.mpg.de; bloecker@speckle.mpifr-bonn.mpg.de) 22institutetext: Astrophysikalisches Institut Potsdam, An der Sternwarte 16, D-14482 Potsdam, Germany
(deschoenberner@aip.de) 33institutetext: Universität Potsdam, Institut für Physik, Astrophysik, Am Neuen Palais 10, D-14469 Potsdam, Germany
(fherwig@astro.physik.uni-potsdam.de)
The evolution of helium white dwarfs
Abstract
We calculated a grid of evolutionary models for white dwarfs with helium cores (He-WDs) and investigated the occurrence of hydrogen-shell flashes due to unstable hydrogen burning via CNO cycling. Our calculations show that such thermal instabilities are restricted to a certain mass range (), consistent with earlier studies. Models within this mass range undergo the more hydrogen shell flashes the less massive they are. This is caused by the strong dependence of the envelope mass on the white dwarf core mass. The maximum luminosities from hydrogen burning during the flashes are of the order of . Because of the development of a pulse-driven convection zone whose upper boundary temporarily reaches the surface layers, the envelope’s hydrogen content decreases by per flash.
Our study further shows that an additional high mass-loss episode during a flash-driven Roche lobe overflow to the white dwarf’s companion does not affect the final cooling behaviour of the models. Independent of hydrogen shell flashes the evolution along the final white dwarf cooling branch is determined by hydrogen burning via pp-reactions down to effective temperatures as low as K.
Key Words.:
Stars: evolution – Stars: interiors – white dwarfs – Binaries: general –1 Introduction
In Driebe et al. (1998) (hereafter referred to as Paper I) we presented a grid of evolutionary tracks for low-mass white dwarfs with helium cores (He-WDs) in the mass range from to . The lower masses allow applications to companions of millisecond pulsars. As an example we derived a cooling age for the He-WD companion of the millisecond pulsar PSR J1012+5307 of Gyr, which is in good agreement with the pulsar’s spin-down age of Gyr. The evolutionary tracks are based on a model sequence extending from the pre-main sequence stage through the red-giant branch (RGB) domain. We forced the models to move off the giant branch and to evolve into the white dwarf regime by applying large mass-loss rates at appropriate positions to take into account the binary nature of He-WDs (for details see Paper I).
As pointed out in Paper I one of the major results of our study was the dominant contribution of hydrogen burning to the luminosity budget of the He-WDs. Therefore the final cooling evolution is slowed down, and the derived cooling ages are notably larger than those found in models which do not consider nuclear burning or do not find hydrogen burning to be important due to much lower envelope masses.
In the present paper we will discuss the evolution of sequences which undergo hydrogen shell flashes in detail. It is organized as follows: In Sect. 2.1 we will briefly summarize the main reasons for unstable nuclear burning, and report in Sect. 2.2 on former studies concerning instabilities in He-WDs. In Sect. 3 we describe the evolutionary code used for our calculations. The main results of the calculations are discussed in Sects. 4.1 to 4.4. Finally, conclusions are given in Sect. 5.
2 Unstable nuclear burning
2.1 The two general cases
There are two reasons for nuclear burning to become unstable: The first one is the decoupling of the thermal and mechanical structure of a star due to large electron degeneracy. If the equation of state gets more and more independent of the temperature a local increase in energy production cannot be stabilized by a local expansion with following cooling of the affected layers. Therefore a further increase in energy production will lead to a corresponding increase in temperature which in turn will again raise the energy release. This phase of thermally unstable burning will continue until the ongoing temperature increase results in an effective lifting of degeneracy in the burning zone. The stronger coupling of thermal and mechanical structure will then allow for an expansion and the transition to a phase of stable nuclear burning. This kind of instability is found, for instance, during the onset of central helium burning in low-mass stars ( for ) on the tip of the red giant branch (central helium flash).
The second reason for thermally unstable nuclear burning is mostly based on the geometry of the burning region and occurs only during shell burning. If the shell’s mass (its ”thickness“) becomes too small compared to its radial extent, the expansion following a local increase in temperature and energy production is insufficient to cool the shell: The thin burning zone will instead be heated by expansion, and the energy production is further increased. The thermal runaway only stops when the thickness of the shell is large enough as to allow for a cooling expansion. This kind of unstable burning repeatedly takes place during the double shell-burning phase of AGB stars (Schwarzschild & Härm 1965, Weigert 1966). There, these instabilities are known as thermal pulses or helium shell flashes caused by thermally unstable helium burning.
Schwarzschild & Härm (1965) derived an instability criterion for non-degenerate matter by linear perturbation analysis. This criterion includes the shell thickness as well as the temperature exponent of the energy generation rate ( ) as a measure of the temperature dependence of nuclear burning. The assumption of non-degeneracy is justified for the helium layers of AGB models during most of the thermal pulse evolution. According to the Schwarzschild & Härm criterion unstable burning is favored when the shell becomes thinner and the burning is quite temperature sensitive, as it is the case for helium burning. A similar criterion for the study of thermal pulses was derived by Sackmann (1977). In a recent study Frost et al. (1998) report that in advanced stages of thermal pulse evolution degeneracy in the region of the helium burning shell may become noticeable and can therefore lead to significantly stronger pulses (degenerate pulses). Kippenhahn & Weigert (1990) give an instability criterion which also takes degeneracy into account.
2.2 Unstable burning in helium white dwarfs
Unlike as in AGB stars, where the helium burning shell becomes thermally unstable, He-WDs show instabilities related to CNO cycling which dominates hydrogen burning in the lower, i.e. hotter part of the geometrically thin shell.
Kippenhahn et al. (1967) calculated a He-WD model with which evolves through a phase of unstable burning. As a result the track in the Hertzsprung-Russell diagram (HRD) is reversed and the He-WD returns to the RGB domain. The evolution of the white dwarf during the thermal instability was followed in more detail by Kippenhahn et al. (1968). Giannone et al. (1970) found unstable burning in a He-WD model, whereas their models with and did not show any sign of thermal instabilities. Unlike the previously mentioned studies, Webbink (1975) found only small hook-like excursions in his He-WD tracks close to the point of maximum effective temperature.
Iben & Tutukov (1986) calculated a He-WD model based on a model which suffered from high mass loss episodes on the RGB, mimicking Roche-lobe overflow to a companion. They found two strong thermal instabilities to occur on the cooling branch resulting in a track similar to the one of Kippenhahn et al. (1968).
Castellani et al. (1994) calculated a grid of He-WD model sequences for different metallicities using the same technique as Iben & Tutukov (1986). Like Giannone et al. (1970) they found thermal instabilities only below a certain mass limit wich depends on : For and 0.001 no flashes were found for and , respectively. For one hydrogen shell flash was found for and . In a recent study Sarna et al. (1998) found instabilities in their cooling tracks for , quite similar to those of Webbink (1975) who, however, used rather large time steps.
Due to large time steps and/or significantly smaller envelope masses several studies did not find thermal instabilities at all during the cooling of He-WDs, as e. g. Chin & Stothers (1971), Alberts et al. (1996), Althaus & Benvenuto (1997), Benvenuto & Althaus (1998) and Hansen & Phinney (1998).
3 The evolutionary calculations
Besides some minor modifications we used the evolutionary code described by Blöcker (Ba (1995)). Nuclear burning is accounted for via a nucleosynthesis network including 30 isotopes with all important reactions up to carbon burning similar as in El Eid (El (1994)). The most recent radiative opacities by Iglesias et al. (IRW (1992)) and Iglesias & Rogers (IR (1996)), supplemented by those of Alexander & Ferguson (AF (1994)) in the low-temperature region, are employed. Diffusion is not considered. The initial composition is , the mixing length parameter followed from calibrating a solar model. The Coulomb corrections to the equation of state are those given by Slattery et al. (SDW (1982)).
He-WDs are known to be components in binary systems where early case B mass transfer (Kippenhahn & Weigert 1967) must have taken place during RGB evolution which forces the stars to leave the RGB before the onset of helium burning and to evolve into the white dwarf regime. We did not calculate the mass exchange phases during the RGB evolution in detail because we are primarily interested in the cooling properties of the white dwarf models themselves rather than in the generation of these models by binary star evolution. Hence we used an approximate approach to get the pre-white dwarf models (see also Iben & Tutukov 1986, Castellani et al. 1994, and Paper I):

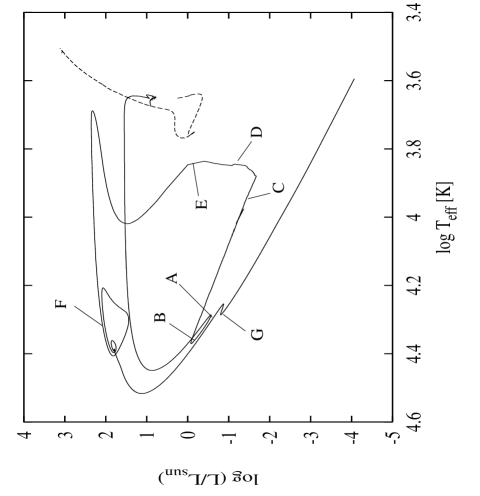
We calculated a 1 sequence from the pre-main sequence phase up to the tip of the RGB. Along the RGB we applied mass-loss rates according to Reimers (R (1975)) with . At appropriate positions high mass loss rates, , were invoked in order to get models of desired final mass, : 0.179, 0.195, 0.234, 0.259, 0.300, 0.331 and . Figure 1 displays all He-WD sequences in the HRD. High mass loss varied from for to about for . These values were chosen to allow the models to hold thermal equilibrium during their further evolution (with ). For a more detailed description we refer to Paper I. Here, we only want to stress the importance of sufficiently small time steps when the evolution through thermal instabilities should be followed properly. A brief discussion on this topic is given in the Appendix.
4 Results
4.1 General remarks
We briefly repeat the main results of our calculations which have been addressed in detail in Paper I. Due to the comparatively large remaining envelope masses after termination of the RGB evolution
| 0.179 | 0.1693 | 5.061 | 10.211 | 0.464 |
| 0.195 | 0.1859 | 4.937 | 9.598 | 0.461 |
| 0.234 | 0.2220 | 8.118 | 13.098 | 0.354 |
| 0.259 | 0.2524 | 4.771 | 7.232 | 0.312 |
| 0.300 | 0.2960 | 3.189 | 4.746 | 0.301 |
| 0.331 | 0.3281 | 2.509 | 3.744 | 0.301 |
| 0.414 | 0.4116 | 1.446 | 2.175 | 0.301 |
(see Table 1111We note that the same table is shown in Paper I but the data for and did not refer to as indicated in the caption but erroneously to as for the larger masses. ) one of the main characteristics of our white dwarf models is that hydrogen burning due to pp-reactions remains the main energy source down to effective temperatures well below (see Paper I and Fig. 2). This residual burning leads to a significant slow-down of the further evolution, resulting in larger cooling ages (typically a few , see Fig. 3) than found for He-WD models where hydrogen burning is negligible due to smaller, ad-hoc assumed 222In these calculations the envelope mass is taken as a free parameter and has not been computed from the mass-loss history of the He-WD progenitor according to the binary nature of He-WDs. envelope masses, or even not considered at all. The implications of evolutionary envelope masses for the evolution of white dwarfs are discussed in Blöcker et al. (1997).


Besides of this important property of He-WDs and its consequence for age determinations of, e.g., millisecond pulsar systems as PSR J1012+5307 (cf. Paper I), another result of our study concerns the occurrence of hydrogen shell flashes: We did not find any unstable hydrogen-burning in the sequences with masses and . Only for and major hydrogen shell flashes () developed with concomitant extended loops in the HRD. Only a temporal slight increase of the CNO-luminosity on the cooling branch was found in the sequences with and .
The restricted mass range for the occurrence of hydrogen flashes agrees with earlier results, e.g. Kippenhahn et al. (1968), Gianonne et al. (1970) or Castellani et al. (1994). We note that Webbink (1975) suggested a lower mass limit of , in good agreement to our findings. The model of Iben & Tututkov (1986) is fully unstable, our model only marginally. The calculations of Castellani et al. (1994) suggest that the upper boundary for the flash range is higher for lower metallicity. Therefore, their result of for is consistent with our calculations. Complementary calculations where equilibrium rates for the pp-chains and the CNO-cycle were used instead of the nuclear network show three hydrogen shell flashes for and one strong hydrogen shell flash for . Because we found no hydrogen flashes in our standard sequences with and we conclude that the mass range for the occurrence of instabilities depends on uncertainties due to different input physics (e.g. diffusion as in Iben & Tutukov (1986)), and that the boundaries and may be uncertain by about .
According to our calculations the number of hydrogen flashes depends on the mass: We found one major hydrogen flash for , two flashes for and three flashes for . Thus, we conclude that unstable hydrogen burning in He-WDs caused by the fading CNO cycling (see next section) is restricted to a certain mass range of . Furthermore, the number of flashes increases with decreasing white dwarf mass.
It is noteworthy that the cooling properties below are independent on the occurrence of hydrogen shell flashes during the previous evolution. Hydrogen burning remains the main energy source along the cooling branch down to very low effective temperatures (see Sect. 4.3). Because He-WDs suffering from hydrogen flashes evolve back to the RGB regime one has to account for high mass-loss episodes due to Roche lobe overflow although the time spent away from the cooling branch is small compared to the cooling time itself. Our calculations show that the cooling is not affected by such high mass-loss episodes (see Sect. 4.4).
4.2 The main flashes

While the evolution of the model is characterized by only one major flash resulting in an extended loop in the HRD (see Fig. 5), the model with experiences two strong flashes (see Fig. 4).
| Model | |||
|---|---|---|---|
| A | 1.469119 | 4.2865 | -0.5726 |
| B | 2.803540 | 4.3678 | -0.0754 |
| C | 2.803641 | 3.9532 | -1.4070 |
| D | 2.803643 | 3.8488 | -1.0786 |
| E | 2.803658 | 3.8413 | -0.2007 |
| F | 2.803744 | 4.3272 | 2.0633 |
| G | 13.003598 | 4.2859 | -0.8025 |
After mass loss terminates the RGB evolution, the remnants evolve at almost constant surface luminosity to higher effective temperatures towards the white dwarf cooling branch. In this phase the total luminosity is almost entirely supplied by nuclear burning due to CNO cycling (). The contribution due to contraction is negligible. The situation changes when the star reaches the cooling branch. Now, the temperature within the hydrogen burning shell becomes too low to support further CNO cycling. drops significantly, and contraction sets in until pp-burning takes over the main nuclear energy production. Still holds in this early cooling period (see e.g. Fig. 11 and Fig. 5 in Paper I). The phase of unstable burning starts at typical effective temperatures of on the cooling branch (close to point A in Fig. 5). At this stage of evolution the energy production due to CNO cycling rises again and finally exceeds the pp-contribution by large amounts. In Fig. 5 this part roughly coincides with the loop between point A and B in the HRD. The duration for this period of evolution () depends on the remaining envelope mass and the thermal timescale of the burning shell, and ranges from for to for . For example, the model with gives , that with only . At the onset of the second flash for one gets due to the further reduced envelope mass.
The increasing energy release during the flash development causes a steep temperature gradient in the vicinity of maximum energy production and the formation of a pulse-driven convection zone well inside the hydrogen burning shell (beyond point B). The situation is displayed in Fig. 6:
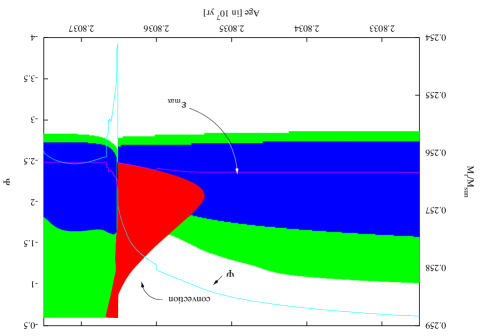
At the convective shell establishes right above the locus of maximum energy production due to hydrogen burning. The degeneracy inside the burning shell is quite moderate as can be seen from the degeneracy parameter at maximum energy generation (for the defintion of see e.g. Kippenhahn & Weigert 1990). During the onset of the unstable burning, .
Once the convection zone is fully established, the evolution is rapidly accelerated (roughly between point B and D). The typical time scale is now of the order of a few decades. The luminosity contribution due to nuclear burning increases several orders of magnitude and the convection zone grows until it extends to the stellar surface (see Fig. 6, ). Although increases to about in this phase (near point C in Fig. 5), the surface luminosity drops by almost 2 orders of magnitude because the increased energy production is largely overcompensated by the energy loss due to the expansion of the envelope. This expansion roughly doubles the stellar radius and leads to a complete lifting of degeneracy in the shell (sharp drop of ). For instance, model B has , and beyond point C one finds .
The maximum hydrogen luminosity reached during the flash is supplied by pp-burning, although the onset of the instability is triggered by CNO cycling (see below, Fig. 7). For , . For both flashes are of comparable strength with for the first and for the second flash. The time span between both flashes amounts to (see also Fig. 7).
Beyond point C the most luminous part of the flash instability has passed and decreases while increases. The surface luminosity is again enhanced due to the increase of . At point D (, see Fig. 5) the upper boundary of the pulse-driven convection zone reaches the surface (at in Fig. 6). Due to the convective transport of hydrogen from the surface layers down to the hydrogen burning region the surface hydrogen abundance is reduced by about when surface convection establishes. The small blueward evolution in the evolutionary track close to point D is related to these composition changes in the envelope (see Iben & Tutukov 1986). The compositional change is consistent with the results of the flash model of Kippenhahn et al. (1968) who found . Iben & Tutukov (1986) found a larger amount of , probably due to their consideration of gravitational and chemical diffusion leading to different chemical profiles.
Between point D and E in Fig. 5 the lower boundary of the pulse-driven convection moves upwards, and at point E the convection zone (and therefore surface convection) vanishes at all. Overall, the convection zone exists for , and for yrs it extends up to the surface. Beyond point E the contraction of the inner regions of the hydrogen shell resumes, while the surface layers react by expansion, resulting in a redward motion in the HRD bringing the He-WD almost back to the RGB region. Finally, contraction seizes the surface layers and the star evolves back to higher effective temperatures towards the cooling branch again.
Around point F just before re-entering the cooling branch, the so-called subflashes develop. Here, contraction initiates another small increase of to (compared to during the major flash) leading to a temporary expansion of the outer layers of the star and only minor circle-like excursions in the HRD.
For illustration, Fig. 8 shows the evolution (arbitrary zero point) of the luminosity contribution due to hydrogen burning, , and the gravothermal luminosity, , during the flash phase of the sequence. The large plot shows the evolution of the first subflash episode of the first hydrogen flash phase and the small inlet that of the second phase. The peak at which is not resolved within the plot range comes from the major flash, the second peak at with followed by a short period with , i.e. expansion, marks the subflash. This first subflash is then followed by another slight increase in at with causing the little circle in the track at (see Fig. 4).


After the second major flash (again unresolved in the time range of this diagram at ) a local maximum in with and slight expansion is found at (i.e. about after the main flash) corresponding to the small loop in the evolutionary track at .
As previously mentioned the instability in He-WDs is caused by the fading CNO-luminosity on the cooling branch around . After pp-burning became the dominant contribution of hydrogen burning, again increases on a typical timescale of a few to yr. Figure 7 shows the situation for the two hydrogen flashes occurring for . Beyond and , rises again from to a few . With ongoing unstable burning the outer layers of the He-WD expand and slightly cool the shell so that drops again. The peaks in () are due to pp-burning.
To investigate the dependence of the mass on the occurrence of hydrogen flashes we applied the criteria for unstable burning discussed in Sect. 2.1. As already seen in Fig. 6 the degeneracy in the hydrogen shell is quite moderate but far from being negligible. We used the criterion of Kippenhahn & Weigert (1990) to account for the possible effect of degeneracy. The criterion states that nuclear burning in a shell at radius and of thickness becomes unstable if
| (1) |
is the adiabatic temperature gradient and and are given by and . For comparison, we also used the criterion of Schwarzschild & Härm (1965) which predicts unstable burning if
| (2) |
with and being the temperature difference between lower und upper shell boundary. A main problem when dealing with these criteria is the definition of quantities as, for example, representative temperatures and pressures in the shell or the typical radial extent of the shell.

However, although we find the instability criterions to be fulfilled in several models the strict application of the aforementioned criteria alone cannot explain the restricted mass range for the occurrence of hydrogen flashes. Some general aspects on the model properties important for the study of unstable burning can be seen from Fig. 9 where different quantities of layers at maximum energy generation are shown along the cooling branch evolution for the non-flash sequences with and and the flash sequence with covering most of the He-WD mass range.
As seen before for , degeneracy of the shell layers is moderate (lower left panel) in the upper part of the cooling branch evolution. For at the beginning of unstable burning (). For degeneracy is slightly lower (, ) at the corresponding evolutionary stage, and for slightly higher (, ). For an ideal, non-relativistic gas one obtains for the non-degenerate limiting case , whereas strong degeneracy leads to and with and being the mean molecular weights per ion and electron, resp., (see Kippenhahn & Weigert 1990) 333 Note that radiation pressure is negligible and does not depend on in the non-relativistic regime.. Thus, inspecting Eq. (1), from alone we would conclude that, if at all, degeneracy favours hydrogen shell flashes for lower He-WD masses.
The temperature sensitivity of nuclear burning along the cooling branch can be seen from the quantity which is shown in the lower right panel of Fig. 9. When the flash develops for , one finds . For the other masses we have () and (). Because unstable nuclear burning is favoured for higher temperature sensitivity of the burning (see Eq. (2)) the occurrence of flashes is favoured for heavier white dwarfs. Thus, combining the effects of degeneracy and large temperature exponents in the energy generation rate might, in principle, explain why high and low-mass He-WDs do not suffer from hydrogen flashes.
However, it is most likely the radial thickness of the shell (see upper right panel in Fig. 9) which has the most important effect on the occurrence of hydrogen flashes. At the onset of unstable burning we found for (the shell’s borders are taken at the point with ). For , is approximately a factor of two larger and for a factor of two smaller. For low-mass He-WDs degeneracy of the shell is of minor importance. Also, the thickness of the shell is too large as to allow hydrogen shell flashes. On the other hand, for high-mass He-WDs the shell is so thin that the thermal cooling time is smaller than the typical time scale for the onset of the instability. Hence, for He-WDs with an instability might be initiated but the fast cooling of the shell prevents a hydrogen flash (see also next section).
4.3 Final cooling
After the He-WD models with and have completed their major hydrogen flashes a final onset of a flash results in a local hook in the cooling track (see Figs. 4 and 5, point G). Again this increase of luminosity due to hydrogen burning is caused by CNO cycling. This can be seen from Figs. 10 and 11 where the evolution of different luminosity contributions for the two flash sequences are plotted as a function of for the whole post-RGB evolution.


shows a local maximum at for , approximately after the last major flash. The corresponding point for is at an age of , which is about after the major flash. At this point of evolution hydrogen shell burning is already dominated by pp-burning (), but the difference between both contributions is rather small compared to the later evolution (see Figs. 10 and 11 for Gyr). Because the characteristic cooling time is now smaller than the typical timescale for the onset of unstable burning another strong hydrogen flash is prevented. Such onsets of unstable CNO-burning have also been found in the sequences with and , resulting in similar hooks on the cooling track (see Fig. 1 in Paper I).
The further evolution in both flash sequences is comparable to the one without hydrogen flashes (see for instance Fig. 4 in Paper I). It is characterized by quiescent hydrogen shell burning via the pp-chains until an age of about 10 Gyr. Then hydrogen burning terminates and contraction determines the surface luminosity evolution and final cooling (see Figs. 10 and 11).
Finally, we like to note that the mass-radius-relation of He-WDs is only affected by hydrogen shell flashes for : The high burning rates associated with the flashes lead to a higher envelope consumption compared to sequences without flashes, resulting in slightly smaller radii and enhanced evolutionary speeds on the upper part of the cooling branch. Besides, since the timescale of the instabilities is short compared to the characteristic cooling time (a few compared to Gyr) and most of the time during a flash is spent close to the cooling branch, the influence of hydrogen shell flashes on the mass-radius-relation is restricted to the onset phase where the changes in radius are moderate.
4.4 Roche lobe overflow during the flashes
During the hydrogen shell flashes the expansion of the outermost layers (from a few 0.01 solar radii to a few solar radii) forces the He-WDs to evolve back into the RGB domain in the HRD (see Figs. 4 and 5). Due to the binary nature of He-WDs, in principle, mass transfer to a companion (in most cases another white dwarf or a pulsar) should be taken into account in this particular evolutionary phase. This has been considered, for instance, in the calculations of Iben & Tutukov (1986) leading to a significant removal of envelope matter and a faster exhaustion of hydrogen burning.
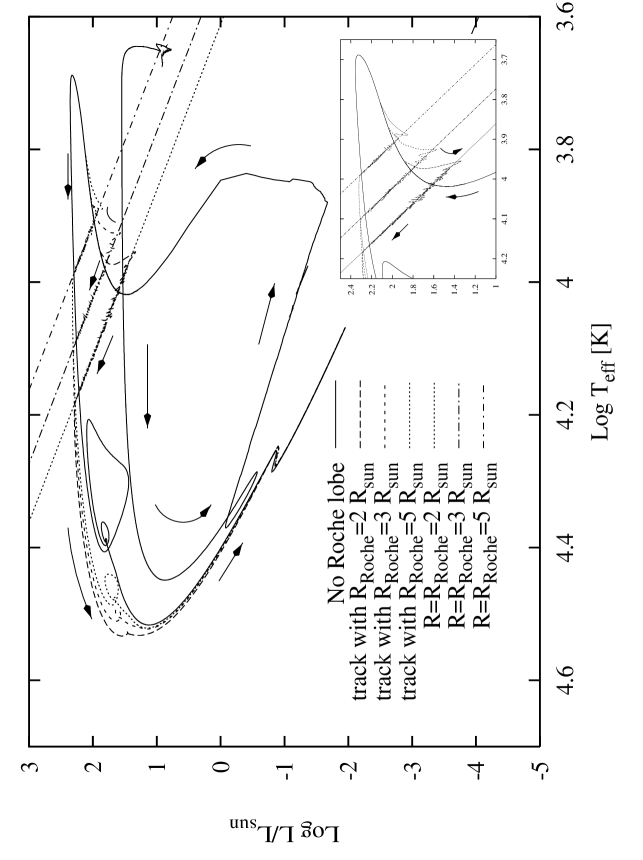
Besides the sequences already discussed we thus also investigated the evolution of the flash model sequence with considering high mass-loss episodes due to Roche lobe overflow. Because we were only interested in the general influence on the final cooling properties of our models we used a rather simple algorithm to account for Roche lobe overflow from the He-WD to a companion: For a given Roche radius (in our case 2, 3 and 5 ) and actual model radius , we increased in the Reimers mass loss formula by a factor of for . Otherwise, was set to its standard value of 0.5 used for all post-RGB calculations.
Figure 12 presents the evolutionary tracks in the HRD during the flash for and different assumptions of the Roche radius. The models quickly reach the line with . For comparison, also the track without Roche-lobe overflow is shown. During the adjustment phase, after the models have passed , mass-loss rapidly rises up to and forces the models to evolve back to . Finally, when the models evolve along at . When Roche lobe overflow ends () mass loss has dropped to .
After the end of Roche lobe overflow and the subflash phase the tracks rapidly merge with the one calculated without Roche lobe overflow at the beginning of final cooling evolution. As Fig. 12 shows the subflash excursion is the less pronounced the smaller .
The convergence of the tracks shows that the cooling properties of He-WD models are not seriously affected by the Roche lobe events because similar tracks imply similar radii and thus similar envelope masses which determine the cooling evolution due to hydrogen burning. This is confirmed by Figs. 13, 14 and 15. In Fig. 13 the evolution of the envelope mass, , is given as a function of for the tracks from Fig. 12, in Fig. 15 the corresponding evolution of surface luminosity as a function of is plotted. Figure 14 shows the reduction of envelope mass for all sequences as a function of close to and beyond. Figures 13 and 14 indicates that of the envelope mass is lost in the non-Roche model during the flash phase (taken from the first local maximum in to the last one). Note that the temporal increase of in Fig. 13 comes from the pulse driven convection zone by mixing hydrogen-rich material somewhat below the layers with which determine the border between core and envelope (cf. Fig. 6).
A significant reduction of sets in when dominant hydrogen burning has again established at the end of the subflash phase ( see Fig. 13 at and Fig. 14 for ). This envelope reduction is slowed down when the model enters the cooling branch (see Fig. 13 at and Fig. 14 for ). The envelope is eroded by mass loss and shell burning. This can be written as with the mass loss rate and the core growth rate . The core growth rate is given by with the hydrogen content and the gain of energy due to hydrogen burning per mass unit, .
For sequences without Roche-lobe overflow is mainly determined by shell burning, i. e. . With a mean value of and it is . With (see Fig. 14) one obtains in good agreement with the value obtained from Figs. 13 and 14.
For sequences with Roche-lobe overflow the situation is different. Here, the consumption of envelope mass occurs preferentielly due to the high mass-loss phase when the models are close to their Roche limit (, see Fig. 13). For instance, for the sequence with it is , corresponding to a mean mass loss of lasting for . Afterwards is further reduced by due to nuclear burning (see Fig. 14).


In the end, the envelope masses are almost the same when the different models enter the final cooling branch (, see Fig. 14), i.e. the residual envelope mass and the corresponding cooling evolution are rather independent from the evolutionary history.
On one hand, the latter result is consistent with the results of Iben & Tutukov (1986). In the case of Roche lobe overflow the high mass loss determines the evolutionary speed, whereas otherwise the evolution is characterized by the thermal timescale of the envelope. On the other hand, in their model the high mass loss causes a considerable loss of envelope mass () and prevents hydrogen burning from becoming ever dominant again. Consequently, their model cools down quite rapidly. The cooling time is of the order of a few whereas our models are controlled by residual hydrogen burning leading to cooling times of the order of Gyr (see Figs. 10 and 11).
Thus, from our calculations it appears that different mass loss histories during the phase of the hydrogen shell flashes do not influence the final cooling of He-WDs significantly. This result seems to be consistent with the calculations of Kippenhahn et al. (1968): Their model evolves through one major hydrogen shell flash and one strong subflash, both bringing the white dwarf radius above the critical Roche radius (points Q to R and T to U in their Fig. 1), resulting in a total mass loss of about which is comparable to the of the present calculation with only one high mass-loss episode. After a rapid evolution back to the cooling branch the evolution is slowed down, and at (point W in their calculation) a cooling age of approximately 2.55 Gyr is reached, comparable with our model which has at the same position Gyr. On the other hand, by assuming a linear correlation between and as a first approximation, the cooling age of the model of Iben & Tutukov (1986) can be estimated to be only at (using their points S and T, see their Fig. 1 and Table 1). This value is almost one order of magnitude below the one given by models which allow hydrogen burning to continue.
5 Summary
We have calculated evolutionary models of low-mass white dwarfs with helium cores to study in detail their cooling behaviour and their evolution including phases of thermally unstable hydrogen burning (hydrogen shell flashes). We found that the occurrence of these thermal instabilities is restricted to the mass range . It is noteworthy that a sufficient temporal resolution is essential to avoid numerical fluctuations in the energy output of the shell during early cooling branch evolution.
The flashes occur during the fast cooling of the shell at the beginning of the cooling branch evolution. This especially affects the lower part of the shell region where CNO cycling is the dominant contribution to hydrogen burning. CNO-burning is temperature sensitive enough to cause thermal instabilities if two conditions are fulfilled: The shell is thin enough (this is obviously not the case for ) and the cooling time is large enough as to avoid an extinction of the shell before the instability is fully established (this does not hold for ). The final cooling is not affected from possible flash events, i.e. hydrogen shell burning establishes again as dominant energy source at the end of the flash episode as in the case of non-flash models.
This result also holds when Roche-lobe overflow of the He-WD to a companion is considered during the expansion into the RGB regime. One of the main features related to hydrogen shell flashes is the change of envelope composition due to a pulse-driven convection zone which temporarily extends to the outermost layers of the star. The resulting drop in hydrogen is .
While the typical duration of a hydrogen flash is short compared to the cooling time of He-WDs ( compared to Gyr) and He-WDs evolve close to their cooling tracks for most of the time during a flash, the influence of these unstable phases on the mass-radius-relation of helium white dwarfs is moderate and restricted to effective temperatures of K.
Acknowledgements.
F.H. acknowledges funding by the Deutsche Forschungsgemeinschaft (grant La 587/16).References
- (1) Alberts F., Savonije G.J., van der Heuvel E.P.J., 1996, Nat. 380, 676
- (2) Alexander D.R., Ferguson J.W., 1994, ApJ 437, 879
- (3) Althaus L.G., Benvenuto O.G., 1997, ApJ 477, 313
- (4) Benvenuto O.G., Althaus L.G., 1998, MNRAS 293, 177
- (5) Blöcker T., 1995, A&A 297, 727
- (6) Blöcker T., Herwig F., Driebe T., Bramkamp H., Schönberner D., 1997, in: White Dwarfs, Isern J., Hernanz M., Garcia-Berro E. (eds.), Kluwer, Dordrecht, p. 57
- (7) Castellani V., Luridiana V., Romaniello M., 1994, ApJ 428, 633
- (8) Chin C.-W., Stothers R., 1971, ApJ 163, 555
- (9) Driebe T., Schönberner D., Blöcker T., Herwig F., 1998, A&A 339, 123 (Paper I)
- (10) El Eid M., 1994, A&A 285, 915
- (11) Frost C. A., Lattanzio J. C., Wood P. R., 1998, ApJ 500, 355
- (12) Gianonne P., Refsdal S., Weigert A., 1970, A&A 4, 428
- (13) Hansen B.M.S., Phinney E.S., 1998, MNRAS, 294, 557
- (14) Iben I. Jr., Tutukov A. V., 1986, ApJ 311, 742
- (15) Iglesias C.A., Rogers F.J., 1996, ApJ 464, 943
- (16) Iglesias C.A., Rogers F.J., Wilson B., 1992, ApJ 397, 717
- (17) Kippenhahn R., Weigert A., 1967, Z. f. Astr. 65, 251
- (18) Kippenhahn R., Weigert A., 1990, Stellar Structure and Evolution, A& A Library, Springer Verlag (Berlin)
- (19) Kippenhahn R., Kohl K., Weigert A., 1967, Z. f. Astr. 66, 58
- (20) Kippenhahn R., Thomas H.-C., Weigert A., 1968, Z. f. Astr. 69, 256
- (21) Reimers D., 1975, Mem. Soc. Sci. Liege 8, 369
- (22) Sackmann I.-J., 1977, ApJ 212, 159
- (23) Sarna M. J., Antipova J., Muslimov A., 1998, ApJ 499, 407
- (24) Schwarzschild M., Härm R., 1965, ApJ 142, 855
- (25) Slattery W.L., Doolen G.D., DeWitt H.E., 1982, Phys. Rev. A26, 2255
- (26) Webbink R.F., 1975, MNRAS 171, 555
- (27) Weigert A., 1966, Z. f. Astr. 64, 395
Appendix A Remarks on the appropriate temporal resolution
The question of sufficient resolution always arises when one deals with instabilities in evolutionary models. As mentioned in Sect. 2.2 thermal instabilities in He-WD model calculations can obviously be missed if too large time steps are used. Large time steps may also cause fluctuations in the shell energy output.

The four panels in Fig. 16 show a part of the evolutionary track of our He-WD model with in the vicinity of the turn-around point, with different temporal resolution. The corresponding evolution of the luminosity contribution due to hydrogen shell burning, , is shown in the four panels of Fig. 17.
The track with sufficient temporal resolution (upper left panel in Fig. 16, ) shows no perturbations due to fluctuations in the shell energy production (smooth curve in Figs. 16 and 17). When the maximum time step is increased to small perturbations occur in and in the track (for , see upper right panel in Fig. 16). When the maximum time step is further increased by a factor of 2 (lower left panel in Figs. 16 and 17) the fluctuations in and in the track are much more prominent but the evolution stabilizes after a final hook in the track at . In this case the shape of the tracks corresponds with those of e.g. Webbink (1975) or Sarna et al. (1998). Finally, for the calculations became numerically unstable.
Therefore, we selected as the maximum time step for our calculations. Additionally, to handle the large local changes in the luminosity budget of the models we coupled the evolutionary time step to changes in by reducing by a factor of 2 if changes by more than 5 %.
