The Intergalactic Medium
and Soft X-ray Background
Abstract
I present an overview of some of the recent advances in our understanding of the distribution and evolution of the ordinary, baryonic matter in the universe. Two observations that strongly suggest that most of the baryons seen at high redshift () have turned into some forms yet undetected at are highlighted. With the aid of large-scale cosmological hydrodynamic simulations, it is shown that most of the baryons today are in a gaseous form with a temperature of Kelvin – the “warm/hot gas”, shock heated during the gravitational collapse and formation of the large-scale structure at low redshift. Primarily line emissions from this warm/hot gas may account for a large fraction of the residual (after removal of identifiable discrete sources) soft X-ray background at keV. How this warm/hot gas may be detected by the next generation of EUV and soft X-ray instruments is indicated. Detection or non-detection of this warm/hot gas will have profound implications for cosmology.
Introduction
It is well known that most of the matter in the universe is in some non-luminous, dark form, with the cold dark matter being the most popular choice (Peebles 1993). Not only that, most of the ordinary, baryonic matter, which altogether makes up about 10-20% of the total matter in the universe, seems to be missing in the present=day universe. At redshift , the amount of gas contained in the Lyman alpha forest is (Rauch et al. 1997; Weinberg et al. 1997)
| (1) |
where is the baryonic density in units of the critical density extrapolated to and a Hubble constant km/s/Mpc is adopted throughout. Independently, the observed light-element ratios (in particular, the deuterium to hydrogen ratio) in some carefully selected absorption line systems at , interpreted within the context of the standard nucleosynthesis theory, yield the total baryonic density (Burles & Tytler 1998)
| (2) |
The agreement between these two completely independent measurements is remarkable. But, at redshift zero, after summing over all well observed contributions, the baryonic density appears to be far (by a factor of three) below that indicated by equations (1) and (2) (e.g., Fukugita, Hogan, & Peebles 1997):
| (3) |
Thus, unless two independent errors have been made in the arguments that led to equations (1) and (2), there is a sharp decline of the amount of observed baryons from high redshift to the present day; i.e., most of the baryons in the present-day universe are yet to be detected. Now, the evolution of universal baryons can be computed from standard initial conditions in the modern cosmological setting, using realistic large-scale hydrodynamic simulations. It is found that the large amount of baryons are not missing but hidden in an intergalactic gas with a temperature Kelvin - the “warm/hot gas” - at , which is difficult to detect (§2). §3 shows observable signatures of the warm/hot gas presents imprinted in the soft X-ray background. Several ways to detect this warm/hot gas are suggested in §4 and conclusions presented in §5.
Evolution of Cosmic Baryons
In a series of model simulations of nearly a dozen different models covering the current interest we have shown, consistently and robustly, that from to of all baryons in all models examined are shock heated during the gravitational collapse of the large-scale structure in the recent past and are in a warm/hot gas with a temperature of Kelvin at (Ostriker & Cen 1996) with each model being approximately normalized to match the local large-scale structure. It was clearly and immdiately understood that this model independent outcome found in earlier work would have profound implications for cosmology and it is therefore of paramount importance to verify it with latest simulations that include more relevant physics (including feedback from star formation and metal cooling, etc.) and have more accurate treatment of shocks (Ryu et al. 1993) than our prior code (Cen 1992). Indeed, it was confirmed by a recent higher-resolution, larger-size hydrodynamic simulation of a cold dark matter model with a cosmological constant. The adopted model - the Ostriker-Steinhardt (1995) Concordance model - is normalized to both the microwave background temperature fluctuations measured by COBE on large scales (Bunn & White 1997) and the observed abundance of clusters of galaxies in the local universe (Cen 1998) with , , , , and (with tensor contribution to the CMB fluctuations on large scales). The simulation box is Mpc with fluid elements and dark matter particles. Three components are followed separately and simultaneously: dark matter, gas and “galaxies”. The last component is created continuously (like real galaxies) during the simulation in places where local physical conditions permit rapid cooling and collapse, the dynamics of the aftermath of which cannot be followed in the present simulation. Instead, we allow star formation to occur in these regions where gravitational collapse cannot be reversed until stellar systems are formed, under plausible assumptions. In addition to standard physics in cosmological gasdynamic simulations, feedback into the intergalactic medium (IGM) from star formation is allowed in three related forms: UV radiation, supernova energy and mass ejection. Cooling due to metals is also included. The model reproduces the observed evolution of the luminosity density of the universe at various energy bands (Nagamine et al. 1999), the evolution of galaxy clustering (Cen & Ostriker 1998) and metallicity distributions (Cen & Ostriker 1999b) among others.
The results from this new simulation focusing on the evolution of the cosmic gas have been presented in Cen & Ostriker (1999a) and are summarized here. We divide the baryonic gas into three temperature ranges (1) K (the X-ray emitting gas in collapsed and virialized clusters of galaxies); (2) KK gas, which we will call the warm/hot gas and is located outside of clusters of galaxies; (3) K warm gas, which is seen in optical studies as clouds or Gunn-Peterson effect and is primarily in voids at . A last component (4) is the cold gas that has been condensed into stellar objects, which we designate “galaxies”. Figure 1 shows the evolution of these four components, and the results are consistent with our other knowledge. Most of the baryonic mass is in warm gas (Lyman alpha forest) at making up , which declines with increasing time to at , consistent with the HST observed clearing of the forest and of low-z redshift cloud gas (e.g., Shull 1996, 1997). The hot component increases in mass fraction with increasing time, reaching at , and is consistent with observations of the local properties of the X-ray emitting great clusters (e.g., White et al. 1993; Cen & Ostriker 1994; Lubin et al. 1996; Bryan & Norman 1998). The condensed component remains small, consistent with the known mass density in galaxies (e.g., Fukugita et al. 1997).

Our attention will be focused on the solid circles in Figure 1: the warm/hot gas rises rapidly with increasing time and dominates the baryonic mass budget by , reaching of the noncondensed mass fraction or 47% of the total baryons. Also shown in Figure 1 is the warm/hot component for two other models, an open CDM model with and (dotted curves), and a mixed hot and cold dark matter model with and (dashed curves) computed completely independently by Bryan & Norman (1998). Quite reassuringly, their results are in excellent agreement with ours. The density fluctuation amplitude normalization of their mixed dark matter model is somewhat below that required to produce the abundance of local galaxy clusters. Therefore, an appropriately normalized mixed dark matter model would yield a larger warm/hot gas fraction thus is in still better agreement with the other two models, re-enforcing the conclusion that the warm/hot gas makes up most of the baryonic matter today, independent of models as long as each model is normalized to match the local large-scale structure. Physically, this may be understood as follows. The temperature of the bulk of the gas today should be determined, to the zeroth order, by the velocity of converging waves that are collapsing today. The length of the waves that have become nonlinear today is about Mpc, which is almost exactly the scale that is used to normalize each model to match the local abundance of clusters of galaxies. It is worth stressing that the reason for most of the gas phase being in the warm/hot gas is primarily gravitational, as implied above. In other words, the gas is primarily shock heated during the gravitational collapse and formation of the present large-scale structure. Other potentially relevant physical processes, such as the meta-galactic radiation field, metal cooling and energy deposition into IGM from young galaxies, which were included in the simulation examined here, are shown to be not of primary importance (Cen & Ostriker 1999a), with increasing, secondary importance in that order.
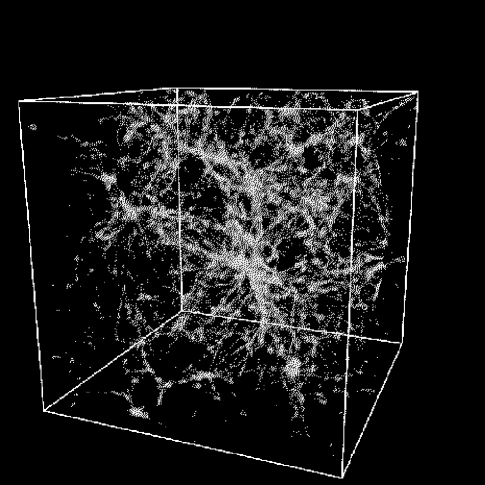
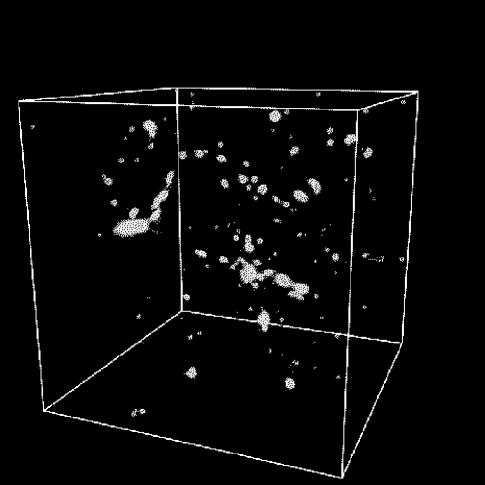
Figure 2 shows the spatial distribution of this warm/hot gas (the box size is Mpc) at . Figure 3 shows the spatial distribution of hot cluster gas with Kelvin at . We see in Figure 2 a filamentary network of the warm/hot gas with hot cluster gas (see Figure 3) residing at the intersections of filaments. These regions of warm/hot gas - groups of galaxies, filaments and sheets - typically have such a low surface brightness that current instrumentation does not detect them as distinct “sources”. The typical size (width of the filaments) is about one to several megaparsecs, corresponding to an angle of order a degree or so, if placed at a distance of a few hundred megaparsecs. The lengths of these filaments are tens of megaparsecs. The typical density of the filaments is about times the mean density of the universe.
Contribution To The Soft X-ray Background From The Warm/Hot Gas
It was shown in a simulation of a similar model but with somewhat lower resolution (Cen et al. 1995) that this warm/hot gas makes a nontrivial contribution to the soft X-ray background at keV. In the present higher resolution simulation we confirm this conclusion. After scaling down from to using latest observations (Burles & Tytler 1998) and noting the scaling relation, we find that of the total extragalactic soft X-ray background at keV comes from this diffuse warm/hot gas: keV/sec/cm2/keV/sr. Most of the emission at keV from the warm/hot gas is due to various blends of emission lines. Figure 4 shows X-ray emissivity of the background gas (i.e., warm/hot gas; dashed cruve) and of all the bright clusters with erg/s (solid curve) at redshift . The primary spectral signature of the background in the region 0.5-1.0keV is the “iron bump” (a mixture of iron and oxygen lines, primarily). Major lines in this range include a blend of OVII lines at 0.561-0.574keV (characteristic of K gas), a blend of lines from NeIX at 0.904-0.922keV (at a similar temperature), OVIII line at 0.654keV (peaked around Kelvin; the ratio of the 0.57keV to the 0.65keV features can be used as a temperature indicator) and a pair of iron XVII lines at 0.726keV and 0.739keV (which have peak strength at approximately K).

In the soft X-ray the Milky Way is a strong source of emission at an effective temperature of K. To some extent the soft X-ray background that we are proposing is the same as Galactic emission in that the sum over all galaxies like our own does make a nontrivial contribution to the soft X-ray background, since some of the warm/hot gas resides in the halos of galaxies. If the average galaxy emits erg/s in the 0.5-1.5keV band (cf. Fabbiano 1989), then the sum of all such will produce an emissivity of erg/cm3/sec/eV not far from the levels shown in Figure 4. But most of the emission shown by the dashed line in Figure 4 is due to hot gas in bigger systems than our own galactic disk or halo. Thus, the temperature (as weighted by ) is in the range K, whereas, for most of the galactic coronal gas, the typical temperature (as weighted by ) is in the range K. Thus, the line ratios indicative of the OVI/OVII and OVII/OVIII ratios will help in distinguishing between the two components. The spectral features which were noted above should help provide clues to the origin of the background radiation in this range as the galactic component is probably too cool to produce the iron blend which should be prominent in the background component described here. The steepening of the spectrum below 1keV seen recently by ASCA (cf. Gendreau et al. 1995) as well as the OVII lines (also noted by ASCA) are also tentative but direct observational evidence that the background gas we are discussing has already been detected. Recent ROSAT observations of the soft X-ray background (Wang & McCray 1993) seem to hint the existence of this warm/hot gas.
Shadowing by nearby neutral hydrogen-rich galaxies (McCammon & Sanders 1990; Wang & Ye 1996; Barber, Roberts, & Warwick 1996) quite convincingly shows that a significant fraction of at least the component in the range 0.5-1.0keV is truly extragalactic (cf. Burrow & Kraft 1993; Gendreau et al. 1995). Wang & Ye (1996) estimate that keV/sec/cm2/keV/sr out of the total soft X-ray background at keV is truly diffuse in nature. It thus deos not seem difficult for the contribution from the warm/hot gas to account for the residual, diffuse soft X-ray background.
It is found from simulations that one half of the soft X-ray background due to the warm/hot gas is emitted by structures at redshift and three quarters from . So one may be be able to identify the optical features associated with the emitting gas.
Ways To Detect The Warm/Hot Gas

The spectral features of this warm/hot gas are in the EUV and soft X-ray, which make it difficult to observe at low redshift due to possible confusion with features from the interstellar medium in our own galaxy. Proper identifications of spectral lines will allow to unambiguously distinguish local galactic features from extragalactic ones, for sufficiently distant, individual filamentary structures (perhaps ).
These individual structures may be detected directly in several ways. First, Hellsten et al. (1998), on the basis of similar simulations, have predicted the existence of an X-ray absorption forest due to ionized oxygen (O VII 574 eV line) in the warm/hot temperature range. Perna & Loeb (1998) have also made similar calculations based on simplified models for the IGM. Work underway with T. Tripp and E. Jenkins indicates that UV absorption lines (OVI 1032A,1038A doublets) due to gas in this temperature range primarily in the distant outskirts of galaxies may be detectable by current or planned instruments. Second, strong soft X-ray emission lines from highly ionized species (such as O VIII 653 eV line) should also be observable (Jahoda et al. 1998, in preparation). Figure 5 shows a histogram of emission focusing on the warm/hot gas in a narrow range of temperature relevant for OVI. Future UV observations such as proposed PRISM, HIMS or HUBE SMEX missions may be able to detect the gas at the high end of . Therefore, the next generation of UV to soft X-ray spectroscopic instruments with sufficient spectral resolution and sensitivity will provide direct ways to measure “the X-ray forest” or “the X-ray large-scale structure”, depending on whether it is seen in absorption or emission. Third, the warm/hot gas may show up as very broad, relatively weak (mostly having cm-2 with a small fraction at higher column densities), low redshift clouds (Shull 1996,1997; but observations more sensitive than current ones are required). NGST should be able to identify these local counterparts of the high redshift clouds.
If our prediction that most of the residual soft X-ray background is produced by the warm/hot gas is correct, then, since most of the soft X-ray background is produced by low redshift structures, this could be verified by associations of this soft X-ray background radiation field with relatively nearby large scale structure features, as well as by the soft X-ray angular auto-correlation function. A preliminary study (Cen et al. 1999, in preparation) indicates that the auto-correlation function of the soft X-ray background from warm/hot gas is positive up to a few degrees in separation, in good agreement with observations from ROSAT (Soltan et al. 1996). Cross-correlating soft X-ray background (Refregier, Helfand, & McMahon 1997) or Sunyaev-Zel’dovich effect (Refregier, Spergel, & Herbig 1998) with galaxies should provide additional important information. The next generation of X-ray instruments (AXAF and ABRIXAS), in conjunction with large-scale redshit surveys (e.g., Sloan Digital Sky Survey) should provide some potentially powerful tests of the existence of this warm/hot gas.
Conclusions
According to the current theory for the growth of cosmic structure, it is inevitable that most of the cosmic gas is shock heated during the course of gravitational collapse and formation of the present-day large-scale structure and ends up in a warm/hot gas with a temperature Kelvin in the present-day universe. This gas accounts for the so called missing baryons in our local universe, which constitutes most of the baryons today. This gas with density of times the mean density of the universe resides in a filamentary network with each individual filament having a length of tens of megaparsecs and a width of order one megaparsec, easily distinguishable from the much hotter gas in the centers of great clusters of galaxies, which is located in the intersections of the filaments and has a much higher temperature. The emission (primarily line emission) from this warm/hot gas dominates that from intracluster gas in the soft X-rays and may account for most of the residual soft X-ray background at keV. This network of filamentary warm/hot gas is probably too faint to be detected as individual sources by available instruments. However, the next generation of instruments in EUV and soft X-ray should be able to detect this warm/hot gas, in a number of possible ways, suggested in the previous section. If this warm/hot gas is detected, a consistent picture of gravitational growth of structure will be affirmed once again; otherwise, the current theory of structure formation within the gravitational instability paradigm and/or of standard light element nucleosynthesis may require a re-examination.
The work presented here should be mostly credited to my collaborators, Drs. Jeremiah P. Ostriker, Hyesung Kang and Dongus Ryu. I thank Dr. Greg Bryan for allowing to use the results from his simulations before publication. I thank Dr. Steven Brumby for his warm hospitality and for organizing an entertaining and stimulating conference. The work is supported in part by grants AST9318185 and ASC9740300.
References
- (1) Barber, C.R., Roberts, T.P., & Warwick, R.S., M.N.R.A.S., 282, 157 (1996).
- (2) Bryan, G.L., & Norman, M.L. Ap. J., 495, 80 (1998).
- (3) Bunn, E.F., & White, M., Ap. J., 480, 6 (1997).
- (4) Burles, S., & Tytler, D. Ap. J., 499, 699 (1998).
- (5) Burrows, D.N., & Kraft, R.P., Ap.J., 411, 685 (1993).
- (6) Cen, R., Ap. J. Suppl., 78, 341 (1992).
- (7) Cen, R., Ap. J., 509, 494 (1998).
- (8) Cen, R., Kang, H., Ostriker, J.P., & Ryu, D., Ap. J., 451, 436 (1995).
- (9) Cen, R., & Ostriker, J. P., Ap. J., 429, 4 (1994).
- (10) Cen, R., & Ostriker, J. P., preprint, astro-ph/9809370 (1998).
- (11) Cen, R., & Ostriker, J. P., Ap. J., 514, 1 (1999a).
- (12) Cen, R., & Ostriker, J. P., Ap. J., in press (1999b).
- (13) Fabbiano, G., A.R.A.A., 27, 89 (1989).
- (14) Fukugita, M., Hogan, C.J., & Peebles, P.J.E., Ap. J., 503, 518 (1998).
- (15) Hellsten, U., Gnedin, N.Y., & Miralda-Escudé, J., Ap. J., 509, 56 (1998).
- (16) Lubin, L., Cen, R., Bahcall, N.A., & Ostriker, J.P., Ap. J., 460, 10 (1996).
- (17) McCammon, D., & Sanders, W.T., A.R.A.A., 28, 657 (1990).
- (18) Nagamine, K., Cen, R., & Ostriker, J.P., Ap. J., submitted (1999).
- (19) Ostriker, J. P., & Cen, R., Ap. J., 464, 27 (1996).
- (20) Ostriker, J. P., & Steinhardt, P., Nature, 377, 600 (1995).
- (21) Peebles, P.J.E., Principles of Physical Cosmology (Princeton University Press: Princeton, NJ) (1993).
- (22) Perna, R., & Loeb, A., Ap. J., 503, L103 (1998).
- (23) Rauch, M., Miralda-Escudé, J., Sargent, W.L.W., Barlow, T. A., Weinberg, D.H., Hernquist, L., Katz, N., Cen, R., Ostriker, J.P., Ap. J., 489, 1 (1998).
- (24) Refregier, A., Helfand, D., McMahon, R.G., Ap. J., 479, L93 (1997).
- (25) Refregier, A., Spergel, D.N., & Herbig, T., preprint, astro-ph/9806349 (1998).
- (26) Ryu, D., Ostriker, J.P., Kang, H., & Cen, R., Ap. J., 414, 1 (1993).
- (27) Soltan, A.M., Hasinger, G., Egger, R., Snowden, S., & Truemper, J., A.& A., 305, 17 (1996).
- (28) Shull, J.M., A. J., 111, 72 (1996).
- (29) Shull, J.M., in “structure and evolution of the IGM from QSO absorption lines”, ed. P. Petitjean & S. Charlot (1997).
- (30) Gendreau, K.C., et al. , P.A.S.P., 47, 5 (1995).
- (31) Wang, Q.D., & McCray, R., Ap. J., 409, L37 (1993).
- (32) Wang, Q.D., & Ye, T., New Astron., 1, 245 (1996).
- (33) Weinberg, D.H., Miralda-Escudé, J., Hernquist, L., Katz, N., Ap. J., 490, 564 (1997).
- (34) White, S.D.M., Navarro, J.F., Evrard, A.E., & Frenk, C.S., Nature, 366, 6465 (1993).