Photometric and Kinematic Studies of Open Star Clusters I:
NGC 581 (M 103)
Abstract
We present CCD photometry and a proper motion study of the young open star cluster, NGC 581 (M 103). Fitting isochrones to the colour magnitude diagram, we found an age of Myr and a distance of roughly 3 kpc for this cluster. The proper motion study identifies 77 stars of or brighter to be cluster members. We combine membership determination by proper motions and statistical field star subtraction to derive the IMF of the cluster and find a quite steep slope of .
Key Words.:
open clusters and associations: individual: NGC 581 (M 103) – astrometry – stars: kinematics – Hertzsprung-Russell and C-M diagrams – stars: luminosity function, mass function1 Introduction
The shape of the initial mass function (IMF) is an important parameter to understand the fragmentation of molecular clouds and therefore the formation and development of stellar systems. Besides studies of the Solar neighbourhood (Salpeter salpeter (1955), Tsujimoto et al. tsuji (1997)), work on star clusters plays an important role (Scalo scalo1 (1986)), as age, metalicity, and distance of all cluster stars can be assumed to be equal.
Most of the previous studies indicate that the IMF of a star cluster has the shape of power laws
| (1) |
within different mass intervals. The following typical values of their exponents as given in Scalo (scalo2 (1998)):
| for | |||||
| for | (2) | ||||
| for |
Knowledge of membership is essential to derive the IMF especially of open star clusters, where the contamination of the data with field stars is a major problem. Two methods for membership determination are in use nowadays and each of them has its advantages and disadvantages:
-
•
The classical method is to separate between cluster and field stars by their proper motions: All cluster stars can be expected to move in the same way, whereas the field stars show more widely spread and differently centred proper motions (see e.g. the recent work of Francic francic (1989)). For each star a membership probability can be specified. To obtain a sufficient epoch difference, old as well as recent photographic plates are needed to measure proper motions, so that this method is limited by the comparably poor sensitivity of the old plates.
-
•
With the introduction of CCD imaging to astronomy, statistical field star subtraction became more popular. Assuming (almost) identical field star distributions in the cluster region itself and the surrounding area, the distribution of the field stars can be subtracted from the one of the (contaminated) cluster area. This makes sense for fainter stars but with the bright stars one deals with statistics of small numbers.
Our work combines these two methods of membership determination: The proper motions are investigated for the bright stars of the cluster, whereas the fainter stars are treated with statistical field star subtraction. From the cleaned data we derive the luminosity and mass functions of the cluster.
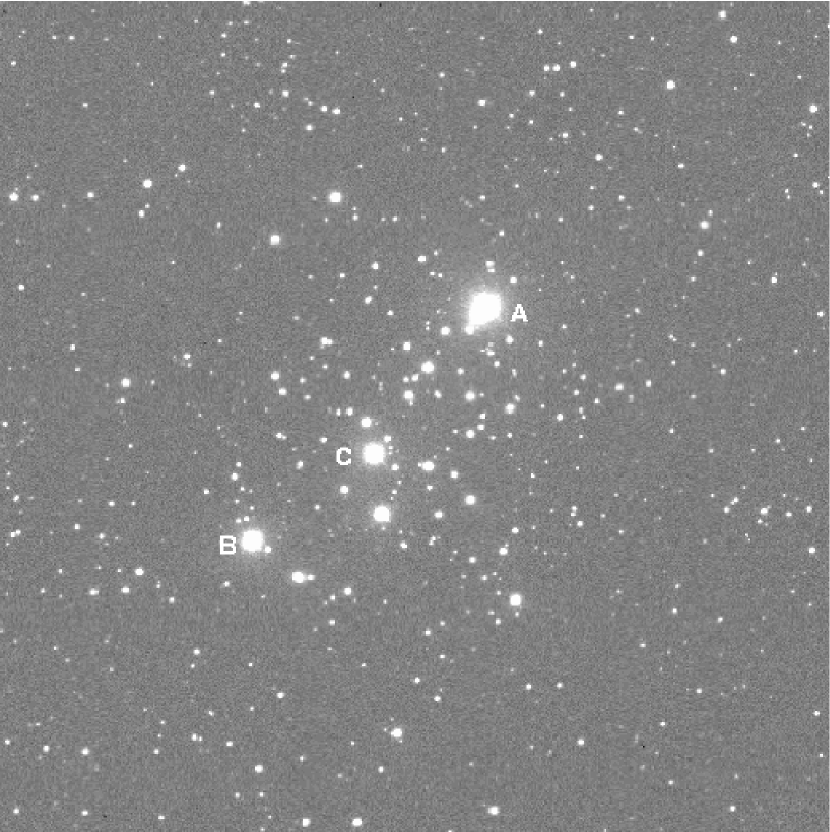
NGC 581 (M 103), which is located at , , was chosen as a first test object for our technique because the cluster and a sufficiently large field star region can be covered within the field of view of the telescope used. A image of NGC 581 is shown in Fig. 1.
In Sect. 2 we present our CCD photometry, and in Sect. 3 a proper motion study of NGC 581 and another cluster which is located on the photographic plates, Trumpler 1. The resulting colour magnitude diagram (CMD) is discussed in Sect. 4, leading to the determination of the IMF of NGC 581 in Sect. 4.4.
2 CCD photometry
The photometry is based on 22 CCD frames taken in Johnson and filters at the 1m Cassegrain telescope of Hoher List Observatory. The telescope was equipped with a focal reducing system and a 2k 2k CCD camera called HoLiCam (Sanner et al. holicam (1998)), which has a pixel size of and a resolution of . The field of view covered in this configuration is a circular area with a diameter of . Information about the images used for the photometry are summed up in Tab. 1.
The images of equal exposure times were averaged, resulting in integrated exposure times of 35 min in and 60 min in for the longest exposures. The shorter images were used to gain information about the bright stars which were saturated after longer exposure times. After standard image processing the photometry was performed with DAOPHOT II (Stetson stetson (1991)) running under IRAF. After an error selection process, the data were calibrated from instrumental to Johnson magnitudes using the photoelectric sequence of Hoag et al. (navy (1961)). Their standard stars as well as our instrumental magnitude values and their deviations are given in Table 2.
| filter | number of exposures | ||
|---|---|---|---|
| [s] | photometry | proper motions | |
| V | 10 | 3 | 0 |
| V | 60 | 1 | 0 |
| V | 300 | 7 | 7 |
| B | 10 | 3 | 0 |
| B | 60 | 2 | 2 |
| B | 600 | 6 | 6 |
| no. | ||||
| [mag] | [mag] | [mag] | [mag] | |
| 3 | 9.09 | +0.21 | ||
| 4 | 10.45 | +0.24 | ||
| 5 | 10.59 | +0.17 | ||
| 6 | 10.81 | +1.93 | ||
| 7 | 11.22 | +0.23 | ||
| 8 | 11.35 | +0.26 | ||
| 9 | 11.76 | +0.22 | ||
| 10 | 11.84 | +0.25 | ||
| 11 | 12.34 | +0.10 | ||
| 12 | 12.76 | +0.24 | ||
| 13 | 13.17 | +0.30 | ||
| 14 | 13.21 | +0.26 | ||
| 15 | 13.27 | +0.44 | ||
| 16 | 13.46 | +0.30 | ||
| 17 | 13.47 | +0.35 | ||
| 18 | 13.59 | +0.77 | ||
| 19 | 13.76 | +0.30 | ||
| standard deviations | ||||
We applied the following equations to transform instrumental to apparent magnitudes:
| (3) | |||||
| (4) |
with
| (5) | |||||
| (6) |
where and represent apparent and and instrumental magnitudes, respectively. Mean photometric errors in different magnitude intervals are given in Table 3. One can see that the errors for increase more rapidly as a consequence of HoLiCam’s poorer sensitivity in blue wavelengths. Although the total exposure time in was almost twice as large as in , the limiting magnitude of the photometry is defined by the images.
| range | |||
|---|---|---|---|
| 0.007 | 0.009 | ||
| 0.012 | 0.021 | ||
| 0.028 | 0.092 | ||
From these data, we determined a CMD which is shown in Fig. 2. It represents a total of 2134 stars for which both and magnitudes are available. We present the photometric data of all these objects in Table 4.
| No. | ||||
|---|---|---|---|---|
| [mag] | [mag] | |||
| 14380 | 1024.178 | 1122.116 | 10.603 | 0.168 |
| 14561 | 1136.343 | 1327.688 | 10.806 | 1.964 |
| 14503 | 1099.685 | 1056.475 | 11.028 | 0.177 |
| 14411 | 1046.961 | 1088.074 | 11.432 | 0.179 |
| 14288 | 972.818 | 1087.454 | 11.478 | 0.191 |
| 13899 | 697.822 | 446.703 | 11.674 | 0.530 |
| 13894 | 708.770 | 1589.465 | 11.776 | 1.917 |
| 14223 | 925.276 | 1073.279 | 11.776 | 0.242 |
| 14341 | 1003.143 | 1165.883 | 11.785 | 0.170 |
| 14928 | 1391.922 | 1103.418 | 11.871 | 0.229 |
The CMD shows two main sequence features and a scattered giant branch in a colour range around . More detailed analysis of the CMD is being presented in Sect. 4.

3 Proper motion study
3.1 Data reduction
For the proper motion study eight photographic plates from the Bonn Doppelrefraktor (until 1965 located in Bonn, thereafter at Hoher List Observatory) were used, covering an epoch difference of 81 years. The 16 cm 16 cm plates of the , instrument represent a region of . The plates were digitized with the PDS machines of the Astronomisches Institut Münster and the Tautenburg Plate Scanner (TPS) of Thüringer Landessternwarte Tautenburg (Brunzendorf & Meusinger TPS (1998)). The positions gained with DAOPHOT II from 15 CCD frames were added to the plate data. Tables 1 and 5 give an overview of the material included in the proper motion study.
| plate no. | date | scan | |
|---|---|---|---|
| R 0285 | 23.01.1917 | 30 | MS/T |
| R 0294 | 09.02.1917 | 30 | MS |
| R 0295 | 09.02.1917 | 3 | T |
| R 1281 | 03.12.1977 | 60 | MS |
| R 1291 | 05.12.1977 | 64 | MS |
| R 1295 | 19.12.1977 | 4 | T |
| R 1298 | 19.12.1977 | 4 | T |
| R 1899 | 24.03.1998 | 60 | T |
The celestial positions of the stars were determined from the plate coordinates with respect to six HIPPARCOS stars (ESA hipp (1997)) using an astrometric software package developed by Geffert et al. (geffert (1997)). We obtained good results using quadratic polynomials (6 plate constants) for transforming to for the photographic plates and cubic polynomials (10 constants) for the CCD images, respectively. The mean positional deviations of the HIPPARCOS stars after the first reduction step were of the order of in both right ascension and declination. Using the output positions and proper motions of each step as the basis of the next run, we derived a stable solution of proper motions of a total of 2,387 stars on the whole field after four iterations with a mean error for the proper motions of approx. in both coordinates. The differences between our measurements and the HIPPARCOS data (“observed – calculated” or values) are listed in Table 6. Compared with our measurements, HIPPARCOS star no. 7155 showed high deviations — probably caused by a double star nature of this object (Wielen et al. wielen (1998)) — and was therefore excluded before the data reduction. We present the proper motions of all stars in Table 7.
| star no. | ||||
|---|---|---|---|---|
| [mas yr-1] | [mas yr-1] | |||
| 6979 | ||||
| 7640 | ||||
| 7497 | ||||
| 6793 | ||||
| 6927 | ||||
| 6841 |
| No. | ||||
|---|---|---|---|---|
| [h m s] | [ ] | [mas yr-1] | [mas yr-1] | |
| 14380 | 1 33 21.800 | +60 40 12.25 | ||
| 14561 | 1 33 33.908 | +60 42 59.62 | ||
| 14503 | 1 33 30.184 | +60 39 19.62 | ||
| 14411 | 1 33 24.347 | +60 39 44.88 | ||
| 14288 | 1 33 16.193 | +60 39 43.50 | ||
| 13899 | 1 32 46.876 | +60 31 02.94 | ||
| 13894 | 1 32 46.417 | +60 46 26.62 | ||
| 14223 | 1 33 10.977 | +60 39 31.50 | ||
| 14341 | 1 33 19.427 | +60 40 47.50 | ||
| 14928 | 1 34 02.261 | +60 40 00.25 |
3.2 NGC 581
228 stars were located within from the centre of NGC 581. Only these shown in Fig. 3 were taken into account for the vector point plot diagram. Due to the cluster’s large distance (see Sect. 4.2), the centres of the distributions of field and cluster stars are more or less the same. Therefore, the separation between field and cluster stars is not very apparent.

According to the method presented by Sanders (sanders (1971)), we fitted a sharp (for the members) and a wider spread (for the field stars) Gaussian distribution to the distribution of the stars in the vector point plot diagram. We computed the parameters of the two distributions with a maximum likelihood method. From the values of the distribution at the location of the stars in the diagram we derived the membership probabilities. Due to the small difference between the centres of the two distributions the stars with proper motions far away from the maximum are clearly identified as non-members, whereas it is difficult to decide which objects of the central region do belong to the cluster and which not. This is represented in the histogram for the membership probabilities (Fig.4) with a clear peak at and a much less pronounced increase towards . Fig. 5 shows the positions of the member and non-member stars.


With this method 77 stars were classified to be members of NGC 581 with a probability of at least 0.8, while 151 objects show a lower membership probability. The average proper motions for cluster stars are:
and for the field stars:
Although the values are very similar, the standard deviations show a large difference between field and cluster stars. We should remark that the ”true” members might be more concentrated towards the cluster centre, but because of the problems in dividing between cluster and field stars, some non-members might be taken for member stars and vice versa.
3.3 Trumpler 1
Near the edge of the photographic plates we found the open star cluster Trumpler 1 for which we attempted a proper motion study, too, as a by-product of our work.
In a region of around the centre of the cluster at , , we detected only 64 stars on the base of the photographic plates. CCD photometry is not available. A membership analysis with the same methods as described above resulted in average proper motions of
for the cluster members and
for the field stars. We present a vector point plot diagram in Fig. 6.

It should be mentioned that these proper motions are less accurate than our results for NGC 581, as Trumpler 1 is located close to the edge of the plates and we did not include CCD positions in our analysis. However, the results indicate that Trumpler 1 and NGC 581 have not only roughly the same ages and distances (see Phelps & Janes phelps1 (1993)), but — within the errors — the same absolute proper motions. Therefore, the two objects may be taken as a candidate for a binary star cluster (see e.g. Subramaniam et al. subram (1995)) as they are known for the Magellanic Clouds (Dieball & Grebel dieball (1998)).
4 Analysis of the colour magnitude diagram
4.1 Field star subtraction
The CMD derived in Sect. 2 is contaminated with field stars. Before trying to analyse the CMD it is essential to subtract these stars to emphasise the features which belong to NGC 581 and to prepare the data for the determination of the cluster IMF.
In the magnitude range covered by the proper motion study it is possible to distinguish between field and cluster stars using the information of the membership probabilities from Sect. 3. The proper motion study is complete down to so that until this point, a membership probability of 0.8 or higher is considered a suitable criterion for the definition of the members of NGC 581.
Below this limit, the star numbers are high enough to justify a statistical field star subtraction. For this, the CCD field was divided into two regions of the same area of pixels: a circular region with the star cluster in its centre (radius: 654 pix. or ) and a ring encircling this region (outer radius: 925 pix. or ). Under these assumptions, all cluster members are surely located in the central area. For both parts separate CMDs were computed. Each of them was divided into rectangular bins with a length of in magnitude and in colour. (Variation of the bin sizes did not affect the results.) The numbers of stars in the field CMD cells were determined and as many stars of the corresponding cell of the inner region CMD were randomly chosen and removed. Assuming a homogeneous distribution of field stars over the whole field of view, the resulting CMD, which is presented in Fig. 8, represents only the cluster members.
To illustrate the advantage of our method, Fig. 7 shows the luminosity functions obtained with the proper motions and the statistical field star subtraction, respectively, in the range of the photographic plates (). It can be seen that the proper motion analysis leads to less member stars than the statistical subtraction.

4.2 Morphology of the cluster CMD and age determination
The brightest stars in the field of NGC 581 (marked with letters A to C in Fig. 1) were saturated even in the shortest exposures so that no direct photometric information was available for them. However, the three stars were the subject of previous photoelectric studies (Hoag et al. navy (1961), Purgathofer wien (1964)) so that their magnitudes and colours could be added to our CMD manually. Star A was too bright to be measured on the photographic plates with a sufficient accuracy so that we could not derive its proper motion, either. However, since star A is a HIPPARCOS star (ESA hipp (1997), star no. 7232), we could get its proper motion from this source. Calculating its membership probability led to a value of 0.89. Star B has a proper motion far away from the one of the cluster so that it can be considered a non-member, while star C belongs to NGC 581 with a probability of 0.90.
After field star subtraction, we found three red stars with from to . Compared with the well populated main sequence in the same magnitude range, it seems obvious that these objects cannot be cluster members. We assume these objects to be field stars which are classified as member stars as a consequence of the small difference between field and cluster proper motions.
The secondary main sequence and giant branch like structures completely vanished within the range of the proper motions. Below , we still find some stars remaining in the region of these features. Since the vector point plot diagram does not give any evidence for a second cluster in the same line of sight, we assume that these stars belong to the field star population(s). It is very unlikely, too, that the remaining stars are pre main sequence cluster members, because at the age of NGC 581 (see the following paragraph) this kind of objects should be much closer to the main sequence than the stars in the CMD are (Iben iben (1965)). Therefore we assume these stars to be remnants of the field star subtraction due to the imperfect statistics of the sample.
We fitted isochrones of the Geneva group (Schaller et al. schaller (1992)) to the resulting CMD from which we derived the distance modulus, reddening, age, and metalicity of NGC 581. The best fitting isochrone is plotted into the cleaned CMD of Fig. 8. The parameters of the selected isochrone are shown in Table 8. Isochrones of the Padua group (Bertelli et al. padua (1994)) were fitted to the CMD for comparison and led to the same set of parameters.

| distance modulus | = | |
|---|---|---|
| i.e. distance | = | pc |
| reddening | = | |
| age | = | |
| i.e. | = | |
| metalicity | = |
4.3 Completeness correction
To obtain comprehensive luminosity and initial mass functions, the data have to be corrected for completeness. As crowding is not a problem in our images, the completeness in the field and cluster regions are the same so that it is not necessary to correct for completeness before the field star subtraction.
With artificial star experiments using the DAOPHOT II routine addstar we derived the completeness function shown in Fig. 9. As the images reach down to much fainter magnitudes, these experiments were only performed with the exposures. Down to the sample is more than complete with a sharp drop afterwards to almost at . Figure 9 shows that the completeness level of is reached around , so that we assume this value to be a reasonable cut-off for our studies. With a main sequence star colour of for , this corresponds to a limiting magnitude of .

4.4 Initial mass function
With the stars of the cleaned CMD we determined the luminosity (Fig. 10) and initial mass functions of NGC 581 after deleting all objects outside a wide strip around the main sequence and above the turnover of the isochrone around from the CMD and applying the completeness correction described in Sect. 4.3. As mentioned in Sect. 3.2, some field stars will have stayed in the sample while a few cluster stars might have been rejected. However, we assume these two effects do not influence the IMF of NGC 581.
From the initial stellar masses given in the Geneva isochrone data, we computed a mass-luminosity relation represented by a order polynomial:
| (7) |
with the following parameters:
A order polynomial still did not fit the faint part of the mass-luminosity relation well enough. With Eq. (7) we derived the initial masses of the stars classified as objects of NGC 581 on the base of their magnitudes. was preferred compared with the values as their photometric errors are smaller at equal magnitudes.
We included all stars with a mass of higher than (corresponding to the previously mentioned value of or ). In this range, the completeness is or higher. 198 stars were selected by this criterion. The stars were divided in wide bins. The star numbers were corrected using the results of the completeness calculation, resulting in 247 “virtual” stars from down to . The resulting histogram is presented in Fig. 11. The single star with a mass around () was not taken into account for the IMF determination, since this single object at one end of the histogram might heavily influence the IMF slope. The slope of the IMF was determined by linear regression to the histogram.
We obtained from the stars with a mass from to (An experiment including the star led to and therefore to a difference in the exponent of more than 0.3!). The resulting IMF is shown in Fig. 11.


5 Summary and discussion
NGC 581 is a young open star cluster with an age of 16 Myr. It is located at a distance of 2900 pc from the Sun. We derived proper motions of 228 stars in the region of the cluster down to . 77 of those can be considered members of the object. A study of the IMF of NGC 581 leads to a power law with a slope of .
The results of the photometry mainly coincide with the findings of Phelps & Janes (phelps1 (1993)), however, we do not find evidence for a star formation over a period of as long as 10 Myr: While Phelps & Janes claim the necessity of two isochrones of different ages to fit both the blue and red bright stars in their CMD, the Geneva isochrone fits all features of our CMD sufficiently well.
The IMF slope might be slightly higher than Scalo’s (scalo2 (1998)) figure for this mass range, as Phelps & Janes (phelps2 (1994)) find a steep slope for NGC 581, too. Their value of marks the steepest IMF of their entire study of open star clusters. Although their IMF is based on a photometry with a deeper limiting magnitude, our determination has its advantages, too: Phelps & Janes only used statistical field star subtraction and no information of proper motions, which may have great impact on the high mass range and therefore might affect the slope of the IMF. Furthermore, they only took one single region in the vicinity of their star clusters for the field star subtraction, while we were able to use the surrounding of the cluster itself. And finally, their field of view is so small that they probably did not cover the entire cluster which, assuming the presence of mass segregation, might have flattened their IMF due to a lack of low mass stars from the outer regions of the cluster.
If we would not have based part of the membership determination on the proper motions, we would have ended up with 9 more stars in the magnitude range of (see Fig. 7). Since the total star number in this region is low, this would have decreased the IMF the slope to . Within the errors, this result would still match with our value above, however, the shape of this IMF is less well represented by a power law, which is expressed by the higher error. Therefore we claim that adding the information of the field star subtraction did improve the reliability of our IMF study.
Acknowledgements.
The authors acknowledge Wilhelm Seggewiss for allocating time at Hoher List Observatory and Albert Bruch for time at the Münster PDS machines. Thanks a lot to Andrea Dieball for the field star subtraction software and to Klaas S. de Boer and Andrea Dieball for carefully reading the manuscript of this publication. J.Sa. especially thanks Thomas Schimpke for introducing him to the use of PDS and the software for handling the digitised photographic plates and Georg Drenkhahn for his support in programming IRAF scripts. J.B. acknowledges financial support from the Deutsche Forschungsgemeinschaft under grant ME 1350/3-2.References
- (1) Bertelli G., Bressan A., Chiosi C., Fagotto F., Nasi E., 1994, A&AS 106, 275
- (2) Brunzendorf J., Meusinger H., 1998, in: The Message of the Angles — Astrometry from 1798 to 1998, eds. P. Brosche, W.R. Dick, O. Schwarz et al., 148
- (3) Dieball A., Grebel E., 1998, A&A 339, 773
- (4) ESA, 1997, The HIPPARCOS and Tycho Catalogues, ESA SP–1200
- (5) Francic S.P., 1989, AJ 98, 888
- (6) Geffert M., Klemola A.R., Hiesgen M., Schmoll J., 1997, A&AS 124, 157
- (7) Hoag A.A., Johnson H.L., Iriarte B. et al., 1961, Pub. US Naval Obs. 17, 347
- (8) Iben I., 1965, ApJ 141, 993
- (9) Phelps R.L., Janes K.A., 1993, AJ 106, 1870
- (10) Phelps R.L., Janes K.A., 1994, ApJS 90, 31
- (11) Purgathofer A., 1964, Ann. Wien 26, 37
- (12) Salpeter E.E., 1955, ApJ 121, 161
- (13) Sanders W.L., 1971, A&A 15, 173
- (14) Sanner J., Dieball A., Schmoll J., Reif K., Geffert M., 1998, in: IV International Workshop on Positional Astronomy and Celestial Mechanics 1996, eds. A. Lopez Garcia, L.I. Yagudin, M.J. Martínez Usó et al., 373
- (15) Scalo J.M., 1986, Fund. Cosm. Phys. 11, 1
- (16) Scalo J.M., 1998, ASP Conf. Series 142, 201
- (17) Schaller G., Schaerer D., Meynet G., Maeder A., 1992, A&AS 96, 269
- (18) Stetson P.B., 1991, in: ESO/ST-ECF Garching Data Analysis Workshop, Grosbøl P.J., Warmels R.H. (eds.), 187
- (19) Subramaniam A., Gorti U., Sagar R., Bhatt H.C., 1995, A&A 302, 86
- (20) Tsujimoto T., Yoshii Y., Nomoto K. et al., 1997, ApJ 483, 228
- (21) Wielen R., Dettbarn C., Jahreiß H., Lenhardt H., Schwan, H., 1999, A&A 346, 675