A Multiwavelength View at the Heart of the Superwind in NGC 253
Abstract
Although NGC 253 is one of the nearest starburst galaxies, the activity in its central regions is yet to be fully understood. Here we present new optical data from the Hubble Space Telescope of its central region, which reveal numerous discrete sources in a ring–like structure. This is combined with data at infrared, millimeter, radio and X–ray wavelengths to examine the nature of these discrete sources and the nucleus itself.
We find that the majority of optical/IR/mm sources are young star clusters which trace out a 50 pc ring, that defines the inner edge of a cold gas torus. This reservoir of cold gas has probably been created by gas inflow from a larger scale bar and deposited at the inner Lindblad resonance. The family of compact radio sources lie interior to the starburst ring, and in general do not have optical or IR counterparts. They are mostly SNRs. The radio nucleus, which is probably an AGN, lies near the centre of the ring. The X–ray emission from the nuclear source is extended in the ROSAT HRI detector indicating that not all of the X–ray emission can be associated with the AGN. The lack of X–ray variability and the flat radio spectrum of the nucleus, argues against an ultraluminous SN as the dominant energetic source at the galaxy core. The diffuse emission associated with the outflowing superwind is present in the central region on a size scale consistent with the idea of collimation by the gas torus.
keywords:
galaxies: active – galaxies: starburst – X-rays: galaxies – galaxies: individual: NGC 253 – galaxies: nuclei.1 Introduction
The central regions of galaxies are often the focus of extragalactic studies. It is here that stellar and gas densities are the highest, which in turn may lead to an intense starburst or AGN activity associated with a black hole. Although intensively studied, our understanding of the central activity in galaxies is still somewhat limited. For example, what is the relationship between an AGN, a circumnuclear starburst and an outflowing superwind ?
Within a few Mpc of the Milky Way there are three starburst galaxies, with superwind emission. They are NGC 253 in the Sculptor group of galaxies, M82 in the M81 group and NGC 1569. Both NGC 253 and M82 galaxies are highly inclined spirals, revealing a strong nuclear starburst and an outflowing superwind perpendicular to the disk, while NGC 1569 is a dwarf starburst (Heckman et al. 1995). Both M82 and NGC 253 may harbor massive black holes (see Wills et al. 1999 and Ptak & Griffiths 1999 for evidence at radio and X–ray wavelengths for evidence for an AGN in M82), while for NGC 1569 there is no real evidence for a massive black hole.
As part of this study, we will discuss the evidence for a massive black hole in NGC 253. Here we present new narrow band images of the central regions of NGC 253 using the Hubble Space Telescope (HST). At a distance of 2.5 Mpc, the 0.1 resolution of HST corresponds to 1.21 pc, thus allowing us to probe central star formation on size scales relevant to individual star clusters. We also analyse X–ray images of NGC 253 from the ROSAT database and include data from the literature at other wavelengths. Although NGC 253 is a remarkably complex system, with a very extensive and interesting superwind, in this paper we focus on the central regions, using optical, infrared, mm, radio and X–ray observations to study the processes right at the heart of the superwind.
2 Observations and Data Analysis
2.1 HST [SIII]9532 images
We obtained new observations of the central region of the starburst galaxy NGC 253 on 1997 July 9 using the Wide Field and Planetary Camera 2 (WFPC2) of the Hubble Space Telescope. The pointing was such that the galaxy nucleus was centred in PC chip and the WFC chips imaged the region SE of the nucleus. Two exposures were taken through each of the F953N (c = 954553 Å) and F850LP (c = 9101986 Å) filters of 1300s and 300s respectively. These correspond to the line emission of [SIII]9532 and nearby continuum.
For each of the two filters we found no significant shift between the two exposures and so combined them using the STSDAS task crrej. This effectively removed cosmic rays. Each image was then scaled to an exposure time of 1 second. The continuum image was scaled for filter throughput, based on the WFPC2 handbook, and then subtracted from the narrow band image to produce a line–only [SIII]9532 image. The final image is shown in Fig. 1.
We also obtained WFPC2 archive data on the nuclear region of NGC 253.
Images through filters F656N
(c = 656421 Å)
and F675W (c = 6726866
Å) covering a similar spatial region as our data were available.
The exposure times were 2 1200s and 2 200s respectively.
In this case the galaxy nucleus was centred on WF3.
These images were then reduced in a similar way to the F953N and F850LP
data.
The final line–only H image contains one foreground star,
which allowed
us to check our continuum subtraction in this case.
2.2 ROSAT HRI and PSPC images
Observations of NGC 253 have been carried out with both the HRI and PSPC instruments onboard ROSAT. We obtained three HRI and two PSPC observations from the Leicester Data Archive. Details of the observations are given in Table 1.
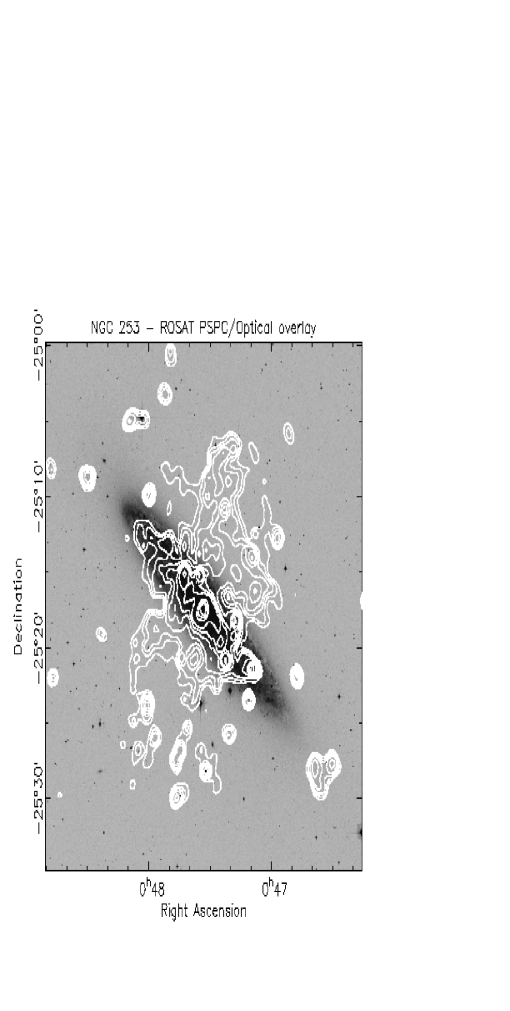
The data were reduced and analysed using the Starlink ASTERIX software. The PSPC data were cleaned of periods of high background and poor pointing stability, leaving a total of 22,015s of good data between the two images. The data were sorted to form a spectral image over a 0.85∘ 0.85∘ region centred on the nucleus of NGC 253. A model of the background was constructed using data from an annulus r=0.2∘ to r=0.3∘. The task pss was used in several iterations to remove sources from the background annulus which was then scaled up to the whole image size allowing for energy dependant vignetting. Source positions in each image were then measured and the two images were found to have no significant shift. They were combined using the task add. The background files for the two images were also combined. Finally the pss task was used to locate and measure point sources. The PSPC image is shown overlaid on an optical image of NGC 253 in Fig. 2. The main features are the extended superwind emission extending about 12 (9 kpc) above the plane of the galaxy with emission also extending along the disk of the galaxy. There are a large number of X-ray point sources, both in the plane of the galaxy and in the near vicinity. The superwind emission has been studied before by Read et al. (1997), Fabbiano (1988) and Dahlem, Weaver & Heckman (1998). The superwind X-ray emission is generally similar in structure to that seen in M82 (Strickland, Ponman & Stevens 1997). In this paper, we focus on the inner regions of the superwind, and will not discuss the extended emission further. The X–ray data on the inner regions and the X–ray point sources there will be discussed in more detail in Section 3.3.
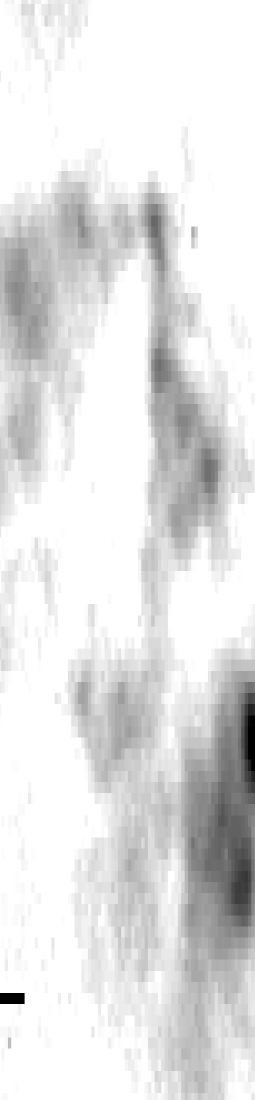
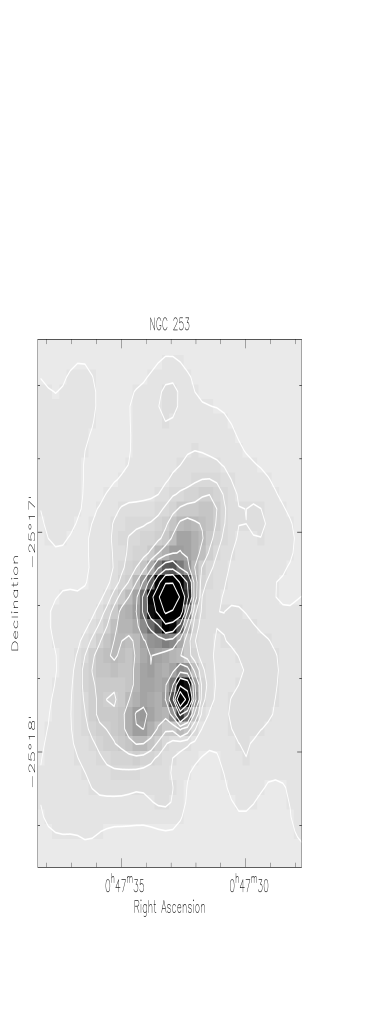
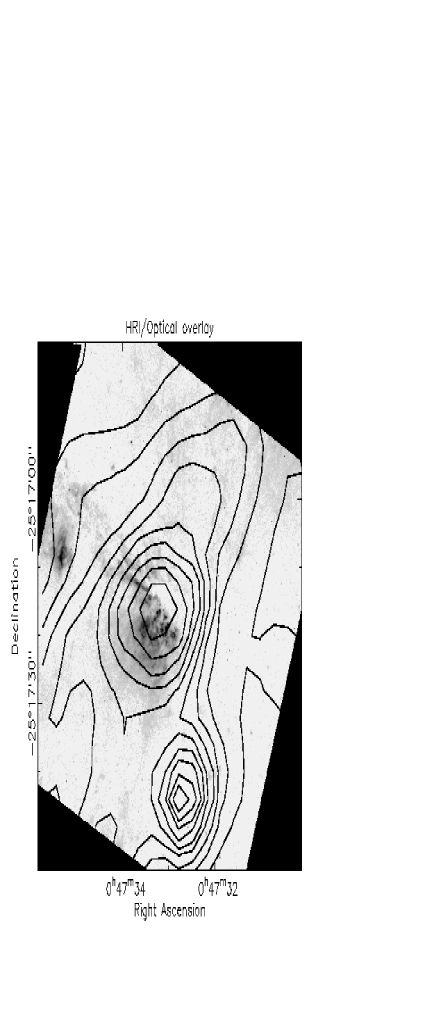
For the HRI data, the three data sets were sorted into images of size 0.3∘ 0.3∘ centred on the nucleus and then the positions of bright sources determined. The background was calculated by taking the mean value of the image after the bright sources had been removed. No vignetting correction was applied. The images were then aligned and combined, giving a total effective exposure time of 56,494s. The HRI image of the central regions is shown in Fig. 3 (left panel), and the HRI image overlaid on the HST H image is shown in Fig. 3 (right panel).
Both the HRI and PSPC images clearly reveal a number of point sources in the disk/bulge but also diffuse disk emission and a spectacular bi–conical emission perpendicular to the disk in the case of the PSPC (see Fig. 2.
3 Discrete Sources
3.1 Optical, Infrared and Millimeter Sources
Using a then new 256 256 IR array and high spatial sampling (0.05/pixel in 0.7 seeing conditions) Forbes et al. (1991) detected several ‘hotspots’ or discrete sources in the central region of NGC 253 at 1.65m (H band). Since then several other imaging studies of NGC 253 have been carried out, e.g. Br, [FeII], H2, K band (Forbes et al. 1993); 8.5, 10, 12.5m (Keto et al. 1993); 10m (Pina et al. 1993); J, H, K bands (Sams et al. 1994); H, K, L, M bands and PAH feature (Kalas & Wynn–Williams 1994); [NeII] and 12.8m (Boker et al. 1998). These studies have also revealed multiple discrete sources.
Measuring absolute positions for these sources has been problematic given the small field-of-view of the IR arrays. Forbes et al. (1991) assumed that the brightest 2.2m (K band) source was at the dynamical centre and therefore spatially coincident with the radio nucleus (source 2 in Turner & Ho 1985). More recent astrometry has shown that this is not the case, and that the IR maximum is actually W and S of the radio nucleus (Kalas & Wynn–Williams 1994). The position of this IR maximum is constant from 1.6 to 4.8m (Kalas & Wynn–Williams 1994) and even to 12.5m (Keto et al. 1993). Taking a simple mean of the position from Kalas & Wynn–Williams (1994), Keto et al. (1993) and Pina et al. (1992) we calculate its location to be = 00h47m33.006s , = –25∘1718.23 (J2000). Thus the brightest IR source is assumed to lie at this position and all other IR sources are shifted relative to it.
The brightest source in the [SIII]9532 image is located at = 00h47m32.968s, = –25∘1718.47 (J2000) according to the STSDAS astrometry task called metric. This position is within 0.51 and 0.24 in R.A. and Dec. of the IR maximum. According to the HST handbook, the metric derived positions could have an absolute positional error of . We will assume that the brightest [SIII] source is spatially coincident with the IR maximum and shift it by R.A. = 0.51 and Dec. = 0.24. Given the extinction in the central region, this assumption may be questionable. However, as we show later, some of the other [SIII] sources reveal a good positional agreement with other IR sources after the offset. This gives us confidence that the brightest [SIII] source is indeed associated with the brightest IR source.
The H image has a very similar morphology to the [SIII] image, so there is little chance of confusion in comparing the images. We find that the brightest [SIII] source corresponds to the second brightest H source. We have shifted this source to match the position of the IR maximum as well.
The brightest 11 discrete sources in the [SIII]9532 and H images form an elliptical ring (see Fig. 1). The ring has rough dimensions of (48 pc) in the SW–NE direction and (18 pc) in the SE–NW direction. The position angle is 60o. The projected ellipticity of the ring is about 0.6, however if it lies at an inclination of 78o (i.e same as the overall inclination of the galaxy), then it is intrinsically almost circular. Beyond the ring there are 4 clearly identifiable discrete sources. We have measured the counts in a 0.4 diameter aperture centred on each source maximum. These have been converted into flux using equation 11 from Holtzman et al. (1995). In Table 2 we list the corrected positions, offset from the radio nucleus (i.e. = 00h47m33.169s, = –25∘1717.06 J2000), the [SIII]9532 flux, the H flux and the dereddened ratio of [SIII]9532+9069 to H.
The WFPC2 H image has been published previously by Watson et al. (1996). They also described the H sources as forming a ring–like structure but only measured the flux from 4 of them. Confusingly the ‘bright blob’ they refer to is the brightest continuum source, but only ranks as the second brightest H line emission source. Like us, they used 0.4 diameter apertures. Rather than use the Holtzman et al. (1995) formula they compared the count rates from each source with an assumed power–law model for the continuum to get the required flux levels. In units of erg cm-2 s-1, their measurements followed by ours in brackets are 6.8 (1.5), 3.5 (0.8), 5.3 (1.0), 1.0 (0.3). Thus the Watson et al. values are typically a factor of 3 greater. This discrepancy could be due to different centerings and/or a different counts-to-flux conversion, but without further details of the Watson et al. method we can only speculate.
The central regions of NGC 253 have also been observed in the HCN = 1 0 transition (Paglione, Tosaki & Jackson 1995). This molecular line traces dense ( cm-3) gas. They found that the HCN–emitting clouds lie along a line in the SW to NE direction. The brightest, and highest density, HCN source lies 0.5 in R.A. and 2 in Dec. from the IR maximum. The beam size used was 4.2 2.2, with a claimed positional accuracy of 0.4. It is debatable whether the brightest HCN source is spatially coincident with the IR maximum. We have decided that is probably is, and have shifted each of the other 7 HCN sources appropriately. In the discussion below, the reader should bear in mind the possibility that this HCN source is not actually associated with the IR maximum. The other 7 HCN sources lie beyond the ring region. The corrected positions of the infrared and mm sources are summarised in Table 3.
3.2 Radio Sources
High spatial resolution radio maps of NGC 253 have been obtained at 1.3, 2, 3.6, 6 and 20cm by Turner & Ho (1985), Antonucci & Ulvestad (1988) and Ulvestad & Antonucci (1991, 1994, 1997). These maps reveal a family of discrete sources. The position of these sources within different maps agree to about . We have decided to adopt the 2cm mapping by Ulvestad & Antonucci (1997) because of its high spatial resolution and good sensitivity. The brightest radio source (about three times brighter than the next strongest) which has a flat spectrum () and high brightness temperature (TK), appears to be a compact synchrotron source. This source (also known as TH2 from Turner & Ho 1985) is probably an AGN and the true nucleus of NGC 253. We will refer to this source as the ‘radio nucleus’. It is located at = 00h47m33.169s, = –25∘1717.06 (J2000). The positions, 2cm fluxes, 2cm luminosities and 6 to 2cm spectral indices for the 16 strongest 2cm radio sources are listed in Table 4.
In Fig. 4 we show the location of the H, [SIII]9532, IR, mm and radio discrete sources seen in the central 50pc after aligning the different sources as described above. There is a good spatial correspondence between the H and [SIII] sources, and to some extent with the IR sources. The elliptical ring–like structure can be clearly seen, with the nucleus close to the centre of the ring. On the other hand the radio sources do not show a good spatial correspondence to the ring sources and generally trace out a line in the SW–NE direction interior to the ring. In particular, the radio nucleus does not have a strong IR counterpart (e.g. Sams et al. 1994) and lies in an empty region of the [SIII] emission line ring.
3.3 X–ray Sources
The X-ray emission from NGC 253 has been studied previously. Fabbiano (1988) reported on EINSTEIN IPC observations, which revealed a number of point sources embedded in the disk of the galaxy, as well as extended superwind emission. Ginga observations, discussed by Ohashi et al. (1990) suggested that the bulk of the X–ray emission from NGC 253 is thermal (i.e. from a superwind or individual SNRs) and that other sources make only a small contribution.
Ptak et al. (1997) reported on ASCA observations of both M82 and NGC 253. The ASCA satellite has much poorer spatial resolution compared to the ROSAT observations presented here, but better spectral capabilities. Data for NGC 253 were extracted from a region of 6 radius. The spectra from this region was fitted with a two component model, with the soft component being thermal with keV and the harder component being either thermal with keV or a powerlaw with . Dahlem et al. (1998) studied NGC 253 along with six other edge–on starburst galaxies. Combining spectroscopy from ROSAT and ASCA they estimated the temperature for a soft and medium component to be and 0.72 keV respectively. The hard component had a similar powerlaw slope as found by Ptak et al. . BeppoSax observations of NGC 253, presented by Mariani et al. (1999), found that the harder spectral component was likely thermal and found evidence for line emission at 6.7 keV. Data from ROSAT observations of NGC 253 have been presented by Read et al. (1997) in their survey of X-ray emission from nearby spiral galaxies.
Read et al. (1997) found a total of 15 point sources within a radius of 15′ of the galaxy center, and that the diffuse emission comprises 74% of the total emission. The X–ray point sources seen in the ROSAT data have recently been analysed in detail by Vogler & Pietsch (1999). They catalogued a total of 73 X-ray point sources, 32 of which are associated with the galaxy disk (see also Pietsch 1992 for a preliminary analysis of the ROSAT data). Most, perhaps all, of these point sources are X–ray binaries. A similar conclusion was reached in the earlier study of Fabbiano & Trinchieri (1984) using the EINSTEIN satellite. For simplicity, we adopt the naming convention of Vogler & Pietsch (1999) for the point sources.
In this paper we are concerned with the inner 1 kpc region, contains a central source (labelled X34 in Vogler & Pietsch), a point–like source (X33), possibly a third source ( = 00h47m34.3s, = –25∘1750) and surrounding diffuse emission (see Fig. 3).
The two sources (X33 and X34) are separated by 27, which is comparable to the resolution of the PSPC but reasonably well separated by the HRI. Thus we are confident about obtaining accurate HRI–derived luminosities (given an assumed spectral shape) but attempts to obtain spectral fits of the two sources with the PSPC may be contaminated by emission from the other source, as well as diffuse emission.
Starting with the point source X33 in the HRI data, we assume the same spectral parameters as Fabbiano & Trinchieri (1984) and Vogler & Pietsch (1999), i.e. Galactic hydrogen column density of cm-2 and thermal bremsstrahlung spectrum of keV. We derive an emitted 0.2–4.0keV flux of erg cm-2 s-1 and corresponding luminosity of . This is in reasonable agreement with Vogler & Pietsch value for X33 of (when adjusted to our assumed distance). Based on its high luminosity, evidence for variability and possible hard spectrum (from the PSPC data), Vogler & Pietsch conclude that it is a black hole X–ray binary. A similar conclusion was reached by Fabbiano & Trinchieri (1984). We will not discuss this source further, and concentrate on the nuclear source and surrounding diffuse emission.
The nuclear X–ray source in the HRI image occurs at = 00h47m33.32s, = –25∘ 17 23.0 (J2000) with a pointing error of about . For the PSPC, it is at = 00h47m33.33s, = –25∘ 17 27.4 . The equivalent EINSTEIN source is located at = 00h47m 33.4s, = –25∘1723.0 . All three sources lie at the centre of more extended X–ray emission, and their positions agree within the uncertainties. They lie close to the position of the radio nucleus. We will therefore assume that they are the same source and that the peak of the X–ray emission is associated with the radio nucleus, i.e. = 00h47m 33.169s, = –25∘1717.06 (J2000).
The nuclear source has a FWHM size of about 10 and is clearly extended in the HRI image. This indicates that not all of the emission can be associated with an AGN. We estimate an emitted 0.2–4.0 keV flux from the nuclear source to be erg cm-2 s-1 for an internal extinction towards the nucleus of AV = 10m (Rieke et al. 1980). This gives a luminosity of . The ASCA observations described by Ptak et al. (1997, 1999) suggest a hard component with a luminosity of .
We note for comparison that the analysis of ROSAT PSPC data by Read et al. (1997) determined the following spectral properties for the central source, =3.0keV and cm-2 for a single temperature bremsstrahlung model. Note, that the PSPC data includes contributions from source X33 as well as the nuclear source X34.
4 Nature of the Discrete Sources
4.1 The Nucleus
As mentioned above, the nuclear radio source (known as TH2) has a flat radio spectrum and high brightness temperature. It has a compact ( 2pc) core (Sadler et al. 1995) and associated H2O maser emission (Nakai et al. 1995). These facts argue strongly for an AGN at the centre of the galaxy.
We estimate the intrinsic soft X–ray emission from the nuclear source to be 1040 erg s-1 assuming an extinction of AV = 10m (Rieke et al. 1980). Vogler & Pietsch (1999) estimate 1039 erg s-1 for an internal column density of cm-2, based on a spectral fit of the PSPC data. As mentioned earlier, such fits should be taken with caution as the bright X–ray binary to the South of the nuclear source contaminates the PSPC flux. Another reason to be skeptical of this result is that the column density implies an extinction of AV = 1.3m. If an AGN were responsible for the X–ray emission and hidden by only 1.3 mags of extinction, then we would expect to see evidence for a Seyfert nucleus in near–IR spectra (AK 0.13) which has not been observed. Indeed, from high resolution near–IR imaging, Sams et al. (1994) have suggested that the extinction towards the nucleus could be in excess of AV = 24m. In which case, even our estimate of the X–ray luminosity is severely underestimated.
The high X–ray luminosity, and spatial extent, effectively rules out an X–ray binary as the source of the X–ray emission. A single Galactic–like SNR is also ruled out. There is good evidence from the radio data for an AGN, however the extended X–ray emission implies that some of the X–rays are not from an AGN but perhaps from a small number of compact, extra–luminous SNRs or hot gas associated with starburst activity. The satellite Chandra, with its 0.5 spatial resolution, should settle this issue.
For comparison, we note that the X–ray luminous radio supernova SN 1988Z, has radio and X–ray properties that are broadly comparable to the nucleus of NGC 253. SN 1988Z was detected as an X–ray source with , at an epoch years after the SN event (Fabian & Terlevich 1996). It has also been studied at radio wavelengths, where it is a luminous (but fading) object (van Dyk et al. 1993). The overall spectral shape consists of a power–law with slope and varying free–free absorption. Another similar object is SN 1986J, which is again a radio and X–ray luminous object (Weiler et al. 1990, Houck et al. 1998).
The peculiar X–ray and radio characteristics of these objects have been interpreted as being due to the SN explosion occurring in a dense circumstellar environment, caused by an earlier phase of stellar evolution (e.g. dense winds) or location in a dense environment (e.g. molecular cloud or starburst region). The implied circumstellar densities in the case of SN 1988Z are cm-3 (Fabian & Terlevich 1996).
On the basis of the X–ray properties alone it is difficult to distinguish between an ultraluminous SN and an AGN for the nuclear emission, as sufficiently little is currently known about the X–ray spectral properties of objects like SN 1988Z and SN 1986J (Stevens, Strickland & Wills 1999). Although it is possible that an X–ray luminous SN could account for part of the extended emission, we consider it unlikely to be the main source of nuclear emission, as the flat radio spectrum of TH2 and the lack of X–ray variability argue against an ultraluminous SN at the core of NGC 253.
4.2 The Infrared Maximum
The brightest discrete source at [SIII]9532, IR and HCN wavelengths appear to be spatially coincident (indeed we have assumed this for the tables and figures). Pina et al. (1993) called this source IRS1, while Kalas & Wynn–Williams (1994) called it peak 1. We will refer to it as the IR maximum. It is located at = 00h47m33.006s, = –25∘1718.23 (J2000). It is the strongest Br source in the central region with a 2′′ aperture flux of 3.2 10-14 erg s-1 cm-2 (Forbes et al. 1993). This corresponds to 2 1051 ionising photons per sec, or about 1000 O stars, and suggests that the IR maximum is a powerful young star cluster of total mass 105 (for a normal IMF). From the H emission and a burst model, Watson et al. (1996) also favour a young ( 100 Myr old) star cluster. Our measurements of the [SIII] to H ratio for this source (see Table 3) are more consistent with photoionisation from young stars rather than SNR–produced shocks.
Assuming that the Br emission comes solely from HII regions, and an electron temperature of 104 K, then we would predict a thermal 2cm flux density of 3 mJy. If AV = 5 towards this source, then the expected flux rises to 5 mJy. The IR maximum does not appear to have an associated radio source of this strength, indicating a 2cm flux limit of 0.4 mJy. So although we favour the interpretation of a large cluster of young stars, it is curious that there is no strong radio emission from the associated HII regions. Paglione et al. (1995) inferred a density of 105 cm-3 towards this source which is even higher than that inferred for the nucleus. Perhaps this very high density gas can act to modify the Galactic (i.e. low density) relationship between ionising photons and thermal radio emission.
4.3 The Ring Region
The [SIII], H and IR sources resemble a ring–like structure surrounding the nucleus (see Fig. 4). It is about 50 pc in diameter. As shown by Sams et al. (1994) the appearance of discrete sources is largely due to the variable dust obscuration within this region. Nevertheless the presence of strong H and IR emission in a ring–like structure suggests that NGC 253 contains a 50 pc sized starburst ring (as it is difficult to imagine how dust would create the impression of a ring when it doesn’t exist).
This ring has also been seen in the form of a molecular torus (Israel, White & Bass 1995) with the IR maximum defining the SW edge. The velocity field around the ring is consistent with solid body rotation (Paglione et al. 1995). HI observations reveal evidence for a rapidly rotating ring of cold gas (Koribalski et al. 1995). The optical/IR ring appears to define the inner edge of a larger ( 500 pc sized) cold gas torus, which has a higher gas density than the outer parts of the torus (Israel et al. 1995). Arnaboldi et al. (1995) claim that NGC 253 has two inner Lindblad resonances, one at 300 pc (i.e. within the torus) and another at about 50 pc radius (i.e. the starburst ring).
As can be seen in Fig. 4 there is very little spatial correspondence between the optical/IR sources and the radio sources. A radio spectral index map does however show that the NW ridge of the ring (which has the most intense optical/IR sources) has a flat or even positive spectral index indicating that the radio emission is thermal in nature from HII regions. The fact that it is diffuse rather than in the form of compact sources suggests that either the HII regions have overlapped and expanded to fill a large area or perhaps the emission is being absorbed by high density gas (which may in turn be associated with the molecular torus). The Br emission is also strongest on the NW ridge of the ring, while the [FeII] emission traces SNRs on the SE ridge of the ring (Forbes et al. 1992). In other words the contribution of HII regions relative to SNRs is high on the NW side of the ring and low on the SE side of the ring. This may indicate a temporal evolution, with star formation starting on the SE side and progressing to the NW side of the ring.
Further support for the starburst interpretation of the ring sources comes from optical line ratios. In Fig. 5 we show the diagnostic diagram adapted from Kirhakos & Phillips (1989) which plots [SII]6716,6731/H vs [SIII]9069,9532/H. The [SII]6716,6731/H ratio, which is largely extinction independent, comes from the central region (60 pc) measurement of Schulz & Wegner (1992). This therefore represents an average over the central region which includes the ring structure. We have directly measured the [SIII]9532 and H fluxes for each discrete source from our WFPC2 images, and assuming a ratio of 9532/9069 = 2.5 (Osterbrock et al. 1990) we can estimate the dereddened ratio for AV = 5 and 10. We find that the discrete sources in the ring are consistent with the photoionisation models for OB stars and HII regions, rather than the shock models for SNRs.
In summary, NGC 253 contains an almost circular, starburst ring of diameter 50 pc which defines the inner edge of a 500 pc sized torus of cold gas. The discrete sources in the ring do not, in general, have associated compact radio sources. Their appearance at optical, and to some extent IR wavelengths, is no doubt affected by dust obscuration but this is unlikely to artificially create a ring–like structure. Gas rings, of pc to kpc sizes, have been seen in a number of ultraluminous starburst galaxies (Downes & Solomon 1998). This suggests that similar processes to those seen in NGC 253 are occurring in other distant galaxies but on a much grander scale.
4.4 The Region Exterior to the Ring
Outside of the starburst ring there is limited IR coverage in the literature, however there are additional HCN (Paglione et al. 1995), radio (Ulvestad & Antonucci 1997), [SIII] and H discrete sources. As can be seen in Fig. 6, most of these sources, and the radio sources interior to the ring (Fig. 4), are located in a SW–NE direction. The position angle of these sources is about 40o.
Recently, Peng et al. (1996) has provided an explanation for this alignment. They suggest that the gas orbits in the central 100 pc of NGC 253 are moving in a potential associated with the galaxy’s large scale bar which has a P.A. 70o (Forbes & DePoy 1992). At the inclination of NGC 253, these orbits have an apparent position angle on the sky which is similar to that observed. Gas tends to accumulate at the apocentres of these orbits leading to clumps of star formation.
4.5 Relationship to the Superwind
The bulk of the X–ray emission from NGC 253 is due to the outflowing superwind (Read et al. 1997). Its diffuse emission extends about 12 (9 kpc) from the galaxy disk (see Fig. 2). We find that the diffuse emission in the central 500 pc has a position angle of 140∘, i.e. the same as that on large scales and perpendicular to the galaxy disk. Thus the superwind emission extends from a few hundred parsecs to about ten thousand parsecs from the galaxy core. The central source size (i.e. 120 pc) is larger than the starburst ring but well within the HI torus. High resolution imaging by Chandra will confirm whether the torus is acting to collimate the outflowing superwind, and whether the bulk of its central emission originates from the starburst ring or the galaxy nucleus itself.
5 Summary and Future Work
By spatially aligning the discrete sources seen at various wavelengths, we have explored the nature of these sources in the central regions in NGC 253. We find that the optical, IR and mm sources trace out a nearly circular starburst ring of size 50 pc. There is some evidence for the star formation starting on the SE side of the ring. The brightest IR source in the central region lies in the SW side of the ring, and is probably a massive young star cluster. This ring defines the inner edge of a larger ( 500 pc) cold gas torus, which has probably been created by gas inflow from a larger scale bar and deposited at the inner Lindblad resonance. The interior of the ring contains most of the compact radio sources (which are mostly SNRs) and the radio nucleus itself. The radio nucleus is almost certainly a heavily obscured AGN, which is not visible at optical or IR wavelengths and contributes only some fraction of the X–ray emission from the central 10 (120 pc). The diffuse emission associated with the outflowing superwind is present in the central region, on a size scale consistent with the idea of collimation by the gas torus.
We have already mentioned that Chandra will be important in probing the true nature of the X–ray emission in the nuclear region. It will also be useful to search for new SN. From the Ulvestad & Antonucci (1997) list of radio sources, there are 4 spatially resolved SNRs. Their average size is 0.1 or 1.2 pc in diameter. A SNR expanding at a rate of 104 km s-1 will reach this size in about 60 yrs. Ulvestad & Antonucci have recalculated the SN rate in NGC 253 based on the fading of radio sources (i.e. no more than 2% yr-1) and the lack of new sources over an 8 year baseline. They conclude that the rate is about 0.1 SN yr-1 with an upper limit of 0.3 SN yr-1. Therefore extending the time baseline by a few more years should be a fruitful exercise. The increased sensitivity and spatial resolution of Chandra will be ideal to search for the X–ray emission from recent SN, particularly in the dusty circumnuclear region.
Acknowledgements
We thank B. Koribalski and the referee (T. Heckman) for some helpful comments, Support for this work was provided by NASA through grant number GO-06440.01-95A from the Space Telescope Science Institute, which is operated by the Association of Universities for Research in Astronomy, Inc., under NASA contract NAS5-26555.
References
- [1] Arnaboldi M., Capaccioli M., Cappellaro E., Held E.V., Koribalski B., 1995, AJ, 110, 199
- [2] Antonucci, R.R.J., Ulvestad, J.S., 1988, ApJ, 330, L97
- [3] Böker T., Krabbe A., Storey J.W.V., 1998, ApJ, 498, L115
- [4] Dahlem, M., Weaver, K.A., Heckman, T.M., 1998, ApJS, 118, 401
- [5] Downes D., Solomon P.M., 1998, ApJ, 507, 615
- [6] Fabbiano G., Trinchieri G., 1984, ApJ, 286, 491
- [7] Fabbiano G., 1988, ApJ, 330, 672
- [8] Fabian A.C., Terlevich R.J., 1996, MNRAS, 280, L5
- [9] Forbes D.A., DePoy D.L., 1992, A&A, 259, 97
- [10] Forbes D.A., Ward M.J., DePoy D.L., 1991, ApJ, 380, L63
- [11] Forbes D.A., Ward M.J., Rotaciuc V., Blietz M., Genzel R., Drapatz S., van der Werf, P.P., Krabbe, A., 1993, ApJ, 406, L11
- [12] Heckman T.M., Dahlem M., Lehnert M.D., Fabbiano G., Gilmore D., Waller W.H., 1995, ApJ, 448, 98
- [13] Holtzman J.A., Burrows C.J., Casertano S., Hester J.J., Trauger J.T., Watson A.M., Worthey G., 1995, PASP, 107, 1065
- [14] Houck J.C., Bregman J.N., Chevalier R.A., Tomisaka K., 1998, ApJ, 493, 431
- [15] Israel F.P., White G.J., Baas F., 1995, A&A, 302, 343
- [16] Kalas P., Wynn-Williams C.G., 1994, ApJ, 434, 546
- [17] Keto E., Ball R., Arens J., Jernigan G., Meixner M., 1993, ApJ, 413, L23
- [18] Kirhakos S., Phillips M.M., 1989, PASP, 101, 949
- [19] Koribalski B., Whiteoak J.B., Houghton, S., 1995, PASA, 12, 20
- [20] Mariani S., et al. 1999, (preprint)
- [21] Nakai, N., Inoue, M., Miyazawa, K., Miyoshi, M., Hall, P., 1995, PASJ, 47, 771
- [22] Ohashi T., Makishima K., Tsuru T., Takano S., Koyama K., Stewart G.C., 1990, ApJ, 365, 180
- [23] Osterbrock D.E., Shaw R.A., Veilleux S., 1990, ApJ, 352, 561
- [24] Paglione T.A.D., Tosaki T., Jackson J.M., 1995, ApJ, 454, L117
- [25] Peng R., Zhou S., Whiteoak J.B., Lo K.Y., Sutton E.C., 1996, ApJ, 470, 821
- [26] Pietsch W., 1992, in Thuan T.X., Blakowski C., Thanh Van J.T., eds, Physics of nearby Galaxies: Nature or Nurture ?, Editions Frontieres, Gif-sure-Yvette, p.76.
- [27] Piña R.K., Jones B., Puetter R.C., Stein W.A., 1992, ApJ, 401, L75
- [28] Ptak A., Serlemitsos P., Yaqoob T., Mushotzky R., Tsuru T., 1997, AJ, 113, 1286
- [29] Ptak A., Griffiths R.E., 1999, ApJ, 517, 85
- [30] Ptak A., Serlemitsos P., Yaqoob T., Mushotzky R., 1999, ApJS, 120, 179
- [31] Read A.M., Ponman T.J., Strickland D.K., 1997, MNRAS, 286, 626
- [32] Rieke, G.H., Lebofsky, M.J., Thompson, R.I., Low, F.J., Tokunaga, A.T., 1980, ApJ, 238, 24
- [33] Sadler, E.M., Slee, O.B., Reynolds, J.E., Roy, A.L., 1995, MNRAS, 276, 1373
- [34] Sams B.J., Genzel R., Eckart A., Tacconi-Garman L., Hofmann R., 1994, ApJ, 430, L33
- [35] Schultz H., Wegner G., 1992, A&A, 266, 167
- [36] Stevens, I.R., Strickland, D.K., Wills, K., 1998, MNRAS, submitted
- [37] Strickland D.K., Ponman T.J., Stevens I.R., 1997, A&A, 320, 378
- [38] Turner J.L., Ho P.T.P., 1985, ApJ, 299, L77
- [39] Ulvestad J.S., Antonucci R.R.J., 1991, AJ, 102, 875
- [40] Ulvestad J.S., Antonucci R.R.J., 1994, ApJ, 424, 29
- [41] Ulvestad J.S., Antonucci R.R.J., 1997, ApJ, 488, 621
- [42] Vogler A., Pietsch W., 1999, A&A, 342, 101
- [43] Van Dyk S.D., Weiler K.W., Sramek R.A., Panagia N., 1993, ApJ, 419, L69
- [44] Watson A., et al. 1996, AJ, 112, 534
- [45] Weiler K.W., Panagia N., Sramek R.A., 1990, ApJ, 364, 611
- [46] Wills K.A., Pedlar A., Muxlow T.W.B., Stevens I.R., 1999, MNRAS, (in press)
Table 1.ROSAT observations of NGC 253.
| Instrument | Exposure (ks) | ROR # | P.I. | Start date |
|---|---|---|---|---|
| PSPC | 11.6 | rp600087a00 | Pietsch | 1991.359 |
| PSPC | 11.2 | rp600087a01 | Pietsch | 1992.155 |
| HRI | 25.7 | rh600088a01 | Pietsch | 1992.157 |
| HRI | 11.0 | rh600714n00 | Pietsch | 1995.003 |
| HRI | 19.8 | rh600714a01 | Pietsch | 1995.164 |
Notes: Columns list the ROSAT instrument, exposure time, ROSAT filename,
principal investigator and observing start date.
Table 2. Optical Sources.
| Position (J2000) | Offset from | [SIII]9532 flux | H flux | Log([SIII]/H) |
|---|---|---|---|---|
| =00h47m =–25∘17 | Nucleus | 10-15 | 10-15 | AV=10 AV=5 |
| (arcsec) | (erg cm-2s-1) | (erg cm-2s-1) | ||
| 33.01s 18.2 | –2.21, –1.17 | 27.1 | 1.5 | 0.5 1.0 |
| 33.02s 18.8 | –1.98, –1.70 | 10.5 | 4.5 | –0.4 0.1 |
| 33.06s 17.1 | –1.54, –0.03 | 4.6 | 1.1 | –0.1 0.3 |
| 33.08s 17.0 | –1.26, +0.13 | 4.0 | 1.0 | –0.1 0.3 |
| 33.10s 16.7 | –0.91, +0.40 | 4.4 | 0.4 | 0.4 0.8 |
| 33.11s 16.1 | –0.83, +0.94 | 4.2 | 0.3 | 0.4 0.9 |
| 33.14s 18.1 | –0.38, –1.06 | 3.3 | 0.8 | –0.1 0.3 |
| 33.18s 18.0 | +0.15, –0.98 | 2.5 | 0.5 | 0.0 0.4 |
| 33.19s 16.2 | +0.22, +0.97 | 3.1 | 1.4 | –0.4 0.1 |
| 33.24s 17.0 | +1.00, +0.15 | 2.8 | 0.9 | –0.2 0.2 |
| 33.24s 16.5 | +1.06, +0.71 | 4.4 | 1.8 | –0.3 0.1 |
| 33.27s 14.2 | +1.42, +2.91 | 2.2 | 1.0 | –0.4 0.1 |
| 33.45s 12.7 | +3.81, +4.47 | 6.8 | 0.8 | 0.2 0.7 |
| 33.83s 10.7 | +8.90, +6.38 | 1.4 | 0.3 | –0.1 0.4 |
| 34.08s 08.5 | +12.47, +8.72 | 1.9 | 0.3 | 0.1 0.6 |
Notes: Positions of the discrete sources have been shifted so that the
brightest [SIII]9532 source lies at = 00h47m33.006s,
= –25∘1718.23 (J2000).
Offset is the position of the discrete source relative to the radio
nucleus, ie =00h47m33.169s,
=–25∘1717.06 (J2000).
The [SIII]9532 and H fluxes are taken from a
0.4 diameter aperture centred on the discrete source maximum.
The [SIII]9069,9532/H ratio is calculated from [SIII]9532/H using the relation,
9532/9069 = 2.5 (Osterbrock et al. 1990) and dereddened for
extinctions of AV=10 and AV=5. Sources within the ring
are listed first, and then 4 sources that lie beyond the ring.
Table 3. Infrared/mm Sources.
| Position (J2000) | Offset | Wavelength | Reference |
| =00h47m =–25∘17 | (arcsec) | ||
| 32.901s 19.24 | –3.623, –2.18 | 1.65 m | 1 |
| 33.006s 18.23 | –2.214, –1.17 | 1.65 m | 1 |
| 33.062s 17.13 | –1.456, 0.00 | 1.65 m | 1 |
| 33.161s 18.05 | –0.104, –0.99 | 1.65 m | 1 |
| 33.241s 16.40 | +0.981, +0.66 | 1.65 m | 1 |
| 33.006s 18.23 | –2.214, –1.17 | 8.5 - 12.5 m | 2 |
| 33.185s 16.53 | +0.223, +0.53 | 8.5 - 12.5 m | 2 |
| 33.006s 18.23 | –2.214, –1.17 | 10 - 20 m | 3 |
| 33.116s 16.63 | –0.724, +0.43 | 10 - 20 m | 3 |
| 33.006s 18.23 | –2.214, –1.17 | 1.6 - 4.8 m | 4 |
| 33.156s 16.39 | –0.183, +0.67 | 4.8 m | 4 |
| 33.228s 16.51 | +0.805, +0.55 | 1.6 - 3.38 m | 4 |
| 33.450s 12.79 | +3.813, +4.27 | 1.6 - 4.8 m | 4 |
| 33.829s 10.74 | +8.957, +6.32 | 1.6 - 3.38 m | 4 |
| 32.283s 16.82 | –12.010, +0.24 | HCN J=1 0 | 5 |
| 33.006s 18.23 | –2.214, –1.17 | HCN J=1 0 | 5 |
| 33.162s 15.43 | –0.100, +1.63 | HCN J=1 0 | 5 |
| 33.316s 14.73 | +1.998, +2.33 | HCN J=1 0 | 5 |
| 33.368s 13.33 | +2.703, +3.73 | HCN J=1 0 | 5 |
| 33.626s 11.94 | +6.196, +5.12 | HCN J=1 0 | 5 |
| 33.781s 11.24 | +8.294, +5.82 | HCN J=1 0 | 5 |
| 34.091s 10.54 | +12.503, +6.52 | HCN J=1 0 | 5 |
Notes: Positions of the discrete sources have been shifted so that the brightest IR and mm sources lie at = 00h47m33.006s, = –25∘1718.23 (J2000). Offsets are measured relative to the radio nucleus, ie = 00h47m33.169s, = –25∘1717.06 (J2000). The references for the IR and mm observations are: (1) = Forbes, Ward & DePoy 1991; (2) = Keto et al. 1993; (3) = Piña et al. 1992; (4) = Kalas & Wynn-Williams 1994; (5) = Paglione et al. 1995.
Table 4. Radio Sources.
| Position (J2000) | Offset | Flux | Luminosity | Spectral Index | TH |
|---|---|---|---|---|---|
| =00h47m =–25∘17 | (arcsec) | (mJy) | (1035 erg s-1) | Source | |
| 32.865s 21.29 | –4.123, –4.23 | 15.72 | 17.63 | –0.690.06 | TH9 |
| 32.922s 20.20 | –3.350, –3.14 | 4.44 | 4.98 | +0.170.10 | |
| 32.974s 19.64 | –2.645, –2.58 | 4.09 | 4.59 | ||
| 33.001s 19.34 | –2.278, –2.28 | 5.14 | 5.76 | –0.240.07 | TH7 |
| 33.039s 18.75 | –1.763, –1.69 | 0.96 | 1.08 | ||
| 33.104s 18.08 | –0.882, –1.02 | 7.82 | 8.77 | +0.010.07 | TH6 |
| 33.105s 17.55 | –0.868, –0.49 | 3.39 | 3.80 | ||
| 33.129s 19.85 | –0.542, –2.79 | 3.51 | 3.94 | –0.710.09 | |
| 33.139s 17.68 | –0.407, –0.62 | 1.80 | 2.02 | TH5 | |
| 33.157s 17.39 | –0.163, –0.33 | 13.08 | 14.67 | TH4 | |
| 33.165s 17.77 | –0.054, –0.71 | 4.05 | 4.54 | TH3 | |
| 33.169s 17.06 | 0.000, 0.00 | 37.14 | 41.64 | +0.040.06 | TH2 |
| 33.173s 19.05 | +0.149, +0.20 | 1.49 | 1.67 | –0.790.12 | |
| 33.180s 16.86 | +0.054, –1.99 | 2.99 | 3.35 | ||
| 33.284s 15.47 | +1.560, +1.59 | 5.59 | 6.27 | +0.350.08 | TH1 |
| 33.375s 15.01 | +2.794, +2.05 | 1.91 | 2.14 | –0.780.10 |
Notes: The table lists radio sources with 2cm luminosity 1035 erg s-1 (from Ulvestad & Antonucci 1997). Offset is from the radio nucleus, ie = 00h47m33.169s, = –25∘1717.06 (J2000). The spectral index is from 6 to 2cm. The TH source is the identification number from Turner & Ho (1985).