Evidence for Asphericity in the Type IIn Supernova 1998S
Abstract
We present optical spectropolarimetry obtained at the Keck-II 10-m telescope on 1998 March 7 UT along with total flux spectra spanning the first 494 days after discovery (1998 March 2 UT) of the peculiar type IIn supernova (SN) 1998S. The SN is found to exhibit a high degree of linear polarization, implying significant asphericity for its continuum-scattering environment. Prior to removal of the interstellar polarization, the polarization spectrum is characterized by a flat continuum (at ) with distinct changes in polarization associated with both the broad (symmetric, half width near zero intensity km s-1) and narrow (unresolved, full width at half maximum km s-1) line emission seen in the total flux spectrum. When analyzed in terms of a polarized continuum with unpolarized broad-line recombination emission, an intrinsic continuum polarization of results, suggesting a global asphericity of from the oblate, electron-scattering dominated models of Höflich (1991). The smooth, blue continuum evident at early times is shown to be inconsistent with a reddened, single-temperature blackbody, instead having a color temperature that increases with decreasing wavelength. Broad emission-line profiles with distinct blue and red peaks are seen in the total flux spectra at later times, suggesting a disk-like or ring-like morphology for the dense () circumstellar medium, generically similar to what is seen directly in SN 1987A, although much denser and closer to the progenitor in SN 1998S. Implications of the circumstellar scattering environment for the spectropolarimetry are discussed, as are the effects of uncertainty in the removal of interstellar polarization; the importance of obtaining multiple spectropolarimetric epochs to help constrain the interstellar polarization value is particularly stressed. Using information derived from the spectropolarimetry and the total flux spectra, an evolutionary scenario for SN 1998S and its progenitor are presented.
1 INTRODUCTION
Since extragalactic supernovae (SNe) are unresolvable during the very early phases of their evolution, explosion geometry has been a difficult question to approach observationally. Traditionally assumed to be spherically symmetric (for recent asymmetric models, see Burrows, Hayes, & Fryxell 1995 and Höflich, Wheeler, & Wang 1999), several pieces of indirect evidence have begun to cast doubt on this fundamental assumption of supernova (SN) theory. Long after the explosion, evidence for asymmetry abounds, coming most persuasively from the Galactic distribution (Lyne 1998) and high velocities (up to 1600 km s-1; c.f., Cordes & Chernoff 1998) of pulsars, the compact remnants of massive stars that have exploded. As first pointed out by Shapiro & Sutherland (1982), polarimetry of a young SN is a powerful tool for probing its geometry. The idea is simple: A hot young SN atmosphere is dominated by electron scattering, which by its nature is highly polarizing. Indeed, if we could resolve such an atmosphere, we would measure changes in both the position angle (PA) and strength of the polarization as a function of position in the atmosphere (e.g., Rybicki & Lightman 1979, p. 104). For a spherical source which is unresolved, however, the directional components of the electric vectors cancel exactly, yielding zero net linear polarization. If the source is aspherical, incomplete cancellation occurs; the resulting degree of net linear polarization varies with the amount of asphericity, as well as with the viewing angle and the extension and density of the electron-scattering atmosphere.
The most recent, general study of the polarization expected from an aspherical SN atmosphere is that of Höflich (1991), in which the continuum polarization resulting from an axially symmetric (either oblate or prolate), electron-scattering dominated photosphere is calculated as a function of the photosphere’s geometry and size relative to the envelope, the scattering atmosphere’s optical depth and density profile, and the axial ratio of the envelope. Of particular interest is the lower bound placed on the asphericity implied by polarization measurements: By fixing all other parameters to maximize the resulting polarization (i.e., scattering optical depth = 1, continuum region physically small compared with envelope, object viewed equator-on), the maximum polarization as a function of axis ratio is produced (Höflich 1991, his Fig. 4), with polarizations ranging from 0% (spherical) to over 4% (axial ratio ). Determination of intrinsic SN continuum polarization thus leads to a lower limit on the implied asphericity of the scattering atmosphere from this model.
Previous SN polarization studies have indicated significant intrinsic polarization () for core-collapse events, and small or zero polarization for SNe Ia (Wang et al. 1996; Wang, Wheeler, & Höflich 1997). However, due to the difficulty of obtaining the requisite signal with even 4-m class telescopes, most of the published results do not resolve specific line features, which potentially contain a wealth of information about the geometry and nature of the scattering environment. [Notable exceptions are SN 1993J (Trammell, Hines, & Wheeler 1993; Tran et al. 1997) and SN 1987A (see Jeffery 1991a and references therein).] With the larger aperture telescopes now (or soon to be) available (e.g., Keck, VLT), prospects for improving the situation are good. We thus began a program to obtain spectropolarimetry of nearby SNe at the Keck Observatory, and here report results from a spectropolarimetric observation of the unusual core-collapse object, SN 1998S.
Classified as type IIn, SN 1998S joins the growing number of SNe whose distinguishing observational characteristic is strong, often multi-component emission lines lacking the broad P-Cygni absorption features typical of “normal” SNe II (Schlegel 1990; Filippenko 1991; see Filippenko 1997 for a review). While the simple model of a red supergiant exploding into a near-vacuum [inferred progenitor mass-loss (Chugai 1994)] sufficiently explains the early-time spectrum of most core-collapse SNe, spectra of young IIn events suggest intense interaction between the ejecta and a dense circumstellar medium (CSM). Although details vary among objects, a physical picture is emerging in which the progenitor star undergoes significant mass-loss, perhaps occurring in several episodes with as high as (Chugai 1997a; Benetti et al. 1999), sometimes lasting right up to the time of explosion. The expanding ejecta then interact with this CSM, producing the line radiation which dominates the optical spectrum (see Chugai 1997b for a review).
In addition to the geometric information revealed by spectropolarimetry, total flux spectra can lend further insight into the nature of the progenitor star’s CSM, which in turn reveals the mass-loss history of massive stars in their last stages of evolution: Do they blow off a spherical wind or one characterized by an asymmetric morphology? Recent, detailed images of red supergiant stars (Monnier et al. 1999) and planetary nebulae (Sahai & Trauger 1998) suggest that asymmetric (though possibly axisymmetric) mass-loss in the late stages of stellar evolution is quite common. In fact, it is difficult to find any observational evidence supporting spherically symmetric mass-loss; instead, a decidedly non-spherical, often bipolar morphology is deduced (see, e.g., Soker 1999a). If such late-time asymmetric mass-loss occurs in even more evolved massive stars, then it follows that the immediate CSM of some core-collapse SNe may be distinctly non-spherical, a situation whose spectral and spectropolarimetric consequences are investigated in this paper.
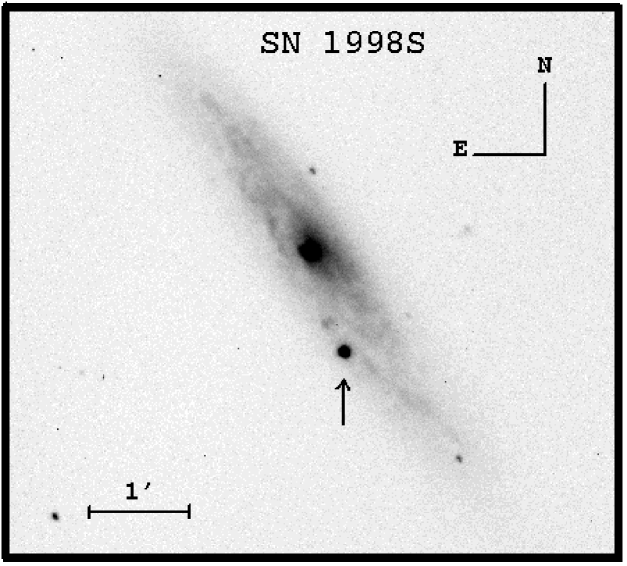
Located in the Sc galaxy NGC 3877 (Fig. 1), SN 1998S was discovered on 1998 March 2.68 UT by Z. Wan during the Beijing Astronomical Observatory Supernova Survey (Li et al. 1998; Qiu et al. 1998b; note that UT dates are used throughout this paper). At the time, it had an unfiltered magnitude mag, but on about March 20 it reached a peak visual magnitude of mag and mag (c.f., Granslo et al. 1998; Garnavich et al. 1998c). This made it the second brightest SN of the year, eclipsed only by SN 1998bu (c.f., Suntzeff et al. 1999; Jha et al. 1999). At an estimated distance of 17 Mpc (Tully 1988), SN 1998S thus reached mag (uncorrected for extinction), making it one of the most intrinsically luminous type II events (c.f., Patat et al. 1993). Since it was discovered roughly 18 days before maximum brightness and a pre-discovery frame exists on 1998 February 23.7 in which no SN is apparent down to a limiting unfiltered magnitude of mag (Li, private communication 1999), it is likely that SN 1998S was discovered within a few days of shock breakout.
As spectra were taken, SN 1998S quickly established itself as a peculiar variant of the already heterogeneous SN IIn subclass: In addition to smooth, symmetric lines of hydrogen and helium superposed on a blue continuum (Filippenko & Moran 1998), strong N III, C II, C III, and C IV emission was seen (Garnavich et al. 1998b), reminiscent of the “Wolf-Rayet” features also observed in SN 1983K early in its evolution (c.f., Niemela, Ruiz, & Phillips 1985). Interestingly, SN 1983K was similarly luminous, reaching mag at maximum (Patat et al. 1993). Our spectropolarimetric observation of SN 1998S, taken just five days after discovery, displayed a smooth, well-defined continuum with distinct line features, making interpretation more straightforward than for objects observed at later times.
This paper presents the early-time spectropolarimetric observation of SN 1998S along with total flux spectra sampling the first 494 days after discovery. We discuss the observations and reduction techniques in §2 and estimate the reddening to SN 1998S in §3.1. Its unusual spectral evolution is then presented in a series of total flux spectra (§3.2), with particular attention given to its early development. By comparing the early-time continuum shape with reddened blackbodies, we find an excess flux beyond a blackbody continuum at blue wavelengths. The spectropolarimetric observation is analyzed in §3.3, where we attempt to remove the interstellar polarization (ISP) from the total polarization data using three methods: First, an upper limit for the ISP is set by reddening considerations; next, an ISP value is derived by assuming the model of a polarized continuum with unpolarized broad lines; finally, a different ISP is derived by adopting a similar model but with assumed unpolarized narrow lines. The relative merits of the different models are then discussed in §4, along with a reexamination of the blue flux excess viewed in light of our preferred polarization model. By combining information derived from the spectropolarimetry and total flux spectra, we conclude by presenting a possible evolutionary scenario for the 1998S system.
2 OBSERVATIONS AND REDUCTIONS
SN 1998S was observed with the Low Resolution Imaging Spectrometer (LRIS; Oke et al. 1995) in polarimetry mode (LRIS-P; Cohen 1996) at the Cassegrain focus of the W. M. Keck-II 10-m telescope on 1998 March 7. Total flux spectra were obtained at Keck using LRIS on 1998 March 5, 6, & 27 and 1999 January 6, and at the Lick Observatory using the Kast double spectrograph (Miller & Stone 1993) at the Cassegrain focus of the Shane 3-m reflector in 1998 on June 18, July 17 & 23, and November 25 and in 1999 on January 10, March 12, and July 7. A journal of observations is given in Table 1.
One-dimensional sky-subtracted spectra were extracted optimally (Horne 1986) in the usual manner, generally with a width of 4′′ along the slit. Each spectrum was then wavelength and flux-calibrated, corrected for continuum atmospheric extinction and telluric absorption bands (Wade & Horne 1988), and rebinned to 2 Å pixel-1. Polarimetric analysis was performed according to the methods outlined by Miller, Robinson, & Goodrich (1988) and Cohen et al. (1997). Observations of unpolarized standard stars on the polarimetry night showed a flat, well-behaved polarization response over the observed wavelength range, and observations of polarized standard stars yielded values which agreed well with the polarizations catalogued by Turnshek et al. (1990).
3 RESULTS AND ANALYSIS
3.1 The Reddening to SN 1998S
Since reddening affects interpretation of spectropolarimetric data as well as relative line fluxes, we consider it first. Determining the reddening to SN 1998S was difficult since we could not rely on empirical knowledge of the intrinsic color of similar objects to guide us, as is often done for more normal type II and Ia events (e.g., Schmidt, Kirshner, & Eastman 1992; Riess, Press, & Kirshner 1996). Rather, we resorted to more indirect methods.
First, the reddening due to dust in the Milky Way (MW) was taken from the dust maps of Schlegel, Finkbeiner, & Davis (1998). Since SN 1998S is located far out of the Galactic plane (), this contribution was predictably small: (). Next, the reddening contribution from the host galaxy was estimated from the rough empirical correlations that have been derived between the equivalent width of interstellar Na I D absorption and reddening along the lines of sight to SNe (Barbon et al. 1990) and Galactic stars (Richmond et al. 1994; Munari & Zwitter 1997). From our day 25 (after discovery) total flux spectrum, which has both the best spectral resolution and the least contamination from He I emission, we measured Å and Å, yielding the values ()host = 0.20 (c.f., Barbon et al. 1990), 0.19 and 0.18 (c.f., Richmond et al. 1994), and 0.23 (c.f., Munari & Zwitter 1997). When added to the MW component, these values suggest (). Since we are most interested in placing an upper limit on the reddening in the spectropolarimetric analysis (§3.3.2), however, the fact that these relations have recently been shown to significantly underestimate the reddening to some SNe Ia, whose reddening is independently estimated from the SN color, makes us treat the range of values with some skepticism (c.f., Suntzeff et al. 1999). Nevertheless, lacking other independent estimates we will take () as the reddening value, and cautiously allow 0.25 to serve as the upper bound.
3.2 Spectra of SN 1998S
3.2.1 Early-Time Spectra
The spectral development of SN 1998S from days three to five after discovery is shown in Figure 2, along with probable line identifications (c.f., Garnavich et al. 1998b). Measured quantities at all spectral epochs are given in Table 2. The prominent early-time line features closely resemble those of SN 1983K: Broad emission lines of the hydrogen Balmer series, He II , and C III/N III superposed on a smooth, blue continuum (c.f., Niemela et al. 1985). Broad features identified with He I , He II , C II , C III , and C IV are also seen; the high-ionization carbon and nitrogen lines are features commonly observed in spectra of Wolf-Rayet stars. The line profile of H is best modeled by a two-component system, consisting of an unresolved [full width at half maximum (FWHM) km s-1] narrow line centered on a broad [full width near zero intensity (FWZI) km s-1], modified Lorentzian base (see Fig. 3). In addition, narrow, unresolved lines of [O III] , He I , and He II are present. The strength of the broad features steadily decreased over the three observations, with the equivalent width of H dropping from 64 Å to 43 Å during the two-day interval.
These early emission features likely result from two distinct regions of interaction between the expanding SN and its surrounding CSM: Narrow lines from photoionized material in a region of undisturbed CSM exterior to the SN, and broad lines from shocked or photoionized ejecta (e.g., Chugai & Danziger 1994; see also Chevalier & Fransson 1994), or perhaps overlying stellar wind material surrounding the expanding ejecta, a possibility considered for SN 1983K (Niemela et al. 1985; see also Grasberg 1993). The inferred density of the CSM is very high, with narrow [O III] ()/ (average of rough values from the spectra obtained on days 4 and 5), implying densities of (all information on the density of the CSM presented in this paper was obtained using the Space Telescope Science Data Analysis System software package of IRAF111IRAF is maintained and distributed by the Association of Universities for Research in Astronomy, under a cooperative agreement with the National Science Foundation.) for temperatures in the reasonable range K. Including a correction for reddening of () = 0.23 changes this ratio slightly, to , suggesting even higher densities.
While considerable theoretical effort has gone into modeling the emission lines seen in SNe IIn, the mechanism responsible for the continuum remains largely uncertain: Is it produced by an expanding, thermal photosphere interior to a line-forming region, or is some other mechanism operating? At very early times, the main continuum opacity source at optical wavelengths in “normal” SN atmospheres is thought to be electron scattering, which is independent of wavelength (e.g., Eastman et al. 1994). Since line blanketing from metals should not significantly alter the flux distribution at early epochs, we might expect a young SN continuum to closely approximate a Planckian energy distribution. In the only previous detailed study of early-time type II continuum shape, Clocchiatti et al. (1995) indeed found good agreement between a cooling, reddened, blackbody, and spectra sampling the first 6 days after shock breakout of SN 1993J, a “type IIb” event (c.f., Woosley et al. 1987; Filippenko 1997). For SNe IIn, comparisons have found early-time spectra to be roughly consistent with a blackbody (e.g., Niemela et al. 1985; Stathakis & Sadler 1991; Benetti et al. 1999), although “bluer than normal” continua have sometimes been noted (Schlegel 1990; Filippenko 1997). A detailed comparison, however, has not been done. Since the shape and relative flux of the strong continuum for our early spectra should be very accurate and galaxy subtraction errors minimal (the galaxy background was only a few percent of the SN’s brightness over the spectral range covered, and less than 1% at Å), we have an excellent opportunity to investigate this question.
The continuum grew steadily redder over the two-day interval spanned by the three spectral epochs, suggesting a cooling source. To see whether it could be modeled by a blackbody, we first assumed () = 0.23 (§3.1) and (Savage & Mathis 1979), and fit for the best photospheric temperature, using the reddening law of Cardelli, Clayton, & Mathis (1989) with the O’Donnell (1994) modification at blue wavelengths. We assumed a pure emission-line spectrum, and discarded fits that rose more than 2% (the estimated upper bound to the uncertainty in continuum placement) above the continuum at any point. Due to its large spectral range, we focused our analysis on the day four spectrum. One difficulty is that the region Å is filled with overlapping line features, making the placement of the continuum there quite uncertain. Thus, we first fit to the region Å, defining our continuum in “line-free” regions (i.e., more than 10,000 km s-1 away from known broad features) and connecting adjacent regions with a smooth spline. When this was done, the best fit for () and was found at K (line (a) in Fig. 2), a photospheric temperature which is quite high for a SN II more than four days after shock breakout; at a similar epoch, SN 1993J was found to be at only K (Clocchiatti et al. 1995; for theoretical models producing similarly low photospheric temperatures in SNe II see Eastman et al. 1994; Grasberg & Nadezhin 1991; Woosley et al. 1994).
Even at such a high temperature, though, the blackbody flux seems unable to match the likely continuum flux at blue wavelengths. One obvious solution to consider is that the overlapping emission lines provide the false impression of a rising blue continuum. When the model continuum is subtracted from the spectrum (Fig. 4a), however, the inadequacy of the fit becomes obvious; indeed, attempts to reproduce the continuum-subtracted region Å Å with line profiles modeled by the H line were quite unsuccessful. Spectropolarimetric evidence will also be shown to argue against this explanation (§4.2). Before concluding that the continuum is not intrinsically Planckian (or, at least, possesses a significant non-blackbody component or modification of its blackbody spectrum), though, we must consider the possibility that our estimates for either the reddening, the extinction law, or both are incorrect.
When we allowed the reddening to vary freely in our fits (keeping ), we found no significant improvement, even when attempting photospheric temperatures as high as K. When we let vary, keeping () = 0.23, better fits were found for , but required K. Similarly good fits were obtained at lower photospheric temperatures by allowing () to vary as well: For K, good fits exist for with ; an example is shown as line (b) in Figure 2, with the continuum-subtracted flux shown in Figure 4b. We note that such an unusual extinction law would not be wholly unexpected: In the MW, values as high as have been seen along lines of sight to dense molecular clouds (e.g., the Orion Nebula; Cardelli et al. 1989), a likely star-forming environment for a type II SN. A reddening different than would also not be surprising, given the uncertainty in the method used to derive that value.
We are thus faced with the conclusion that a single-temperature blackbody cannot explain the early-time continuum seen in SN 1998S unless a high continuum temperature and a non-standard extinction law are invoked. Since a non-standard extinction law has spectropolarimetric consequences, we will return to this discussion on the early-time continuum shape in §4.2, after the spectropolarimetric analysis is complete.
3.2.2 Later-Time Spectra
Within a week after our day five observation the broad emission lines had nearly disappeared (Qiu et al. 1998a), similar to the behavior of SN 1983K (Niemela et al. 1985). Certainly by day 25, SN 1998S had entered a new phase of spectral evolution, one no longer dominated by the symmetric emission features so evident at early times (Fig. 5). Rather, the optical spectrum displayed very weak emission with broad (FWHM km s-1) and narrow (FWHM km s-1) P-Cygni absorption. The velocity implied by the minima of the broad absorption troughs of hydrogen (H, H, H), helium (He I ), iron (Fe II ) and, more tentatively, silicon (Si II ; c.f., Garnavich et al. 1998b), scandium (Sc II ), and oxygen (O I ) all yield values between 4000 and 5000 km s-1. We note that some of the spectral features seen in the 25 d spectrum, most notably the strong Si II () and O I () absorption and weak H emission, resemble early-time features of SNe Ic (e.g., SN 1987M, SN 1990aa, SN 1991A; c.f., Filippenko 1992), suggesting hydrogen-deficient expanding ejecta. The presence of external illumination of the line-forming region by light from circumstellar interaction might also be contributing to the low contrast of the lines relative to the continuum (c.f., Branch et al. 1999). The highest velocity gas, inferred from the blue edge of the broad absorption troughs in H and Si II , is at km s-1. The narrow absorption features found in the Balmer hydrogen series and He I () lines all indicate a blueshifted velocity of km s-1 from the rest wavelength, although blending from the associated narrow emission components (centered on the rest wavelengths; c.f., Fig. 7) probably makes these troughs appear more blueshifted than they would be in the absence of emission-line contamination. From day 108 onwards, strong, broad (FWZI km s-1 for H), asymmetric emission lines dominate the spectrum (Fig. 6). The extraordinary development of the H profile is shown in Figure 7. A distinct blue peak at about km s-1, evident as early as day 108, comes to dominate the profile by day 268; by day 312, a decidedly double (or even triple) peaked profile has developed, with the blue peak continuing to increase relative to the red. A similar profile is seen in H as well.
High density of the CSM continues to be implied at these later times, with narrow [O III] ()/ (average of values from days 140, 312, and 375; including a correction for reddening of () changes this ratio to ), suggesting a density of for a likely temperature of 10,000 K (c.f., Terlevich et al. 1992; Chugai 1991), consistent with the density derived from earlier epochs. Further evidence for high density comes from the H/H ratio ( in the day 312, day 375, and day 494 spectra), and the appearance of O I , most evident in the day 312 and day 375 spectra, though probably blended with Ca II in the earlier spectra. The existence of this O I line and the absence of the typically stronger O I line suggest that it is produced by Ly pumping, implying material optically thick in H (Grandi 1980).
Overall, the general characteristics of these spectra suggest a complex interaction between the SN ejecta and its immediate circumstellar environment. The emission-dominated early-time and later-time spectra most certainly result from interaction between the ejecta and dense CSM, with the reported infrared color excess (Garnavich et al. 1998a) and detection of a CO overabundance in infrared spectra (Gerardy et al. 1998) likely heralding the formation of dust in the ejecta. The increasing strength of the blue side of the line profiles relative to the red (seen in both H and H in Fig. 7; see also Table 2) is also consistent with dust formation, since red photons, produced on the far, receding side of the expanding ejecta, would suffer more extinction from dust than blue ones due to their greater path length through the dusty ejecta. We will return to the geometry and evolution of the 1998S system (§4.3) after the implications of the early-time spectropolarimetric observation have been discussed.
3.3 Spectropolarimetry of SN 1998S
3.3.1 Total Polarization
The polarization data obtained for SN 1998S on 1998 March 7, five days after discovery, are shown in Figure 8. A few things are readily apparent: (1) the continuum polarization is roughly constant across the spectrum, at ; (2) decreases in the polarization are seen at the location of emission features in the flux spectrum; (3) the polarization change across all of the broad lines occurs mainly in the direction, thus forming straight line-segments which all point in the same general direction in the - plane (see Fig. 9); and (4) sharp polarization features distinct from the broad lines are seen in the narrow, unresolved cores of some of the strongest lines (most notably H, but also evident in H, He I , and He II ). Although most easily observed in the direction (since the broad component contributes little there), the narrow features exist in as well (most easily seen in the He I line since there was little, if any, broad-line emission). Such narrow features have not previously been detected in SN polarization studies, and multiple extractions using both the standard and optimal algorithms with different “object” and “sky” regions show that they are real, and not an artifact of a particular extraction choice. Careful examination of the two-dimensional data frames also revealed no significant H II region emission extending beyond the spatial extent of the SN, and the small possibility that the effect is due to contamination of the SN light by foreground H II region light directly along the line of sight to the SN is doubtful, since the effect exists in the He II narrow line, an unlikely species for H II region light.
Taken at face value, the continuum polarization of implies an asphericity of for the continuum scattering atmosphere of SN 1998S (c.f., Höflich 1991). Before interpreting the results further, however, we must grapple with that elusive gremlin of polarimetric data, the ISP.
3.3.2 Setting Limits on the ISP
A problem which plagues interpretation of all SN polarization measurements is proper removal of the ISP: Aspherical dust grains preferentially aligned with the magnetic field of either the host or MW galaxy can contribute a polarization signal which dwarfs that of the SN. Fortunately, the ISP of the MW has been well studied and shown to be a smoothly varying function of wavelength, and constant with time (e.g., Serkowski, Mathewson, & Ford 1975; Whittet & van Breda 1978). If similar ISP characteristics are present in other galaxies (c.f., Jones 1989; Scarrott, Rolph, & Semple 1990) then intrinsic SN polarization is implied by any of the following: (1) temporal changes in overall polarization level (requires multi-epoch observations); (2) distinct spectral polarization features (requires good resolution spectropolarimetry); or (3) continuum polarization characteristics clearly different from the known form produced by interstellar dust (i.e., the “Serkowski Law”; Serkowski 1973; Wilking, Lebofsky, & Rieke 1982). Relying on these criteria, we find clear evidence for polarization intrinsic to SN 1998S since it definitely satisfies criterion 2, and probably 3 as well. To progress further along quantitative lines, we now attempt to disentangle the SN polarization from that contributed by ISP.
Unfortunately, while subtracting the polarization in - space of a Galactic star along the line of sight can help remove Galactic ISP (e.g., Tran 1995), there is no similarly straightforward way to remove host galaxy contamination, an especially problematic situation for core-collapse objects which are frequently embedded in dusty regions. We can, however, place rough upper limits on the ISP, and interpret our results in terms of these limits. The essential idea is that our estimated reddening limit can be translated into a maximum ISP through the empirical formula () determined from observations of MW stars (Serkowski et al. 1975). If we assume this relation holds for all galaxies (c.f., Jones, Klebe, & Dickey 1992), then our limiting reddening value of () leads directly to . Note that the majority of this limiting value comes from the host galaxy, consistent with polarization measurements of Galactic stars near the line of sight to SN 1998S: Of the nine stars within 10∘ of SN 1998S contained in the catalogue by Mathewson et al. (1978), all have , although only one (HD98839, ) lies sufficiently far away ( pc) to fully sample the ISP through the Galactic plane.
Since ISP is nearly additive in Stokes and when the ISP is small, effectively defining an origin in the - plane for calculating the intrinsic polarization (i.e., the distance from the ISP to the data points), the clearest presentation of polarization data is in the - plane. In Figure 9 we show the and data (rebinned to 10 Å pixel-1 to reduce noise), along with the limits on the ISP determined earlier. To illustrate the dramatic effects that can result from different ISP values, we chose four ISP values (indicated in Fig. 9; detailed descriptions of how points () and () were chosen are given in §3.3.3 and §3.3.4) and show the resulting “intrinsic” polarization in Figure 10. As can be seen, line polarization dips can become peaks or even disappear completely, and the overall level of continuum polarization can either decrease or increase upon removal of the ISP. Clearly, any interpretation of SN polarization must necessarily be bounded by the uncertainty in the ISP.
For SN 1998S, however, we may be able to place additional constraints on the ISP from physical considerations. The polarization seen in Figure 8b broadly suggests the physical picture of a continuum source surrounded by an aspherical electron-scattering atmosphere with an overlying emission-line region. Such a situation would explain the flat continuum polarization (due to the wavelength-independent nature of electron scattering) as well as the reduced polarization in line features (from the dilution of polarized continuum light by unpolarized line recombination emission). In detail, however, the existence of different polarization properties for the broad and narrow lines mentioned in §3.3.1 can be interpreted in several ways, depending on which sets of lines are considered to be polarized. (The different directions taken in the - plane by the broad and narrow lines rule out the possibility of both components being unpolarized.)
Physically, the answer is determined by whether sufficient free electrons exist in the environment of the line’s production to scatter, and therefore polarize, the line’s light. Since broad, unblended emission features have traditionally been treated as intrinsically unpolarized in SN studies (c.f., Tran et al. 1997; Trammell et al. 1993; Höflich et al. 1996; Jeffery 1991b; Wang et al. 1996), we follow this path first, and examine its implications for the geometry of SN 1998S. Then, in §3.3.4 and §3.3.5, we address the question of how different assumptions (e.g., narrow lines unpolarized and broad lines polarized, or both broad and narrow lines polarized) affect the implied geometry.
Unpolarized broad-line photons diluting polarized continuum light produce predicted polarization characteristics which can be compared with what is observed. If this model were exactly correct the polarized flux (i.e., “Stokes Flux,” ) would simply be a noisy version of the continuum with no broad-line features evident, since the amount an unpolarized emission line reduces the polarization level at a given wavelength would be the same as the amount the flux would increase relative to the continuum at that same wavelength. Assuming zero ISP, the Stokes flux nearly realizes this prediction (Fig. 11a), following the continuum shape throughout the spectrum, with only small decreases evident at H, H, and He II , and a slight increase at N III/C III . The obvious question, then, is whether a unique ISP exists which can completely remove these line features; in addition to bolstering confidence in the model, the existence of such a value would also yield an estimate of the ISP. To estimate the ISP, we follow the method of Tran et al. (1997), in which the and ISP values (i.e., , ) that individually make a line’s feature in the “Stokes parameter fluxes” ( and ; see Figs. 11c and 11d) disappear are found. This is accomplished by comparing the continuum-subtracted Stokes parameter fluxes in a line with the continuum-subtracted total flux spectrum in the line, yielding
where “cs” denotes continuum-subtracted line fluxes; see Tran et al. (1997) for a thorough discussion of this method.
The major source of uncertainty is accurate continuum placement in both the total and Stokes parameter fluxes. Fortunately, since our total flux spectrum’s continuum is very well defined, placement there is straightforward; the main source of error comes from estimating the continuum in the Stokes parameter fluxes, due to their inherently noisy nature. When we apply this technique to H (it is the best line since it is not blended with other strong features), we derive , at Å, with errors derived from the estimated uncertainty in continuum placement. For a Serkowski law with the wavelength of maximum polarization occurring at Å this becomes , illustrated as point () in Figure 9. Adopting this ISP produces the “intrinsic” polarization shown in Figure 10a, and the Stokes flux, Stokes parameter fluxes, and PA shown in Figure 12. Notice that with the removal of this ISP the intrinsic continuum polarization has increased to 3% (at PA ), implying a global asphericity of at least 45% according to the models of Höflich (1991).
The value for this ISP ( at PA = ) is encouraging on several fronts. First, it lies within the upper limit of 2.25% derived from reddening considerations (§3.3.2). Second, in addition to removing the H feature in polarized flux, it effectively removes all but one of the other broad-line features (Fig. 12a). A natural explanation for the different behavior of the C III/N III line, which is seen to increase in total Stokes’ flux above the continuum value, is that it is produced in a slightly different physical location, perhaps closer to or even within the primary electron-scattering region of the continuum atmosphere. This would allow line photons to become polarized as they scatter their way out of the atmosphere; interestingly, a similar ionization stratification has been noted in Wolf-Rayet stars’ atmospheres (Harries et al. 1999). Third, recent polarization studies of edge-on spiral galaxies show polarization vectors closely aligned parallel to the galaxy’s disk (e.g., Jones 1997; Scarrott et al. 1990), and the nearly edge-on host of SN 1998S (; c.f., Frei et al. 1996) has a PA of on the sky, reasonably close to our measured ISP PA. Finally, adopting this ISP has made the rotations in polarization PA originally seen across the broad emission lines (Fig. 11b) essentially disappear (Fig. 12b), suggesting that even if the broad-line photons are themselves slightly polarized by scattering, the geometry of their scattering environment is at least the same as that of the continuum. The rotation seen in the narrow lines’ polarization PA after removal of this ISP, however, implies scattering of narrow-line photons from material with a different geometric distribution than the continuum in this model.
Two additional points from this investigation are worth mentioning. First, the inferred value of the ISP really places a lower bound on the intrinsic SN polarization for this model: If the H line photons are themselves slightly polarized, then the true ISP value is actually farther away from the continuum (i.e., increases), thereby increasing the implied SN polarization and corresponding asphericity. Second, the straight line-segments traced in - space by the broad-line features do not necessarily imply axisymmetry since the completely unpolarized line photons assumed by this model will produce lines (as opposed to loops) in - for any geometry of the line-forming region.
3.3.3 Interpretation II: Broad Lines Polarized, Narrow Lines Unpolarized
Overall, the assumption of unpolarized broad lines with polarized narrow lines described in the previous section appears to have served us well, producing a believable ISP and a reasonably straightforward physical interpretation. However, we must also consider the different, though plausible, assumption that the broad lines are polarized and the narrow lines are unpolarized or, equivalently, are scattered by a spherical distribution of electrons.
We can again use the method of Tran et al. (1997) to determine the preferred ISP under these new assumptions. That is, we now seek to eliminate the narrow features in the Stokes parameter fluxes, just as we removed the broad features earlier. This is done primarily with H, though the other narrow lines are used as well to help determine , due to the difficulty of separating the narrow from the broad component in the H profile. We derive , or at PA = , with errors again estimated mainly by the uncertainty in the continuum placement around the narrow features. Note that this inferred ISP strains the limit imposed by reddening considerations, shown as point () in Figure 9.
As expected, this ISP successfully removes the narrow features in the Stokes parameter fluxes and the PA rotations across them (Fig. 13). By doing so, however, it has introduced polarization and PA rotation to the broad-line features. The physical inferences that are drawn from this model are thus quite different from those found before. First, the resulting “intrinsic” continuum polarization of shown in Figure 10b implies an asphericity of at least 60% (c.f., Höflich 1991). Second, the rotation of the polarization PA across the broad-line features necessitates a different, though axisymmetric (straight lines traced in the - plane), scattering geometry for the broad lines than for the continuum region.
3.3.4 Interpretation III: Both Broad and Narrow Lines Polarized
The final possibility to consider is that both the broad and narrow components are polarized, and have different scattering geometries than the continuum region. With this assumption, we are left unable to determine the ISP, and can draw only limited conclusions: 1) the geometry of the broad line’s scattering environment is axisymmetric; 2) the geometries of the broad and narrow-line scattering environments are different; and 3) the continuum polarization , from the limits imposed by the reddening. Example ISP values allowed under this interpretation are shown in Figure 9 as points () and (), with the resulting intrinsic polarizations given in Figures 10c and 10d. We note that assuming zero ISP (Figs. 8 and 11) also falls under this interpretation.
4 DISCUSSION
4.1 Polarization
Spectropolarimetry is notoriously difficult to interpret, given the uncertainties in both the interstellar contribution and the models of the immediate scattering environment for the object itself. As we have seen, our single spectropolarimetric observation of SN 1998S is quite open to competing interpretations, resulting from different assumptions made for the polarization properties of the broad and narrow emission lines. Which assumptions are most reasonable? To be sure, additional early-time spectropolarimetric epochs would have helped lay many choices to rest. For instance, if the continuum polarization varied and either the broad-line or narrow-line features pointed to a consistent position in the - plane, a depolarizing set of lines with geometry consistent with the continuum would be implied, allowing a unique ISP to be derived; see Harries et al. (1999) for an application of this elegant technique. Lacking such information, however, we must speculate largely from considerations of physical reasonableness.
Models of SNe interacting with a dense CSM generally envisage a double shock-wave structure near the ejecta-CSM interface, with one shock propagating outward into the wind material (outer shock) and the other moving inward through the ejecta (inner shock; c.f., Chevalier 1982). If the inner shock is radiative, then a dense shell of shocked ejecta will form behind it at the contact discontinuity between the inner and outer shocks. It is this thin, dense shell that has been proposed as the likely source of the broad-line emission features, energized by either the reprocessing of X-rays emitted by the shock waves or through thermal conductivity with the hot, shocked wind plasma (Chugai 1997b). The densest part of this shell may also be responsible for the continuum production (Chugai 1991). The narrow lines, on the other hand, are thought to come from photoionized stellar wind material in regions as yet undisturbed by the expanding ejecta. The narrow lines thus serve as a sort of precursor, revealing information about the CSM the ejecta will encounter in the future.
From the broad-line features seen in the total flux spectra of SN 1998S, we can identify at least two epochs of ejecta-CSM interaction: The first, lasting days after discovery, with material in the immediate vicinity of the progenitor, and the second, evident from day 108 onwards though presumably starting somewhat before this, with a distribution of material farther away. This second region of material is likely the gas mainly responsible for the narrow lines, suggesting that cm-3 there, a density which could plausibly produce some optical depth to electron scattering. Further, the blue and red peaks of the broad emission profiles evident in later-time spectra may indicate that this CSM is not spherically distributed, but is instead concentrated in a ring or disk (see, e.g., Warner 1995, pp. 93-98).222For an alternate broad-line production scenario which does not require an asymmetric CSM yet still produces a double-humped profile, see Chugai (1991). Evidence from the total flux spectra can thus naturally create the physical picture of a dense, asymmetric scattering environment for the narrow lines.
On the other hand, the model of unpolarized narrow lines seems to us more difficult to maintain. Such an assumption requires an ISP that pushes the allowed limit and a broad-line scattering geometry that is both axisymmetric and different than the continuum region’s geometry, a notion that runs counter to their probable similar production locations. This last issue also argues against the picture of the narrow and broad lines both being polarized, since this too necessitates different geometries for their scattering environments.
Though impossible to know for sure, we are therefore led to prefer the “conventional” interpretation of depolarizing broad lines surrounding a polarized continuum. If correct, then the intrinsic SN polarization of is the highest SN polarization thus far observed. Interestingly, the previous record of was shared by SN 1994Y and SN 1993J (Wang et al. 1996), both of which are believed to have experienced significant mass-loss prior to explosion. Indeed, though still limited by small numbers, there seems to be a trend of increasing SN polarization with decreasing H or He envelope mass (Reddy, Höflich, & Wheeler 1999).
4.2 Early-Time Continuum
We now return to our discussion of the early-time continuum shape, viewed in light of our preferred interpretation of the spectropolarimetry. One possibility previously considered was that the excess blue flux could be explained by a series of overlapping emission lines. If such lines had polarization characteristics similar to the other emission lines (i.e., they contribute diluting, unpolarized light), we would expect the overall polarization level to decrease towards blue wavelengths, an effect not seen to any significant degree (Fig. 10a). A second idea proposed was that the blue excess was partly an artifact of an unusual extinction law, with . Since lines of sight to reddened Galactic stars obey the relation (Å) (Whittet & van Breda 1978), leads to the expectation of Å. However, for the preferred ISP we find that any Å results in a continuum polarization PA that changes significantly (i.e., ) across the spectrum, inconsistent with the wavelength-independent geometry assumed in the model. Placing faith in this model, then, necessarily argues for a more normal and against either an unusual extinction law or overlapping emission lines as the cause of the blue continuum shape.333We note that subtle combinations of the parameters, however, cannot be absolutely ruled out by the polarimetry alone, due mainly to its limited wavelength coverage. For instance, a slightly unusual extinction law of ( Å) provides a PA which is uniform to within our uncertainty (). When a Serkowski law with Å at our preferred ISP is removed from the polarization data, a small drop in Stokes flux occurs at blue wavelengths. Since the Stokes flux reveals the true continuum shape, this change permits blackbody fits at lower temperatures, though for () temperatures in excess of 40,000 K are still required. To get K requires , quite different from the reddening estimated in §3.1.
One final possibility to consider for the blue continuum is that light scattered by dust in the circumstellar nebula surrounding SN 1998S is producing a “light echo,” resulting in SN light from an earlier epoch contributing to the observed spectrum (e.g., Chevalier 1986; see also Lawrence, Crotts, & Gilmozzi 1998). Not only is the scattered light from a hotter (i.e., bluer) epoch, but it should further increase at shorter wavelengths since dust grains with size typical for the interstellar medium () have a scattering efficiency that rises sharply with decreasing wavelength (c.f., Spitzer 1978). Could this explain the unusually blue continuum seen in the early-time spectra of SN 1998S and SNe IIn in general? Though impossible to completely discount given our limited data, evidence can certainly be found to counter this model. First, the extreme youth of SN 1998S coupled with the likely destruction of dust grains by the intense UV flash within a radius of about seven light-days (Wang & Wheeler 1996) greatly limit the region of space that could contribute to such an echo. Second, attempts to fit the overall light curves of SNe IIn with the simple light-echo model have been unsuccessful (Roscherr & Schaefer 1998), although contributions at the level needed here probably cannot be ruled out. Finally, if the proposed dust exists in clumps or is in any way asymmetrically distributed, then even a small amount of scattering should produce measurable polarization in the received SN light, since dust scattering is very efficient at polarizing light. Although computing a detailed light-echo polarization model is beyond the scope of this study (see Wang & Wheeler (1996) for such modeling in the case of SN 1987A), we note that simple reflection (i.e., single scattering) off grains of typical size should produce polarization which increases at blue wavelengths due to the greater scattering efficiency there (e.g., Miller & Goodrich 1990; Miller, Goodrich, & Mathews 1991; see, however, Kartje 1995, for a discussion of how multiple scatters could alter this), a trend inconsistent with the flat continuum polarization observed here in SN 1998S.
Since “extrinsic” effects seem unlikely, we propose that the continuum, while predominantly blackbody in nature, has either an additional component or a modification of its blackbody spectrum producing a color temperature which increases with decreasing wavelength. Since unusually blue continua have been observed in previous early-time SNe IIn spectra, and a blue excess was not detected in similarly early-time spectra of SN 1993J (Clocchiatti et al. 1995), it may be that this characteristic is unique to SNe IIn, a situation that would favor mechanisms requiring dense circumstellar environments over sources that are common to all SNe. Obvious possibilities include free-free emission and Comptonization of photospheric photons by hot () electrons in the shocked gas, sources which have been invoked to explain flux excesses seen in the far ultraviolet (Å) in previous SNe interacting with dense circumstellar environments (e.g., 1979C; Fransson 1982), and even SN 1998S itself later in its evolution (Lentz et al. 1998). The amount these processes are predicted to contribute to the total flux spectrum at the optical wavelengths considered here, however, is probably (c.f., Fransson 1982), although a detailed model with conditions specific to SN 1998S has not been done. A more likely contributor may be the wavelength dependence of the continuum absorptive opacity, which increases with wavelength for both bound-free (i.e., the Paschen continuum) and free-free processes through most of the spectral range observed (see, e.g., Eastman et al. 1994). Significant optical depth for these processes is possible in the cool, dense shell (, ; c.f., Chugai 1991) of shocked ejecta where the continuum is probably produced. Such continuous opacity could explain both the smooth appearance and apparent blue excess seen.
4.3 Geometry of SN 1998S and its CSM
By combining our preferred interpretation of the spectropolarimetry (§4.1) with information derived from the total flux spectra (§3.2) it is possible to construct a rough evolutionary scenario for SN 1998S. The main observational points are: (1) the early-time continuum is produced within a highly aspherical () scattering region; (2) strong, broad (half width near zero intensity (HWZI) ), symmetric emission features seen early disappear by day 12; (3) at day 25 the spectrum has features in common with early-time spectra of stripped-envelope SNe; (4) at day 108 the spectrum exhibits a broad, asymmetric H emission line; and (5) between day 140 and day 268 the H profile becomes double (or even triple) peaked.
We start by setting approximate size constraints on the CSM. For the purposes of this simple model, we assume that the explosion occurred on the discovery date, and that the presence or absence of emission-dominated line profiles signifies interaction, or lack thereof (respectively), between the fastest moving ejecta (10,000 km s-1) and the CSM. This allows us to identify two distinct regions of circumstellar material, one in the immediate vicinity of the progenitor (“inner CSM”) and one farther away (“outer CSM”). The rather abrupt disappearance of the broad emission features by about day 12 suggests that the inner CSM has been overrun by the expanding ejecta, restricting its size to AU. From the reemergence of broad emission by day 108 we derive an inner boundary of AU for the outer CSM. Since this interaction continues through the day 494 spectrum, the outer CSM region must extend out to AU.
These distinct phases of interaction with CSM imply episodic mass-loss of the progenitor, with the most recent episode being terminated by the explosion itself. The circumstellar gas producing the narrow P-Cygni absorption in the 25 d spectrum () is likely the same gas producing the narrow emission (). Due to the large optical depth of the lines, the shallow density gradient of the circumstellar wind, and contamination from the narrow emission components, the density peak in the CSM producing the blueshifted narrow absorption is probably significantly slower than (c.f., Jeffery & Branch 1990). In order to set the time evolution of the progenitor’s mass-loss, we will assume that the circumstellar gas (both outer and inner CSM) is traveling at 50 . With this approximation, the boundaries previously set on the outer CSM imply a mass-loss episode which began more than 300 years before the explosion and terminated less than 60 years before core collapse. If we assume that the more recent mass-loss episode is characterized by a similar velocity, then we conclude that it began only seven years prior to core collapse.
These considerations lead to the following evolutionary scenario. The progenitor star of SN 1998S underwent a significant mass-loss episode terminating less than 60 years prior to the explosion, having lasted more than 240 years. This mass-loss may have been concentrated in a ring or disk early on, perhaps becoming more spherical near the end. A second mass-loss episode began only seven years before core collapse, and continued up to the time of the explosion. This mass-loss may have stripped much of the remaining hydrogen envelope from the progenitor and deposited it in the dense CSM. When the star exploded, it immediately interacted with the most recently lost material, completely engulfing it within 12 days. For a brief time ( few weeks), the ejecta expanded without significant circumstellar interaction, revealing spectral features similar to other stripped-envelope events.444The lack of a strong Ca II near-IR triplet in the 25 d spectrum is also consistent with this identification. Filippenko (1992) found H absorption strength to be inversely correlated with the strength of the near-IR Ca II lines, perhaps indicative of the relative concentration of these elements in the SN envelope. The Balmer hydrogen profiles seen in SN 1998S, while very weak compared with normal type II events, are quite strong relative to the SNe Ic in Filippenko’s study. Interaction with another region of dense CSM began sometime before day 108 and continues through day 494, the last epoch studied here.
To help fix ideas, a diagram illustrating the proposed geometry of SN 1998S and its CSM five days after discovery (concurrent with the spectropolarimetric observation) is shown in Figure 14. In order to derive the absolute orientation in the plane of the sky for the continuum, broad-line, and narrow-line production regions, we took our preferred ISP () and assumed oblate spheroids for the broad-line and continuum production regions. The narrow-line region was assumed to be concentrated in a disk of CSM exterior to the expanding ejecta. For the continuum, a PA (Fig. 12b) implies an oblate spheroid with its long axis oriented at PA . The broad-line region, assumed to produce unpolarized light in this model, necessarily has an undetermined geometry. However, the suggestion that the broad C III/N III () line is in fact slightly polarized with PA similar to the continuum (§3.3.3) argues for a common morphology for the two regions; we therefore represent the broad-line region as having the same geometry as the continuum region, though exterior to it. The narrow-line production region has PA (see Fig. 9; the relative position of point “b” to point “a” determines the PA of the narrow-line region), implying a scattering disk oriented at (c.f., Wood et al. 1996), arbitrarily shown edge-on in the figure.
We note that the ring-like geometry inferred for the CSM of SN 1998S is quite similar to that seen directly in SN 1987A (c.f., Crotts & Heathcote 1999), except much denser and closer to the progenitor in SN 1998S (inner ring radius of AU compared with 40,000 AU for SN 1987A). Although the agent ultimately responsible for such asymmetric mass-loss is unknown, it is tempting to postulate that it resulted from the interaction of the progenitor of SN 1998S with a companion star, similar to some models of SN 1987A (e.g., Soker 1999b). It might prove fruitful to model in detail the evolutionary scenario for SNe IIn suggested by Nomoto et al. (1995), in which two stars merge shortly before explosion and undergo asymmetric mass-loss through formation of a common envelope, to see if it can explain the observed properties of SN 1998S presented here.
5 CONCLUSION
In this paper we have reported on an early-time spectropolarimetric observation of SN 1998S and total flux spectra sampling the first 494 days after its discovery. Our main results are as follows.
-
1.
The CSM surrounding SN 1998S has , and may be asymmetrically distributed, perhaps with a disk-like or ring-like morphology, generically similar to that seen directly in SN 1987A.
-
2.
Uncorrected for ISP, the early-time continuum exhibits a flat polarization spectrum with , and sharp decreases in polarization at the location of both the broad and narrow emission lines seen in the total flux spectrum.
-
3.
The polarization features associated with the broad lines trace straight line-segments in the - plane, and all point in the same direction.
-
4.
The polarization features associated with the narrow lines have different properties than the broad lines, eliminating the possibility that both sets of lines are unpolarized.
-
5.
The early-time continuum has a color temperature that increases with decreasing wavelength.
We advance the following basic hypothesis. The progenitor of SN 1998S was a massive star stripped of most of its hydrogen envelope by at least two strong mass-loss episodes, the first concentrated in a ring or disk and the last still occurring when the explosion took place. The early-time spectrum was dominated by the intense interaction between the SN ejecta and an inner region of circumstellar material surrounding the progenitor. In our spectropolarimetric observation five days after discovery, unpolarized broad-line recombination emission dilutes the light from a highly polarized, aspherical continuum region. The continuum is likely produced in a dense shell of ejecta formed near the ejecta-CSM interface; significant optical depth to the Paschen continuum and free-free absorption in this shell may be responsible for its unusually blue color. Narrow-line emission is coming from, and being scattered by, dense, asymmetrically distributed CSM exterior to the expanding ejecta. When modeled in this way, we determine the ISP to be at PA (point() in Fig. 9), resulting in an intrinsic polarization for SN 1998S of 3% at PA (Fig. 10a and Fig. 12) and implying a global asphericity of at least 45% from the models of Höflich (1991).
Determining whether the inferred asphericity results primarily from an asymmetrically distributed CSM or an aspherical explosion is difficult. The symmetry seen in the broad-line profiles (c.f., Fig. 3) might seem to indicate a substantially spherical line-forming region in the CSM, thus favoring an aspherical explosion as the cause of the polarization. However, absorption effects are known to wash out spectral signatures of asphericity in supernova atmospheres (c.f., Höflich et al. 1996), rendering this diagnostic inconclusive without detailed modeling. It is thus difficult to eliminate either an asymmetrically distributed CSM or an aspherical explosion as the cause of the polarization, and both may actually play a role. Future spectropolarimetric observations of core-collapse SNe not interacting with dense CSM (i.e., SNe II-P) should help shed light on this issue.
The conclusion that SN 1998S has a high intrinsic polarization adds to the mounting evidence that many SNe are aspherical at some level. While this realization may aid in the resolution of some mysteries (i.e., “kick” velocities imparted to neutron stars), it certainly creates others, the most crucial of which is the unknown agent responsible for the asphericity: Is the explosion mechanism itself asymmetric? Can progenitor star rotation produce such asphericities (c.f., Fryer & Heger 1999)? Are companions involved? How well constrained are such “extrinsic” effects as scattering from an asymmetrically distributed CSM (or dust) as the cause for the polarization? Detailed analysis of the spectropolarimetry of nearby SNe (preferably at multiple epochs), together with additional theoretical calculations, should help bring these issues into sharper focus in the next few years.
References
- (1) Barbon, R., Benetti, S., Cappellaro, E., Rosino, L., & Turatto, M. 1990, A&A, 237, 79
- (2) Benetti, S., Turatto, M., Cappellaro, E., Danziger, I. J., & Mazzali, P. A. 1999, MNRAS, 305, 811
- (3) Branch, D., Jeffery, D. J., Blaylock, M., & Hatano, K. 2000, PASP, in press, astro-ph/9911099
- (4) Burrows, A., Hayes, J., & Fryxell, B. A. 1995, ApJ, 450, 830
- (5) Cardelli, J. A., Clayton, G. C., & Mathis, J. S. 1989, ApJ, 345, 245
- (6) Chevalier, R. A. 1982, ApJ, 259, 302
- (7) Chevalier, R. A. 1986, ApJ, 308, 225
- (8) Chevalier, R. A., & Fransson, C. 1985, in Supernovae as Distance Indicators, ed. N. Bartel (New York: Springer-Verlag), 123
- (9) Chevalier, R. A., & Fransson, C. 1994, ApJ, 420, 268
- (10) Chugai, N. N. 1991, MNRAS, 250, 513
- (11) Chugai, N. N. 1994, in Circumstellar Media in the Late Stages of Stellar Evolution, ed. R. E. S. Clegg, I. R. Stevens, & W. P. S. Meikle (Cambridge: Cambridge Univ. Press), 148
- (12) Chugai, N. N. 1997a, Astron. Reports, 41, 672
- (13) Chugai, N. N. 1997b, Ap&SS, 252, 225
- (14) Chugai, N. N., & Danziger, I. J. 1994, MNRAS, 268, 173
- (15) Clocchiatti, A., Wheeler, J. C., Barker, E. S., Filippenko, A. V., Matheson, T., & Liebert, J. W. 1995, ApJ, 446, 167
- (16) Cohen, M. H. 1996, The LRIS Polarimeter (Keck Observatory instrument manual), available at http://www2.keck.hawaii.edu:3636/
- (17) Cohen, M. H., Vermeulen, R. C., Ogle, P. M., Tran, H. D., & Goodrich, R. W. 1997, ApJ, 484, 193
- (18) Cordes, J. M., & Chernoff, D. F. 1998, ApJ, 505, 315
- (19) Crotts, A. P. S., & Heathcote, S. R. 2000, ApJ, in press, astro-ph/9907367
- (20) Eastman, R. G., Woosley, S. E., Weaver, T. A., & Pinto, P. A. 1994, ApJ, 430, 300
- (21) Filippenko, A. V. 1982, PASP, 94, 715
- (22) Filippenko, A. V. 1991, in Supernovae, ed. S. E. Woosley (New York: Springer), 467
- (23) Filippenko, A. V. 1992, ApJ, 384, L37
- (24) Filippenko, A. V. 1997, ARA&A, 35, 309
- (25) Filippenko, A. V., & Moran, E. C. 1998, IAU Circ. No. 6830
- (26) Fransson, C. 1982, A&A, 111, 140
- (27) Frei, Z., Guhathakurta, P., Gunn, J. E., & Tyson, J. A. 1996, AJ, 111, 174
- (28) Fryer, C. L., & Heger, A. 2000, ApJ, submitted, astro-ph/9907433
- (29) Garnavich, P., Jha, S., Kirshner, R., Gerardy, C., & Fesen, R. 1998a, IAU Circ. No. 7058
- (30) Garnavich, P., Jha, S., Kirshner, R., & Huchra, J. 1998b, IAU Circ. No. 6832
- (31) Garnavich, P., Kirshner, R., Challis, P., Koranyi, D., & Culkins, M. 1998c, IAU Circ. No. 6845
- (32) Gerardy, C. L., Fesen, R. A., Höflich, P., & Wheeler, J. C. 1998, BAAS, 193, 4707
- (33) Grandi, S. A. 1980, ApJ, 238, 10
- (34) Granslo, B. H., Shanklin, J., Carvajal, J., & Hornoch, K. 1998, IAU Circ. No. 6846
- (35) Grasberg, É. K. 1993, Pis’ma Astron. Zh., 19, 401
- (36) Grasberg, É. K., & Nadezhin, D. K. 1991, Sov. Astron., 35, 42
- (37) Harries, T. J., Howarth, I. D., Schulte-Ladbeck, R. E., & Hillier, D. J. 1999, MNRAS, 302, 499
- (38) Höflich, P. 1991, A&A, 246, 481
- (39) Höflich, P., Wheeler, J. C., Hines, D. C., & Trammell, S. R. 1996, ApJ, 459, 307
- (40) Höflich, P., Wheeler, J. C., & Wang, L. 1999, ApJ, 521, 179
- (41) Horne, K. 1986, PASP, 98, 609
- (42) Jeffery, D. J. 1991a, ApJ, 375, 264
- (43) Jeffery, D. J. 1991b, ApJS, 77, 405
- (44) Jeffery, D., & Branch, D. 1990, in Supernovae, eds. J. C. Wheeler, T. Piran, & S. Weinberg (Singapore: World Scientific), 149
- (45) Jha, S., et al. 1999, ApJS, in press
- (46) Jones, T. J. 1989, AJ, 98, 2062
- (47) Jones, T. J. 1997, AJ, 114, 1393
- (48) Jones, T. J., Klebe, D., & Dickey, J. M. 1992, ApJ, 389, 602
- (49) Kartje, J. F. 1995, ApJ, 452, 565
- (50) Kesteven, M. J., & Caswell, J. L. 1987, A&A, 183, 118
- (51) Lawrence, S. S., Crotts, A. P. S., & Gilmozzi, R. 1998, BAAS, 193, 4702
- (52) Lentz, E. J., Baron, E., Branch, D., Hauschildt, P. H., Fransson, C., Lundqvist, P., Garnavich, P., & Kirshner, R. P. 1998, BAAS, 193, 4708
- (53) Li, W. D., Li, C., Filippenko, A. V., & Moran, E. C. 1998, IAU Circ. No. 6829
- (54) Lyne, A. G. 1998, Adv. Space Res., 21, 149
- (55) Mathewson, D. S., Ford, V. I., Klare, G., Neckel, T., & Krautter, J. 1978, BICDS, 14, 115
- (56) Miller, J. S. & Goodrich, R. W. 1990, ApJ, 355, 456
- (57) Miller, J. S., Goodrich, R. W., & Mathews, W. G. 1991, ApJ, 378, 47
- (58) Miller, J. S., Robinson, L. B., & Goodrich, R. W. 1988, in Instrumentation for Ground-Based Astronomy, ed. L. B. Robinson (New York: Springer-Verlag), 157
- (59) Miller, J. S., & Stone, R. P. S. 1993, Lick Obs. Tech. Rep., No. 66
- (60) Monnier, J. D., Tuthill, P. G., Lopez, B., Cruzalebes, P., Danchi, W. C., & Haniff, C. A. 1999, ApJ, 512, 351
- (61) Munari, U., & Zwitter, T. 1997, A&A, 318, 269
- (62) Niemela, V. S., Ruiz, M. T., & Phillips, M. M. 1985, ApJ, 289, 52
- (63) Nomoto, K., Iwamoto, K., Tomoharu, S. 1995, Phys. Rep., 256, 173
- (64) O’Donnell, J. E. 1994, ApJ, 422, 158
- (65) Oke, J. B., et al. 1995, PASP, 107, 375
- (66) Patat, F., Barbon, R., Cappellaro, R., & Turatto, M. 1993, A&A, 282, 731
- (67) Press, W. H., Teukolsky, S. A., Vetterling, W. T., & Flannery, B. P. 1992, Numerical Recipes in C: The Art of Scientific Computing, 2nd edition, (New York: Cambridge University Press)
- (68) Qiu, Y. L., Cao, L., Qiao, Q. Y., Kiss, L., Keen, R., & Hornoch, K. 1998a, IAU Circ. No. 6841
- (69) Qiu, Y. L., Yoshida, S., Merlin, J. C., & Schmeer, P. 1998b, IAU Circ. No. 6835
- (70) Reddy, N. A., Höflich, P. A., & Wheeler, J. C. 1999, BAAS, 194, 8602
- (71) Richmond, M. W., Treffers, R. R., Filippenko, A. V., Paik, Y., Leibundgut, B., Schulman, E., & Cox, C. V. 1994, AJ, 107, 1022
- (72) Riess, A. G., Press., W. H., & Kirshner, R. P. 1996, ApJ, 473, 88
- (73) Roscherr, B., & Schaefer, B. E. 1998, BAAS, 193, 4714
- (74) Rybicki, G. B., & Lightman, A. P. 1979, Radiative Processes in Astrophysics (New York: John Wiley & Sons)
- (75) Sahai, R., & Trauger, J. T. 1998, ApJ, 116, 1357
- (76) Savage, B. D., & Mathis, J. S. 1979, ARA&A, 17, 73
- (77) Scarrott, S. M., Rolph, C. D., & Semple, D. P. 1990, in Proc. IAU Sympt. 140, Galactic and Intergalactic Magnetic Fields, ed. R. Beck, P. P. Kronberg, & R. Wielebinski (Dordrecht: Kluwer), 245
- (78) Schlegel, D. J., Finkbeiner, D. P., & Davis, M. 1998, ApJ, 500, 525
- (79) Schlegel, E. M. 1990, MNRAS, 244, 269
- (80) Schmidt, B. P., Kirshner, R. P., & Eastman, R. G. 1992, ApJ, 395, 366
- (81) Serkowski, K. 1973, in Interstellar Dust and Related Topics, ed. J. M. Greenberg and H. C. van de Hulst (Dordrecht: Reidel), 115
- (82) Serkowski, K., Mathewson, D. S., & Ford, V. L. 1975, ApJ, 196, 261
- (83) Shapiro, P. R., & Sutherland, P. G. 1982, ApJ, 263, 902
- (84) Soker, N. 1999a, Phys. Rep., 311, 307
- (85) Soker, N. 1999b, MNRAS, 303, 611
- (86) Spitzer, L., Jr. 1978, Physical Processes in the Interstellar Medium (New York: John Wiley & Sons)
- (87) Stathakis, R. A., & Sadler, E. M. 1991, MNRAS, 250, 786
- (88) Suntzeff, N. B., et al. 1999, ApJ, 117, 1175
- (89) Terlevich, R., Tenorio-Tagle, G., Franco, J., & Melnick, J. 1992, MNRAS, 255, 713
- (90) Trammell, S. R., Hines, D. C., & Wheeler, J. C. 1993, ApJ, 414, 21
- (91) Tran, H. D. 1995, ApJ, 440, 565
- (92) Tran, H. D., Filippenko, A. V., Schmidt, G. D., Bjorkman, K. S., Jannuzi, B. T., & Smith, P. S. 1997, PASP, 109, 489
- (93) Treffers, R. R., Peng, C. Y., Filippenko, A. V., Richmond, M. W., Barth, A. J., & Gilbert, A. M. 1997, IAU Circ. No. 6627
- (94) Tully, B. 1998, Nearby Galaxies Catalog (New York: Cambridge University Press)
- (95) Turnshek, D. A., Bohlin, R. C., Williamson, R. L. II, Lupie, O. L., Koornneef, J., & Morgan, D. H. 1990, AJ, 99, 124
- (96) Wade, R. A., & Horne, K. 1988, ApJ, 324, 411
- (97) Wang, L., & Wheeler, J. C. 1996, ApJ, 462, L27
- (98) Wang, L., Wheeler, J. C., & Höflich, P. 1997, ApJ, 476, L27
- (99) Wang, L., Wheeler, J. C., Li, Z., & Clocchiatti, A. 1996, ApJ, 467, 435
- (100) Warner, B. 1995, Cataclysmic Variable Stars (New York: Cambridge University Press)
- (101) Whittet, D. C. B., & van Breda, I. G. 1978, A&A, 66, 57
- (102) Wilking, B. A., Lebofsky, M. J., & Rieke, G. H. 1982, AJ, 87, 695
- (103) Wood, K., Bjorkman, J. E., Whitney, B. A., & Code, A. D. 1996, ApJ, 461, 828
- (104) Woosley, S. E., Eastman, R. G., Weaver, T. A., & Pinto, P. A. 1994, ApJ, 429, 300
- (105) Woosley, S. E., Pinto, P. A., Martin, P. G., & Weaver, T. A. 1987, ApJ, 318, 664
![[Uncaptioned image]](/html/astro-ph/9908040/assets/x1.png)
![[Uncaptioned image]](/html/astro-ph/9908040/assets/x2.png)