THE ULTRAVIOLET SPECTRUM OF MS 1512cB58: AN INSIGHT INTO LYMAN BREAK GALAXIES11affiliation: Based on data obtained at the W. M. Keck Observatory which is operated as a scientific partnership among the California Institute of Technology, the University of California, and NASA, and was made possible by the generous financial support of the W.M. Keck Foundation.
Abstract
We present an intermediate resolution, high S/N spectrum of the galaxy MS 1512cB58, obtained with LRIS on the Keck I telescope and covering the rest frame far-UV from 1150 to 1930 Å. Gravitational lensing by a foreground cluster boosts the flux from cB58 by a factor of and provides the opportunity for a first quantitative study of the physical properties of star forming galaxies at high redshift. The spectrum we have recorded is very rich in stellar and interstellar features; from their analysis we deduce the following main results.
The ultraviolet spectral properties of cB58 are remarkably similar to those of nearby star forming galaxies and spectral synthesis models based on libraries of O and B stars can reproduce accurately the fine detail of the integrated stellar spectrum. The P-Cygni profiles of C IV and N V are best matched by continuous star formation with a Salpeter IMF extending beyond —we find no evidence for either a flatter IMF (at the high mass end), or an IMF deficient in the most massive stars. There are clues in our data that the metallicity of both the stars and the gas is a few times below solar. Our best estimate, , is times higher than the typical metallicity of damped Lyman systems at the same redshift, consistent with the proposal that the galaxies which dominate the H I absorption cross-section are generally forming stars at a slower rate than Lyman break galaxies like cB58. The relative velocities of the stellar lines, interstellar absorption, and H II emission indicate the existence of large-scale outflows in the interstellar medium of cB58, with a bulk outward motion of 200 km s-1 and a mass loss rate of yr-1, roughly comparable to the star formation rate. Such galactic winds seem to be a common feature of starburst galaxies at all redshifts, and may well be the mechanism which self-regulates star formation, distributes metals over large volumes and allows the escape of ionizing photons into the IGM.
We suggest further observations of cB58 which should provide more precise measurements of element abundances and of detailed physical parameters, and highlight the need to identify other examples of gravitationally lensed galaxies for a comprehensive study of star formation at early times.
1 INTRODUCTION
Galaxies at are now being found in large numbers through color selection based on the Lyman break and narrow-band imaging tuned to the wavelength of Lyman (e.g. Steidel et al. 1999a,b; Hu, Cowie, & McMahon 1998). The main spectroscopic properties of this population were outlined in the original discovery paper by Steidel et al. (1996) who showed that Lyman break galaxies resemble present day star forming galaxies, with spectra characterised by a blue ultraviolet continuum with moderate dust extinction, strong interstellar absorption, P Cygni C IV and N V lines from massive stars, and weak Lyman emission (see also Lowenthal et al. 1997; Meurer et al. 1997; Trager et al. 1997; Heckman et al. 1998; Pettini et al. 1998b).
However, most studies of high redshift galaxies have so far concentrated mainly on their global properties, such as the luminosity function and large-scale distribution (e.g. Steidel et al. 1999a; Giavalisco et al. 1998; Adelberger et al. 1998). The simple reason is that even with the light gathering power of large telescopes the typical galaxy at is too faint ( corresponds to ; Steidel et al. 1999a) to yield spectra with signal-to-noise ratios of more than a few. Thus, more detailed studies of the physical properties of these early episodes of star formation require an additional observational aid, the light magnification produced by gravitational lensing. A few examples have already been identified serendipitously and no doubt many more await discovery by targeted searches in the fields of foreground clusters of galaxies.
One of the best known cases is the galaxy MS 1512cB58. Discovered in the course of the CNOC cluster redshift survey (Yee et al. 1996), cB58 is exceptionally bright (AB, Ellingson et al. 1996) for its redshift . The suggestion by William & Lewis (1997) that this due to gravitational lensing was confirmed by HST images analysed by Seitz et al. (1998) who derived an overall magnification of 3.35–4 magnitudes. Thus cB58 appears to be a typical Lyman break galaxy fortuitously made accessible to detailed spectroscopic studies by the presence of the foreground cluster MS 151236 at .
In this paper we present high S/N observations of cB58
(§2) which offer the best insights yet into the young
stellar population (§3), interstellar gas and dust (§4 and §5),
and large scale motions (§6) in a high redshift galaxy.
§7 deals with intervening absorption.
We summarize our findings in §8 and highlight the importance
of extending this type of detailed spectroscopic analysis to
other examples in order to build a comprehensive picture of the
physical properties of the galaxy population at .
2 OBSERVATIONS AND DATA REDUCTION
We used the Low Resolution Imaging Spectrograph (LRIS; Oke et al. 1995) on the Keck I telescope on Mauna Kea, Hawaii, to record the spectrum of cB58 during two observing runs, in 1996 May and August. Most of the data were obtained with the 900 grooves mm-1 grating set to cover the wavelength range 4300–6020 Å with a linear dispersion of 0.84 Å pixel-1; the total integration time was 11 400 s made up of individual exposures typically 1800 s long. Additionally, we secured two 1800 s long exposures further to the red, using the 1200 grooves mm-1 grating blazed at 7500 Å to cover the interval 5875–7185 Å at 0.64 Å pixel-1. The detector was a SITE pixel CCD. LRIS was used in single-slit mode, with the slit aligned along the long axis of cB58, which is distorted into a gravitational fold arc approximately 3 arcsec long. All the observations were conducted at low airmass.
The data were reduced using standard techniques with IRAF. Since no spatial variations along the arc could be discerned (consistent with the gravitationally lensed nature of cB58), we added up all the signal from the 3 arcsec image in the extraction. Internal lamps were used for wavelength calibration. The spectra were flux calibrated by reference to spectrophotometric standards and corrected for weak telluric absorption by dividing by the spectrum of a B star observed at similar airmass. Finally, ‘blue’ and ‘red’ spectra were mapped onto a common vacuum heliocentric wavelength scale. The spectral resolution indicated by the profiles of night sky emission lines is 3.0 and 2.1 Å FWHM in the blue and red portions of the spectrum, sampled with 3.5 and 2.5 0.85 Å pixels respectively. The signal-to-noise ratio per pixel, measured directly from the final co-added spectrum, is S/N and in the blue and red respectively.
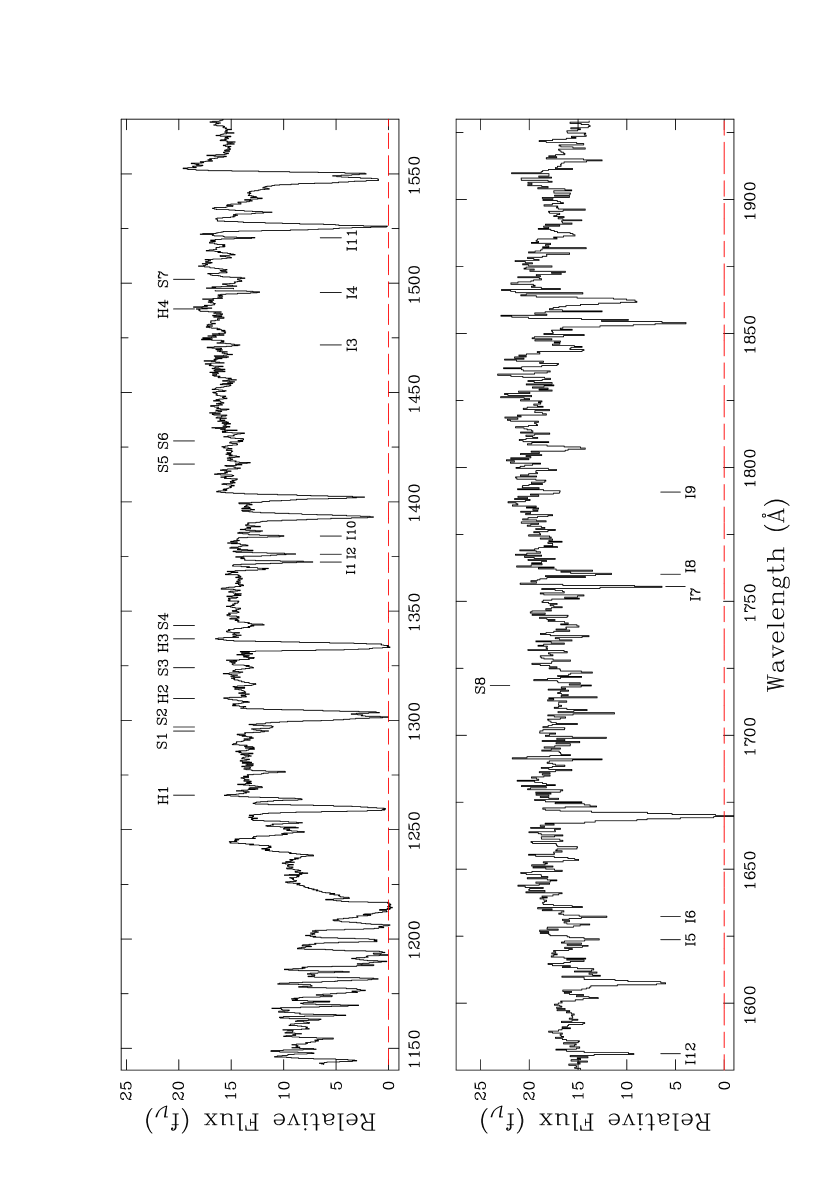
Figure 1 shows the reduced spectrum. In the rest frame of
cB58 at (see below) we sample the far-UV
spectral region, from below Lyman to just beyond CIII] .
Somewhat ironically, this is one of the best ultraviolet spectra
of a starburst galaxy obtained at any redshift, including local
examples studied with HST such as
NGC 1741 (Conti, Leitherer, & Vacca 1996),
NGC 4214 (Leitherer et al. 1996),
and NGC 1705 (Heckman & Leitherer 1997).
The spectrum is extremely rich in features, mostly originating from
stars and interstellar gas in cB58, but also from intervening gas from
the intergalactic medium and galaxies (including the Milky Way) along the
line of sight. We consider each in turn.
3 THE STELLAR SPECTRUM
3.1 Systemic Redshift
The far-UV emission of a star forming galaxy is due primarily to O and B stars. At the high S/N of our blue spectrum (top panel in Figure 1), most of the low contrast structure seen in the continuum is due to stellar features (rather than noise). In the composite spectrum of a stellar population these features are largely blends of different lines which require stellar population synthesis to be analysed quantitatively (see below). We have used the spectral atlases by Walborn, Nichols-Bohlin, & Panek (1985) of IUE observations of O stars, and by Rogerson & Upson (1977) and Rogerson & Ewell (1985) of the Copernicus spectrum of the B0 V star Scorpii to identify stellar photospheric lines which appear to be least affected by blending and which can therefore provide a measure of the systemic redshift of the stellar population in cB58. These lines are listed in Table 1 and are also indicated with tick marks above the spectrum in Figure 1. We deduce (); the internal consistency is reasonable, given the weak, broad character of these features. S V (Howarth 1987) is a prominent line in O stars but it is possible that there are other contributors to this feature (S7 in Figure 1), since it is apparently detected in the HST GHRS spectrum of the ‘postburst’ NGC 1705-1, where a significant population of O stars is no longer present (Heckman & Leitherer 1997). Its wavelength in cB58 may be slightly discordant from those of the other photospheric lines in Table 1, although the evidence is not clear-cut.
3.2 Spectral Synthesis
In the last few years modelling of the integrated spectra of star forming regions has progressed significantly and has been shown to be a powerful tool for deducing many properties of the underlying stellar populations, including the age of the burst, the Initial Mass Function (IMF), metallicity, and dust reddening (e.g. Leitherer 1996). In applying the technique to cB58 we made use of Starburst99, the comprehensive set of models recently compiled by Leitherer et al. (1999).
It is evident when considering these models that ‘continuous star formation’ provides a much better description of the spectrum of cB58 than ‘single burst’ models. We do not see in our data any features which are indicative of a particular phase in the evolution of a starburst, such as WR features (e.g. He II ) and strong Si IV P Cygni profiles which are most prominent after a few Myr, nor the lack of C IV and N V P Cygni lines which signals the absence of O stars Myr after the burst. Consequently, we restrict ourselves to continuous star formation models in the analysis that follows. A corollary of this conclusion is that it is not possible to derive an age for the galaxy from the rest-frame ultraviolet spectrum alone, which is always dominated by the light from the youngest members of the stellar population. Ellingson et al. (1996) used the broad spectral energy distribution from optical and infrared photometry (1300–6000 Å in the rest frame) to deduce an age of less than 35 Myr, but this conclusion is dependent on the amount of reddening which is somewhat uncertain, as discussed in §5 below.
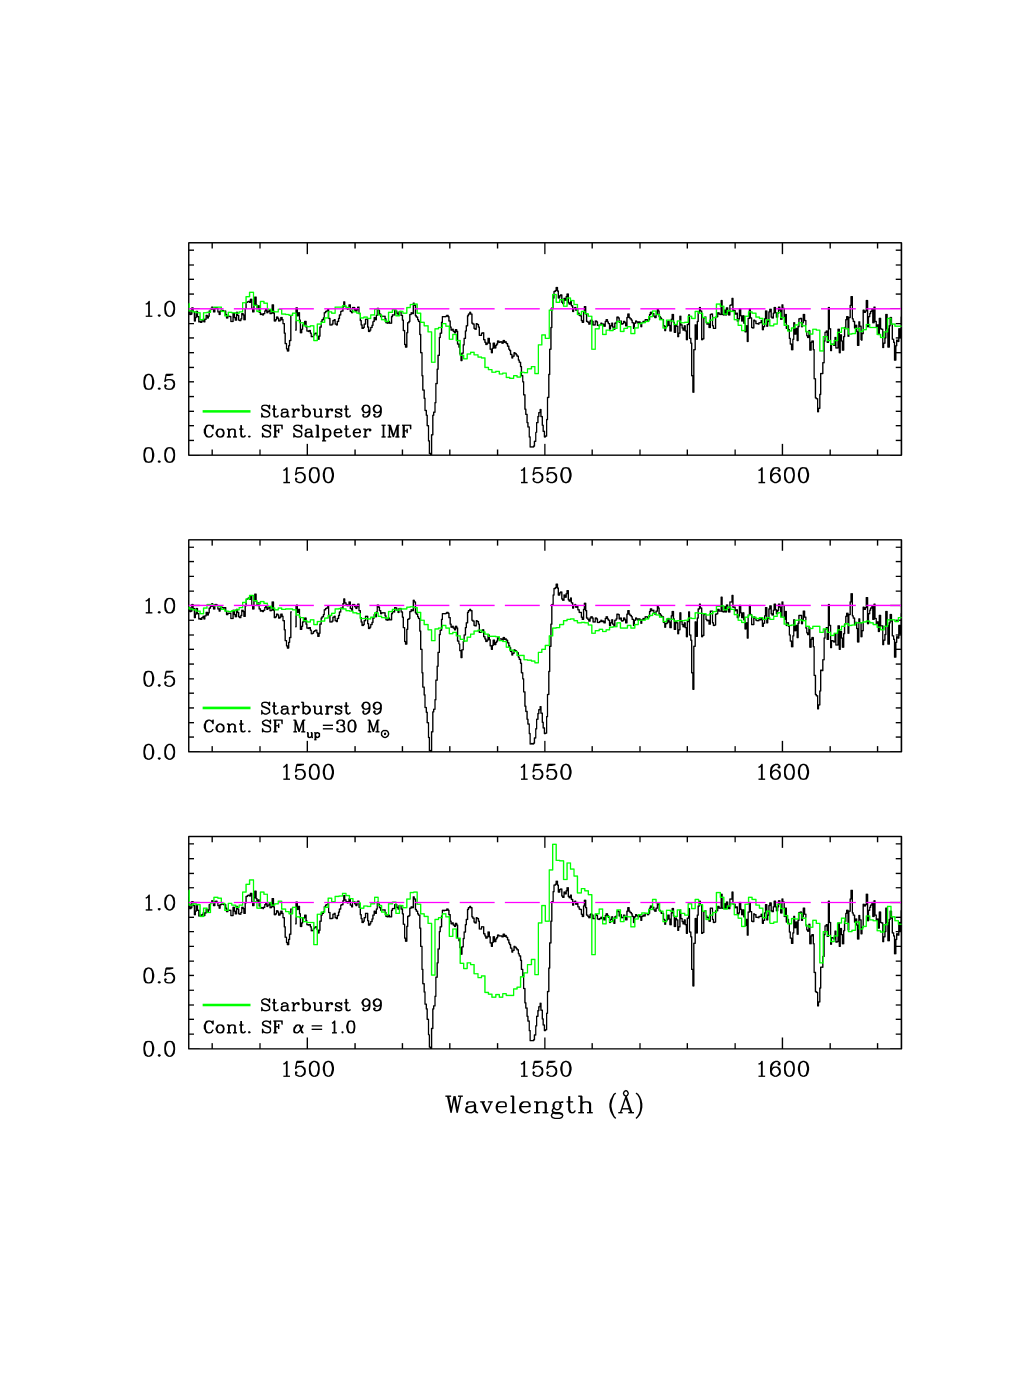
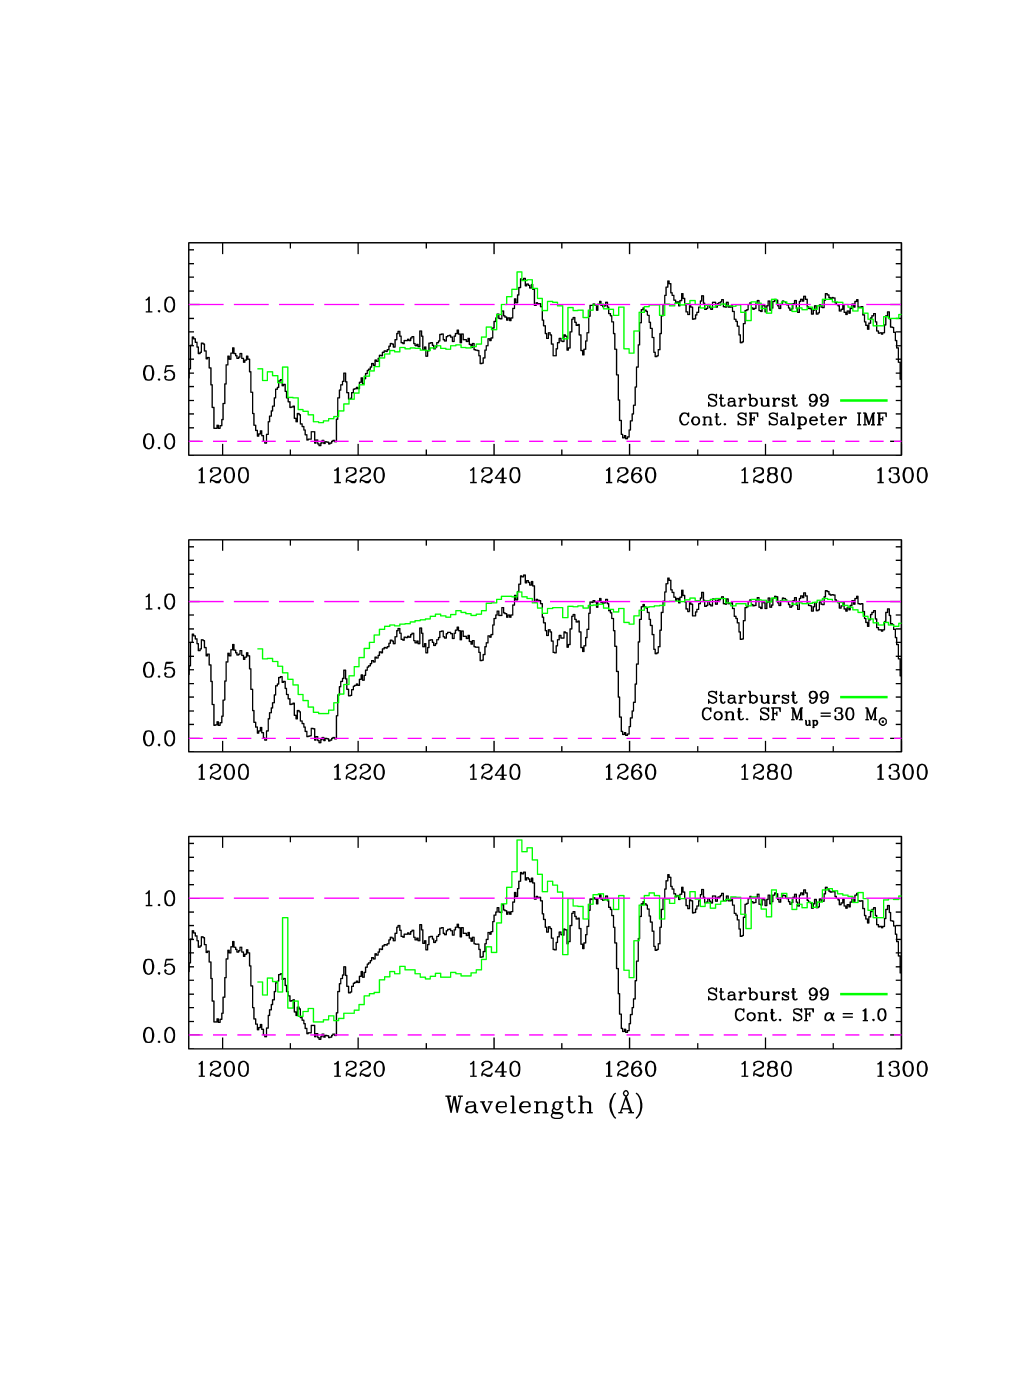
The wavelength regions of most interest for spectral synthesis are those encompassing the C IV and N V lines; in Figures 2 and 3 respectively we compare them with the predictions of different Starburst99 models, all for a 20 Myr old continuous star formation episode.111The model spectra shown are the rectified versions, in which the stellar continuum has been divided out. In these continuous star formation models there is only a minor dependence of the stellar features on the age of the star formation episode. Before discussing these figures it is important to clarify that the comparison between models and observations involves only the stellar lines and that no attempt is made to fit the interstellar lines in the spectrum. The Starburst99 models are constructed from libraries of IUE spectra of Galactic (and therefore relatively nearby) O and B stars; in general these stars have much weaker interstellar absorption than that seen through an entire galaxy. In Figures 2 and 3 most of the interstellar lines can be recognized from their narrower widths or by reference to Table 2 below. With this point in mind, it is evident from Figure 2 that the models provide a remarkably good fit to the broad spectral features in the C IV region. Note that no adjustment was made in order to match observations and models, other than dividing the observed wavelength scale by the value of () deduced above.
Focussing on the C IV line itself, we note that it consists of three components. Two components make up the P Cygni stellar line: redshifted emission and a broad absorption trough which extends to 1534.25 Å corresponding to a terminal wind velocity km s-1 after correcting for the instrumental resolution. Superimposed on the stellar line are the narrower C IV interstellar doublet lines which reach nearly zero residual intensity. The profile of the stellar C IV line can be used to place limits on the IMF in this distant star forming galaxy, as shown in Figure 2. In the top panel we see that a Salpeter IMF, with slope and upper mass limit reproduces well the emission component of the P Cygni profile (although it overpredicts the optical depth of the absorption trough—but see below). If is reduced to the P Cygni emission is lost altogether (middle panel); indeed the existence of a P Cygni C IV profile in itself implies that O stars with masses greater than must be present (Leitherer, Robert, & Heckman 1995). A similar discrepancy between the observed and predicted C IV profiles is found if a steeper IMF () is adopted (while maintaining ). Conversely, a flatter IMF (), as proposed for example by Massey, Johnson, & DeGioia-Eastwood (1995), greatly overproduces C IV emission (bottom panel of Figure 2). As can be seen from Figure 3, similar considerations apply to the N V line (which is also a blend of stellar P Cygni emission-absorption, and interstellar absorption). We conclude that there is no evidence of a departure from a Salpeter IMF (at least at the high mass end) in the star formation episode taking place in cB58.
We now turn to the strength of the P Cygni absorption which, as noted above, is observed to be weaker in cB58 than in the best fitting Starburst99 model. The optical depth of the trough is sensitive to the mass loss rate (e.g. Lamers, et al. 1999); for a star of a given spectral and luminosity class the mass loss rate decreases with decreasing metallicity (e.g. Puls et al. 1996). Comparisons of O and B stars in the Milky Way and in the Magellanic Clouds (e.g. Walborn et al. 1995; Lennon 1999) have shown a clear trend of decreasing strength of C IV absorption as the carbon abundance decreases from , to , and to of the solar value, from the Milky Way near the Sun, to the LMC, and to the SMC respectively. The trend is most obvious in main sequence stars and an analogous effect is seen in Si IV and N V. Theoretically, one may expect a metallicity dependence of the mass loss rate of the form , with in the range (see eq. 8.63 of Kudritzki 1998).
It thus seems at least plausible that the difference between observations and model in the top panels of Figures 2 and 3 is an indication that the metallicity of the OB stars in cB58 is lower than that of the solar neighbourhood stars which make up the libraries of stellar spectra of Starburst99. In the future, when the Starburst99 data base is extended to include stars in the Magellanic Clouds, it may be possible to calibrate empirically the metallicity dependence of this effect and use spectral synthesis techniques to measure the metal abundance of high redshift galaxies. For the moment, our best estimate of the metallicity of cB58 is that it is below solar, and comparable to that of the Magellanic Clouds. The preliminary results by Robert et al. (1999, in preparation), as described by Leitherer (1999), would favour a value closer to that of the LMC on the basis of the Si IV P-Cygni profile which is nearly absent in SMC stars, but is still present in cB58 (see Figure 1).
In summary, the stellar spectrum of cB58, when compared with the predictions of the best available spectral synthesis models, leads us to conclude that: (a) this galaxy is undergoing a protracted period of star formation; (b) there is no evidence for departure from a Salpeter IMF extending to ; and (c) the metallicity is below solar by a factor of a few.
Finally, we draw attention to the fact that the
Al III doublet lines may also include
a stellar wind component, as they seem to exhibit asymmetric blue
wings not dissimilar from that seen in C IV (see
Figure 1). The Al III doublet can be very strong in early B-type
supergiants, so that a contribution to the integrated spectrum of
cB58 is not implausible.
With better data and more
extensive stellar libraries it should be possible in future to
use this spectral feature, together with C IV, Si IV and N V, to
refine further the spectral synthesis modelling of young stellar
populations.
4 INTERSTELLAR ABSORPTION LINES
As can be seen from Figure 1, the spectrum of cB58 is dominated by interstellar lines. We identify 29 lines, listed in Table 2, due to elements ranging from hydrogen to nickel in ionization stages ranging from C I to N V. The internal redshift agreement is excellent; we deduce a mean absorption redshift (). The lines are very strong, indicating that the absorption takes place over a wide velocity interval; for example the FWHM of Si II and Al II imply a velocity spread of 530 km s-1 (after correction for the instrumental resolution). Evidently, the interstellar medium of this galaxy has been stirred to high speeds presumably by the mechanical energy deposited by the massive stars through stellar winds and supernovae.
As discussed below (§6), the Lyman line in cB58 includes a damped absorption component with (H I) cm-2. At first glance the interstellar absorption spectrum of cB58 is not dissimilar from that of many damped Lyman systems (DLAs), although there are notable differences. The compilation of line profiles by Prochaska & Wolfe (1999) provides a useful comparison. The widths of the low ionization lines are greater in cB58 than in most DLAs, where Si II and Al II are seldom wider than 200 km s-1. Most significantly, absorption lines from the fine structure levels of the ground state of Si II, which are rarely detected in DLAs, are exceedingly strong in cB58, with rest frame equivalent widths Å (lines 10 and 20 in Table 2). These levels are populated by collisions with electrons and hydrogen atoms (Keenan et al. 1985), so that the absorption lines we see must be formed in gas of higher density than that sampled by DLAs in random sight-lines to background QSOs. In our Galaxy unusually prominent fine structure lines have been seen in regions of violent star formation, such as the Carina nebula (Laurent, Paul, & Pettini 1982), and in interstellar clouds compressed by the passage of a supernova induced shock, as in the Vela supernova remnant (Jenkins & Wallerstein 1995); finding such strong Si II∗ absorption in cB58 is therefore not surprising. With higher resolution observations it may be possible (depending on line saturation) to measure the ratio (Si II∗)/(Si II) and deduce the electron density .
The resolving power of our spectrum is about one order of magnitude lower than that normally required to measure element abundances from interstellar absorption lines. Nevertheless, it is instructive to consider the values which result if we make some simple assumptions. We restrict ourselves to the weakest lines in the spectrum, with rest frame equivalent width Å, and assume that saturation effects are unimportant to derive the ion column densities listed in column (6) of Table 3. For Ni II we use the latest -values from the radiative lifetime measurements by Fedchack & Lawler (1999), and scale the earlier determinations by Morton (1991) and Zsargó & Federman (1998) accordingly (a reduction by a factor of 1.9). The five Ni II transitions covered give internally consistent values of (Ni II). With (H I) cm-2 deduced in §6 below and the assumption that most of the Si II, S II and Ni II are associated with the H I gas, we deduce the abundances in column (7) of Table 3, and from these arrive at the abundances relative to solar given in column (9), in the usual notation.
The abundances derived are between 1/3 and 1/5 of solar,
ostensibly in good
agreement with our earlier conclusion
from the analysis of the stellar spectrum.
(§3). However, until higher resolution observations are
available, these interstellar estimates remain highly uncertain.
On the one hand, we
may have overestimated the metallicity if the H II gas
along the line of sight accounts for a significant proportion
of the first ions (see §5 below).
On the other hand, if any saturated components contribute to the
absorption line equivalent widths, the abundances in Table 3 are
underestimates. Some of these corrections probably apply because
we would have expected some dust depletion of Ni
(a refractory element) relative
to S (Savage & Sembach 1996), whereas none is seen.
5 DUST EXTINCTION
The spectra of O and early B stars continue to rise in the far-UV peaking near 1000 Å (e.g. Hubeny & Lanz 1996). Model predictions of the integrated light from galaxies with on-going star formation show that in the region between 1800 and 1250 Å the continuum can be approximated by a power law of the form , with for a range of metallicities and ages. The Starburst99 model used here (continuous star formation, 20 Myr, Salpeter IMF, solar metallicity) predicts . In contrast, it can be seen from Figure 1 that the continuum in cB58 (in units) decreases with decreasing wavelength; we measure .222This slope is consistent with the broad band photometry of Ellingson et al. (1996). Given the presence in the spectrum of discrete features from OB stars and of strong interstellar metal lines, the most straightforward interpretation of this difference between observations and model predictions is that the UV continuum is reddened by dust extinction.
To make further progress it is necessary to make some assumptions about the unknown properties of dust in cB58. One possibility is to use the Magellanic Clouds as guidelines, given the similarity in metallicity deduced above. Adopting the wavelength dependence of the ultraviolet extinction of the LMC (Fitzpatrick 1986) with the normalization by Pei (1992), we find that
| (1) |
and
| (2) |
where is the difference between observed and predicted spectral slopes in the interval 1250–1800 Å and is the dust extinction in magnitudes at 1500 Å. With these parameters we deduce and mag (a factor of ). The steeper UV rise of the SMC reddening curve (Bouchet et al. 1985) leads to
| (3) |
and
| (4) |
and therefore to the lower estimates, and mag. The extinction properties of dust associated with the 30 Dor giant H II region in the LMC (Fitzpatrick 1986) would yield values intermediate between these two possibilities, while the attenuation law derived by Calzetti (1997) for local starburst galaxies would give and mag. This value of is in the upper quartile of the distribution for the whole sample considered by Steidel et al. (1999a); evidently cB58 is among the more reddened Lyman break galaxies.
Locally, there is a close correlation between the column densities of gas and dust which in the Milky Way takes the form
| (5) |
with a standard deviation of approximately 0.19 dex in the sample of 392 OB stars compiled by Diplas & Savage (1994). Although based on a much smaller number of measurements, it seems well established that the gas-to-dust ratios are larger than this value in the LMC and the SMC, by factors of and respectively (Fitzpatrick 1989), presumably reflecting the lower metallicity of these galaxies. Thus, the values of deduced above would imply neutral hydrogen column densities (H I) and cm-2 for LMC and SMC conditions respectively.
These values are times larger than that measured from the damped profile of the Lyman absorption line (see §6 below); expressed in a different way, we apparently see a larger dust-to-gas ratio than expected, by a factor of several. Perhaps it is unrealistic to expect better internal agreement in such estimates given the many assumptions involved, and it is certainly possible that we have overestimated the dust exctinction (if the Starburst99 models predict a continuum slope that is too blue), or understimated the metallicity. On the other hand, this discrepancy may be telling us that more than 2/3 of the gas in front of the stars is not in atomic form, but rather is ionized and/or molecular hydrogen.
The values of dust extinction derived above help us estimate the star formation rate of cB58 from its UV continuum luminosity. Ellingson et al. (1996) reported AB which at implies erg s-1 Hz-1 ( km s-1 Mpc-1; ). The Bruzual & Charlot (1996, private communication) models provide a calibration of in terms of the star formation rate; assuming an IMF with the Salpeter slope down to , solar metallicity, and continuous star formation over a period of 100 Myr, yr-1 produces erg s-1 Hz-1 (the dependence of this scaling on metallicity and age is a small effect compared with the other uncertainties discussed below). From this we deduce a ‘best value’
| (6) |
where the values in brackets are correction factors respectively for gravitational lens amplification (Seitz et al. 1998), dust extinction (this work), and the IMF (Leitherer (1998) has proposed that estimates of SFR based on an extrapolation of the Salpeter IMF down to should be reduced by a factor of 2.5 to account for the observed flattening of the IMF below , e.g. Sirianni et al. 1999; Zoccali et al. 1999).
The ‘raw’ value of SFR implied by the UV continuum luminosity,
without any of the above corrections,
SFR yr-1,
is times higher than
SFR yr-1
(for the cosmology used here)
deduced by Bechtold et al. (1997) from narrow-band imaging
in H, which is redshifted
near the edge of the infrared -band window at
2.4426 m.
These authors considered several possible
explanations for the discrepancy, including
higher obscuration of the
emission line gas,
leakage of ionizing photons from the H II region,
time-dependent ionization effects, and
differences in the degree of gravitational magnification
across the source. An additional,
simpler, possibility is that the narrow-band
observations
may have underestimated the true H luminosity.
An -band spectrum recorded by G. Wright (1999, private
communication) with CGS4 on UKIRT shows a clear continuum and an
H emission line with an integrated flux
of ergs s-1 cm-2.
If we assume a ratio H/H (Osterbrock 1989),
the predicted H flux is times higher
than the value
() ergs s-1 cm-2 reported by
Bechtold et al. (1997);
dust extinction in the Balmer lines
would increase the difference further.
The H flux measured with UKIRT
is in good agreement with the luminosity and reddening
of the far-UV continuum
derived above, as found for other
Lyman break galaxies (Pettini et al. 1998a).
6 Ly AND LARGE SCALE OUTFLOWS
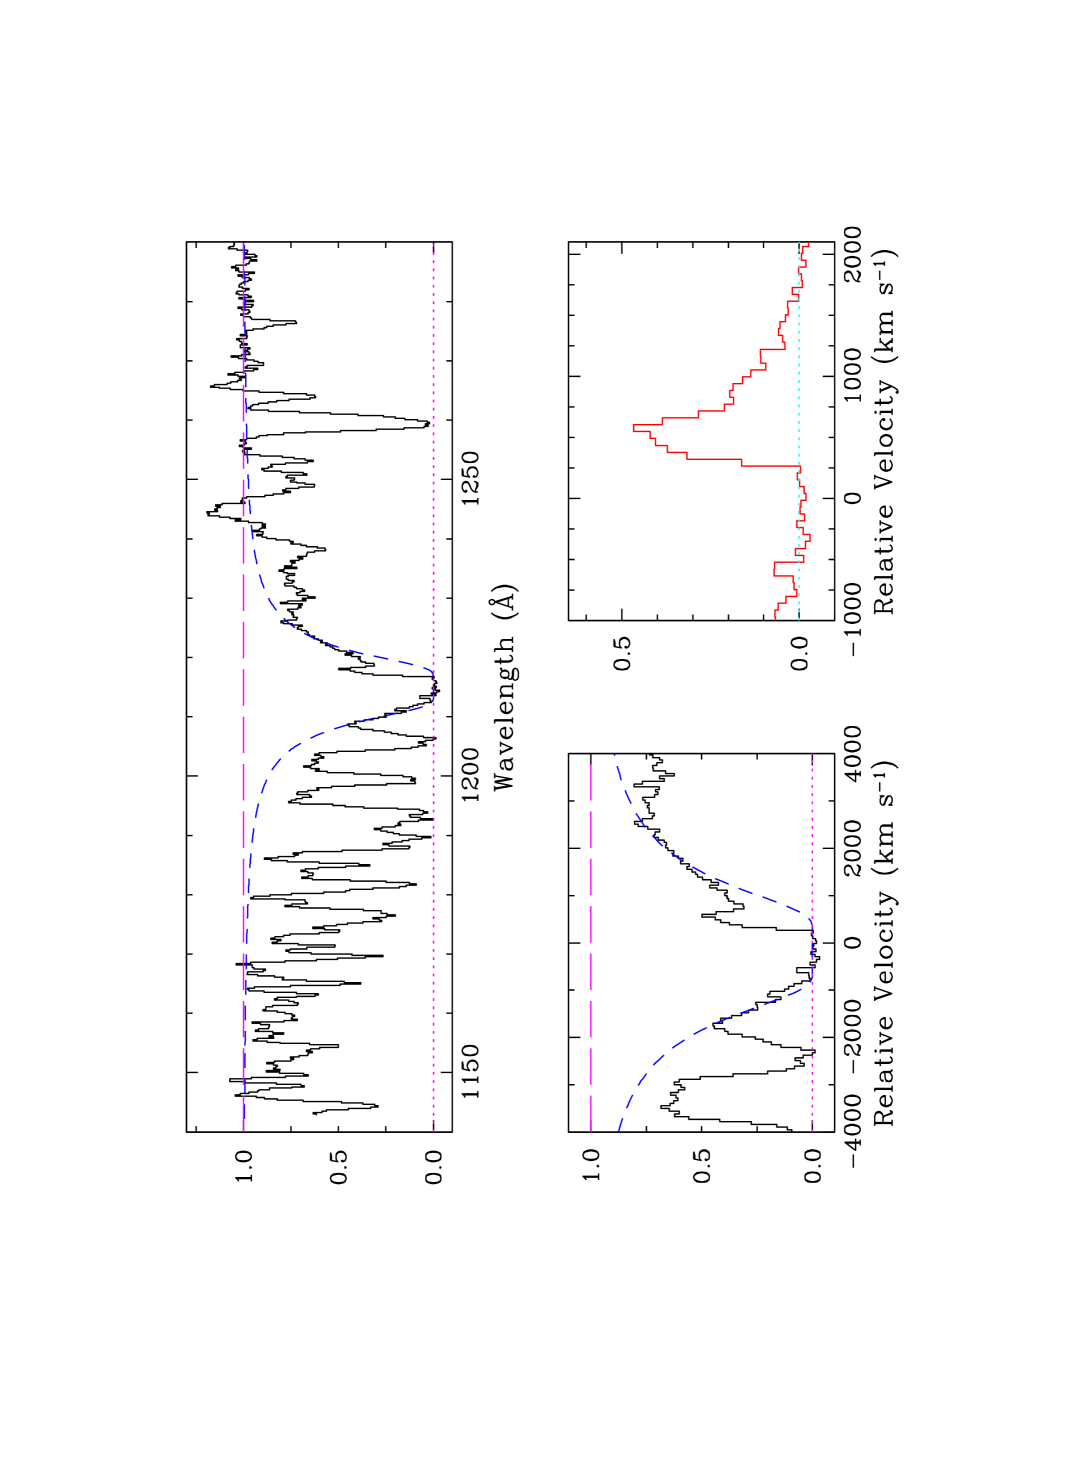
The Lyman line in cB58 is a blend of absorption and emission. In Figure 4 we show our decomposition of this feature. The damping wings are well fitted with a column density (H I) cm-2 centred at , in good agreement with the redshifts of the other interstellar absorption lines (see Table 2). Subtraction of the damped Lyman absorption then reveals a redshifted Lyman emission line (bottom right-hand panel of Figure 4), exhibiting a highly asymmetric shape with a peak near km s-1, a sharp drop on the blue side, and a tail of emission which apparently extends to beyond 1000 km s-1 (velocities relative to ). This profile is remarkably similar to that seen in another bright Lyman break galaxy, Q0000263 D6 (see Fig.8 of Pettini et al. 1998b).
More generally, redshifted Lyman emission is often seen in high redshift galaxies (Pettini et al. 1998a and references therein), and in local H II and starburst galaxies (Kunth et al. 1998; González Delgado et al. 1998). The explanation commonly put forward involves large scale outflows in the interstellar media of the galaxies observed. In this picture Lyman emission is suppressed by resonant scattering and the only Lyman photons which can escape unabsorbed in our direction are those back-scattered from the far side of the expanding nebula, whereas in absorption against the stellar continuum we see the approaching part of the outflow.
The data presented here are consistent with this scenario and indeed provide a better measurement of the velocity fields involved than previous observations. Before discussing the kinematics further, we draw attention to a number of weak emission lines which can be recognized from close inspection of Figure 1 and which are listed in Table 4. While weak, these features are undoubtedly real (they are significant at the many level—see column (6) of Table 4); we tentatively interpret them as recombination lines to the fine structure levels of the ground states of C II and Si II, presumably arising in an H II region. The internal redshift agreement is acceptable, as can be seen from column (5) of Table 4. The corresponding resonance lines, which are not detected, are intrinsically weaker and are subject to strong absorption by foreground gas, as is Lyman . Such radiation transfer effects in C II have been seen in low-excitation planetary nebulae (e.g. Clavel, Flower, & Seaton 1981).
Interestingly, we also see N IV]. This is normally a stellar line, and indeed it can be recognized in the Starburst99 models reproduced in Fig. 2. However, in cB58 its measured wavelength seems to agree better (although the line is noisy) with the redshift of the other weak emission lines in Table 4 than with that of the stellar photospheric lines in Table 1. The spectrum in Figure 1 also shows evidence for C III] emission, but the existing data are too noisy for a reliable measurement of this feature.
Table 5 summarizes the velocity measurements. Evidently, the interstellar medium in cB58 is expanding with a bulk velocity of km s-1; the Lyman line, which is most sensitive to resonant scattering effects, picks out the gas at the highest velocities. Our measurements support the broad picture of the kinematics of starburst galaxies considered most recently by Tenorio-Tagle et al. (1999) in which the mechanical energy deposited by the massive stars and supernovae leads to the formation of a cavity filled with hot ejecta and surrounded by an expanding shell of swept up interstellar material. The ensuing outflows, which seem to be a common feature of starburst galaxies, have potentially several important consequences. First, they provide the feedback required for self-regulation of the star-formation activity. Second, they are a mechanism for distributing the products of stellar nucleosynthesis over large volumes. Third, they may lead to the escape of Lyman continuum photons from the galaxies, if the cavity created by the expanding superbubble breaks through the ISM, with important consequences for the ionization of the intergalactic medium at high redshift (Madau, Haardt, & Rees 1999).
We can estimate the mass loss rate involved by considering the flow of mass through a unit area (assuming spherical symmetry):
| (7) |
where is the radius of the superbubble, is the matter density, is the speed of the outflow and is the mean particle mass. If we assume that all the material within the superbubble has been swept-up into a shell of thickness and density , we can substitute the column density
| (8) |
in eq. (7) to obtain
| (9) |
where all the quantities on the right-hand side are measured, except for the radius of the superbubble. Adopting kpc as a working value (Tenorio-Tagle et al. 1999), we obtain
| (10) |
or three times higher if neutral hydrogen accounts for only 1/3 of the total column of gas in front of the stars, as discussed above (§5).
Thus we find that, within the uncertainties,
the mass loss rate due to the galactic
superwind is comparable to
the rate at which gas is
turned into stars (eq. (6)).
It remains to be established what the fate of the outflowing
interstellar material is, that is whether it leaves the galaxy
altogether, or remains trapped in its potential well until it can cool
and rain back onto the galaxy.
If the initial estimates of the masses of Lyman break galaxies by
Pettini et al. (1998a) are typical (),
the gas may well remain bound (Ferrara & Tolstoy 1999).
7 INTERVENING ABSORPTION LINES
The spectrum of cB58 shows a number of narrow absorption lines produced by gas along the line of sight to this high redshift galaxy. A rich Lyman forest is evident in Figure 1 shortwards of 1200 Å; we have not attempted to measure wavelengths and equivalent widths of individual absorption features in the forest because at the resolution of the present data they are all blends. Intervening lines longwards of Lyman are listed in Table 6 and marked in Figure 1. We identify two Mg II absorption systems at and 1.3391 respectively. The latter is likely to have (H I) cm-2 on the basis of the relatively large value of the (Fe II )/(Mg II ) ratio (Bergeron & Stasińska 1986); note also the strength of Mg I . It will be interesting to search for galaxies at these redshifts in deep images of the cluster MS 1512+36. Our spectrum does not cover any strong absorption lines which may be due to the cluster itself, at (Gioia & Luppino 1994); at this redshift the Mg II doublet would fall at 3841.5 Å. We see no absorption at the wavelength of Ca II to a formal equivalent width limit () Å.
We apparently detect Na I (the Na D2 line) from the disk and halo of our own Galaxy, although its anomalously large equivalent width and the absence of the other member of the doublet suggest that these features have probably been affected by the subtraction of telluric Na I emission. Two narrow absorption lines (I 10 and I 11 in Figure 1) remain unidentified.
8 SUMMARY AND CONCLUSIONS
Thanks to gravitational magnification by a factor of , MS 1512cB58 offers a unique insight into the physical properties of star forming galaxies at high redshift. We have used LRIS on the Keck telescope to secure an intermediate resolution (0.8 Å), high S/N ratio () spectrum covering the wavelength interval 1145–1930 Å in the rest frame of this galaxy (). The observations have revealed a wealth of spectral features from the stars and the interstellar medium of cB58, as well as foreground galaxies and the intergalactic medium along the line of sight. From the analysis of these data we arrive at the following main results:
1. Spectral synthesis models based on libraries of O and B stars are remarkably successful in reproducing the observed stellar spectrum. Evidently, the ultraviolet spectral properties of at least this high redshift galaxy are very similar to those of local starbursts. The P-Cygni profiles of C IV and N V are best reproduced by a continuous star formation model with a Salpeter IMF which extends to beyond 50 ; we can exclude both a flatter IMF and an IMF lacking in the most massive stars.
2. Both stars and gas show evidence for a relatively high degree of metal enrichment—we estimate the metallicity to be of solar. This value is times higher than the typical metallicity of damped Lyman systems at the same redshift (Pettini et al. 1997). This finding is not surprising, given that we are viewing directly a region of active star formation, and is consistent with the proposal that damped Lyman systems may preferentially trace diffuse gas where star formation proceeds more slowly than in the compact, high density regions we see as Lyman break galaxies (Mo, Mao, & White 1999; Pettini et al. 1999).
3. The ultraviolet continuum is redder than that of the OB stars whose spectral signatures we see directly, probably as a result of dust extinction; we deduce (), depending on the shape of the extinction curve. The implied dust-to-gas ratio is a few times larger than expected, suggesting that we have either underestimated the metallicity or that most of the gas is in ionized and/or molecular form.
4. The relative velocities of interstellar absorption lines, stellar photospheric lines, H II region emission lines, as well as the highly asymmetric profile of the Lyman emission line, are all consistent with a picture in which the mechanical energy deposited by the starburst has produced a shell of swept up interstellar matter which is expanding with a velocity of km s-1. We estimate a mass outflow rate, , which is comparable to the star formation rate, , deduced from the UV luminosity ( km s-1 Mpc-1; ) corrected for dust extinction and gravitational magnification. Such galactic winds, which seem to be a common feature of star forming galaxies at all redshifts, could be the mechanism which regulates star formation, distributes the metals over large volumes, and allows the escape of ionizing photons into the intergalactic medium.
5. Among the intervening absorption we find two Mg II systems—one of which is likely to be damped—indicating the presence of galaxies at and close to the sight-line to cB58.
Future observations of cB58 will undoubtedly include the familiar rest frame optical emission lines from H II regions, which fall in the H and K near-infrared bands. In the rest frame UV, longer exposures should lead to the detection of C III] and O III] (Garnett et al. 1995). These nebular lines will provide measurements of abundances and reddening from the ionized gas. Higher resolution spectra, which are feasible with a dedicated effort, may allow the determination of the relative abundances of different elements and offer chemical clues to the previous star formation history. For example, an enhancement of the alpha elements relative to Fe-peak elements ([S/Zn] would probably be the best probe of this effect), would be an indication of a rapid timescale for metal enrichment, possibly linking galaxies like cB58 to today’s bulges. With higher spectral resolution it should also be possible to search for absorption by molecular hydrogen whose level populations are sensitive to temperature, density, and the intensity of the far-UV radiation field. Resolving the fine-structure levels of C I will give a direct measure of pressure in the neutral component of the ISM.
Finally, the data presented here highlight the power of high resolution studies of Lyman break galaxies. The ability to probe deeply into the physics and chemistry of these objects is a strong motivation for future targeted searches to identify other examples of distant galaxies gravitationally lensed by foreground clusters.
References
- (1)
- (2) Adelberger, K.L., Steidel, C.C., Giavalisco, M., Dickinson, M., Pettini, M., & Kellogg, M. 1998, ApJ, 505, 18
- (3)
- (4) Anders, E., & Grevesse, N. 1989, Geochim. Cosmochim. Acta, 53, 197
- (5)
- (6) Bechtold, J., Yee, H.K.C., Elston, R., & Ellingson, E. 1997, ApJ, 477, L29
- (7)
- (8) Bergeron, J., & Stasińska, G. 1986, A&A, 169, 1
- (9)
- (10) Bergeson, S.D., & Lawler, J.E. 1993, ApJ, 414, L137
- (11)
- (12) Bouchet, P., Lequeux, J., Maurice, E., Prevot, L., & Prevot-Burnichon, M.L. 1985, A&A, 149, 330
- (13)
- (14) Calzetti, D. 1997, in The Ultraviolet Universe at at Low and High Redshift: Probing the Progress of Galaxy Evolution, ed. W.H. Waller, M.N. Fanelli, J.E. Hollis, & A.C. Danks (New York: Woodbury), 403
- (15)
- (16) Clavel, J., Flower, D.R., & Seaton, M.J. 1981, MNRAS, 197, 301
- (17)
- (18) Conti, P.S., Leitherer, C., & Vacca, W.D. 1996, ApJ, 461, L87
- (19)
- (20) Ellingson, E., Yee, H.K.C., Bechtold, J., & Elston, R. 1996, ApJ, 466, L71
- (21)
- (22) Diplas, A., & Savage, B.D. 1994, ApJ, 427, 274
- (23)
- (24) Fedchak, J.A., & Lawler, J.E. 1999, ApJ, in press
- (25)
- (26) Ferrara, A., & Tolstoy, E. 1999, MNRAS, submitted (astro-ph/9905280)
- (27)
- (28) Fitzpatrick, E.L. 1986, AJ, 92, 1068
- (29)
- (30) Fitzpatrick, E.L. 1989, in Interstelar Dust, ed. L.J. Allamandola, & A.G.G.M. Tielens (Dordrecht: Kluwer), 37
- (31)
- (32) Garnett, D.R., Skillman, E.D, Dufour, R.J., Peimbert, M., Torres-Peimbert, S., Terlevich, R., Terlevich, E., & Shields, G.A. 1995, ApJ, 443, 64.
- (33)
- (34) Giavalisco, M., Steidel, C.C., Adelberger, K.L., Dickinson, M.E., Pettini, M., & Kellogg, M. 1998, ApJ, 503, 543
- (35)
- (36) Gioia, I.M., & Luppino, G.A. 1994, ApJS, 94, 583
- (37)
- (38) González Delgado, R.M., Leitherer, C., Heckman, T., Lowenthal, J.D., Ferguson, H.C., & Robert, C. 1998, ApJ, 495, 698
- (39)
- (40) Heckman, T.M., Robert, C., Leitherer, C., Garnett, D.R., & van der Rydt, F. 1998, ApJ, 503, 646
- (41)
- (42) Heckman, T.M., & Leitherer, C. 1997, AJ, 114, 69
- (43)
- (44) Howarth, I.D. 1987, MNRAS, 226, 249
- (45)
- (46) Hu, E.M., Cowie, L.L., & McMahon, R.G. 1998, ApJ, 502, L99
- (47)
- (48) Hubeny, I. & Lanz, T. 1996, in Astrophysics in the Extreme Ultraviolet, ed. S., Bowyer, & R.F. Malina (Dordrecht: Kluwer), 381
- (49)
- (50) Jenkins, E.B., & Wallerstein, G. 1995, ApJ, 440, 227
- (51)
- (52) Keenan, F.P., Johnson, C.T., Kingston, A.E., & Dufton, P.L. 1985, MNRAS, 214, 37P
- (53)
- (54) Kudritzki, R.P. 1998, in Stellar Astrophysics for the Local Group, ed. A. Aparicio, A. Herrero, & F. Sánchez (Cambridge: CUP), 149
- (55)
- (56) Kunth, D., Mas-Hesse, J.M., Terlevich, E., Terlevich, R., Lequeux, J., & Fall, S.M. 1998, A&A, 334, 11
- (57)
- (58) Lamers, H.J.G.L.M., Haser, S., de Koter, A., & Leitherer, C. 1999, ApJ, 516, 872
- (59)
- (60) Laurent, C., Paul, J.A., & Pettini, M. 1982, ApJ, 260, 163
- (61)
- (62) Leitherer, C. 1996, in WR Stars in the Framework of Stellar Evolution, 33rd Liège Int. Astroph. Coll.,
- (63)
- (64) Leitherer, C. 1998, in Dwarf Galaxies and Cosmology, ed. Trinh X. Thuan, C. Balkowski, V. Cayatte, & Tranh Thanh Van (Paris: Editions Frontieres), in press (STScI preprint no. 1254)
- (65)
- (66) Leitherer, C. 1999, in Lecture Notes in Physics, ed. J. Walsh & M. Rosa (Berlin: Springer), in press (STScI preprint no. 1312)
- (67)
- (68) Leitherer, C., et al. 1999, ApJS, in press
- (69)
- (70) Leitherer, C., Robert, C., & Heckman, T.M., 1995, ApJS, 99, 173
- (71)
- (72) Leitherer, C., Vacca, W.D., Conti, P.S., Filippenko, A.V., Robert, C., & Sargent, W.L.W. 1996, ApJ, 465, 717
- (73)
- (74) Lennon, D.J. 1999, Rev. Mex. Astr. Ap., in press
- (75)
- (76) Lowenthal, J. et al. 1997, ApJ, 481, 673
- (77)
- (78) Madau, P., Haardt, F., & Rees, M.J. 1999, ApJ, 514, 648
- (79)
- (80) Massey, P., Johnson, K.E. & DeGioia-Eastwood, K. 1995, ApJ, 454, 151
- (81)
- (82) Meurer, G.R., Heckman, T.M., Lehnert, M.D., Leitherer, C., & Lowenthal, J. 1997, AJ, 114, 54
- (83)
- (84) Mo, H.J., Mao, S., & White, S.D.M. 1999, MNRAS, 304, 175
- (85)
- (86) Morton, D.C. 1991, ApJS, 77, 119
- (87)
- (88) Oke, J. B. et al. 1995, PASP 107, 3750
- (89)
- (90) Osterbrock, D.E. 1989, Astrophysics of Gaseous Nebulae and Active Galactic Nuclei (Mill Valley: University Science Books)
- (91)
- (92) Pei, Y.C. 1992, ApJ, 395, 130
- (93)
- (94) Pettini, M., Ellison, S.L., Steidel, C.C., & Bowen, D.V. 1999, ApJ, 510, 576
- (95)
- (96) Pettini, M., Kellogg, M., Steidel, C.C., Dickinson, M., Adelberger, K.L., & Giavalisco, M. 1998a, ApJ, 508, 539
- (97)
- (98) Pettini, M., Smith, L.J., King, D.L., & Hunstead, R.W. 1997, ApJ, 486, 665
- (99)
- (100) Pettini, M., Steidel, C.C., Adelberger, K.L., Kellogg, M., Dickinson, M., & Giavalisco, M. 1998b, in Cosmic Origins: Evolution of Galaxies, Stars, Planets, and Life, ed. J.M. Shull, C.E. Woodward, & H.A. Thronson (San Francisco: ASP), 67
- (101)
- (102) Prochaska, J.X., & Wolfe, A.M. 1999, ApJS, in press (astro-ph/9810381)
- (103)
- (104) Puls, J., et al. 1996, A&A, 305, 171
- (105)
- (106) Rogerson, J.B., & Ewell, M.W. 1985, ApJS, 58, 265
- (107)
- (108) Rogerson, J.B., & Upson, W.L. 1977, ApJS, 35, 37
- (109)
- (110) Savage, B.D., & Sembach, K.R. 1996, ARA&A, 34, 279
- (111)
- (112) Seitz, S., Saglia, R.P., Bender, R., Hopp, U., Belloni, P., & Ziegler, B. 1998, MNRAS, 298, 945
- (113)
- (114) Sirianni, M., Nota, A., Leitherer, C., De Marchi, G., & Clampin, M. 1999, ApJ, submitted
- (115)
- (116) Steidel, C.C., Adelberger, K.L., Giavalisco, M., Dickinson, M., & Pettini, M. 1999a, ApJ, 519, 1
- (117)
- (118) Steidel, C.C., et al. 1999b, in preparation
- (119)
- (120) Steidel, C.C., Giavalisco, M., Pettini, M., Dickinson, M., & Adelberger, K.L. 1996, ApJ, 462, L17
- (121)
- (122) Tenorio-Tagle, G., Silich, S.A., Kunth, D., Terlevich, E., & Terlevich, R. 1999, MNRAS, in press (astro-ph/9905324)
- (123)
- (124) Trager, S.C., Faber, S.M., Dressler, A., & Oemler, A. 1997, ApJ, 485, 92
- (125)
- (126) Walborn, N.R., Nichols-Bohlin, J., & Panek, R.J. 1985, NASA Reference Publication 1155
- (127)
- (128) Walborn, N.R., Lennon, D.J., Haser, S.M., Kudritzki, R., & Voels, S.A. 1995, PASP, 107, 104.
- (129)
- (130) Williams, L.L.R., & Lewis, G.F. 1997, MNRAS, 281, L35
- (131)
- (132) Yee, H.K.C., Ellingson, E., Bechtold, J., Carlberg, R.G., & Cuillandre, J.-C. 1996, AJ, 111, 1783
- (133)
- (134) Zoccali, M., Cassisi, S., Frogel, J.A., Gould, A., Ortolani, S., Renzini, A., Rich, R.M., & Stephens, A.W. 1999, ApJ, submitted (astro-ph/9906452)
- (135)
- (136) Zsargó, J., & Federman, S.R. 1998, ApJ, 498, 256
- (137)
| Line | Ion | (Å) | (Å) | |
|---|---|---|---|---|
| 1 | Si III | 1294.543 | 4825.88 | 2.728 |
| 2a | C III | 1296.33 | ||
| 2b | Si III | 1296.726 | } 4832.81 | 2.727 |
| 3a | C II | 1323.929 | ||
| 3b | N III | 1324.316 | } 4934.71 | 2.727 |
| 4 | O IV | 1343.354 | 5005.59 | 2.726 |
| 5 | Si III | 1417.237 | 5282.53 | 2.727 |
| 6 | C III | 1427.85 | 5321.24 | 2.727 |
| 7 | S V | 1501.76 | 5594.59 | 2.725 |
| 8 | N IV | 1718.551 | 6403.82: | 2.726: |
| Mean |
| Line | Ion | (Å) | (Å) | (Å) | Comments | |
|---|---|---|---|---|---|---|
| 1 | Si II | 1190.4158 | 4433.07: | 2.7240: | … | Blended |
| 2 | Si II | 1193.2897 | 4444.10: | 2.7242: | … | Blended |
| 3 | N I | 1199.9674 | 4468.80 | 2.7241 | 1.71 A | Multiplet |
| 4 | Si III | 1206.500 | 4493.62 | 2.7245 | 2.83 A | |
| 5 | H I | 1215.6701 | 4527.16 | 2.7240 | … | Blended |
| 6 | N V | 1238.821 | 4613.64 | 2.7242 | … | Blended |
| 7 | S II | 1253.811 | 4669.64 | 2.7244 | 0.45 A | |
| 8 | S II | 1259.519 | ||||
| 9 | Si II | 1260.4221 | } 4693.48 | … | 2.87 A | |
| 10 | Si II* | 1264.7377 | 4709.15 | 2.7234 | 0.55 A | |
| 11 | C I | 1277.4626 | 4755.64 | 2.7227 | 0.33 A | |
| 12 | O I | 1302.1685 | 4849.61: | 2.7243: | ||
| 13 | Si II | 1304.3702 | 4857.66: | 2.7241: | } 4.39 A | |
| 14 | Ni II | 1317.217 | 4906.66 | 2.7250 | 0.20 B | Blended? |
| 15 | C II | 1334.5323 | 4970.22 | 2.7243 | 3.46 A | |
| 16 | Ni II | 1370.132 | 5102.58 | 2.7241 | 0.27 A | |
| 17 | Si IV | 1393.755 | 5190.88 | 2.7244 | 1.94 A | |
| 18 | Si IV | 1402.770 | 5224.01 | 2.7241 | 1.42 A | |
| 19 | Si II | 1526.7066 | 5685.56 | 2.7241 | 2.72 A | |
| 20 | Si II* | 1533.4312 | 5710.34 | 2.7239 | 0.59 A | |
| 21 | C IV | 1548.195 | 5765.52 | 2.7240 | ||
| 22 | C IV | 1550.770 | 5775.88 | 2.7245 | } 3.8 B | Blended with stellar C IV |
| 23 | Fe II | 1608.4511 | 5990.21 | 2.7242 | 1.12 A | |
| 24 | Al II | 1670.7874 | 6221.37 | 2.7236 | 2.81 A | |
| 25 | Ni II | 1709.600 | 6366.02 | 2.7237 | 0.29 C | |
| 26 | Ni II | 1741.549 | 6485.67 | 2.7241 | 0.42 C | |
| 27 | Ni II | 1751.910 | 6527.40 | 2.7259 | 0.24 C | |
| 28 | Si II | 1808.0126 | 6733.75 | 2.7244 | 0.51 B | |
| 29 | Al III | 1854.7164 | 6907.87 | 2.7245 | 1.72 B | |
| 30 | Al III | 1862.7895 | 6938.09 | 2.7246 | 1.38 B | |
| Mean |
| Line | Ion | (Å) | Ref.b | log (cm-2) | log (X/H) | log (X/H) | [X/H] | |
|---|---|---|---|---|---|---|---|---|
| 5 | H I | 1215.6701 | 0.4164 | 1 | 20.88 | … | … | … |
| 28 | Si II | 1808.0126 | 0.00218 | 2 | 15.91 | |||
| 7 | S II | 1253.811 | 0.01088 | 1 | 15.47 | |||
| 14 | Ni II | 1317.217 | 0.0774: | 1 | 14.23 | |||
| 16 | Ni II | 1370.132 | 0.0765 | 3 | 14.33 | |||
| 25 | Ni II | 1709.600 | 0.0348 | 4 | 14.51 | |||
| 26 | Ni II | 1741.549 | 0.0419 | 4 | 14.57 | |||
| 27 | Ni II | 1751.910 | 0.0264 | 4 | 14.53 | |||
| Ni II |
| Line | Ion | (Å) | (Å) | (Å) | Comments | |
|---|---|---|---|---|---|---|
| 1 | Si II* | 1264.7377 | 4716.45 | 2.729 | ||
| 2 | Si II* | 1309.2757 | 4881.28 | 2.728 | ||
| 3 | C II* | 1335.7077 | 4983.12 | 2.731 | ||
| 4 | N IV] | 1486.496 | 5545.20: | 2.730: | Noisy | |
| Mean |
| Spectral Features | No. of Lines | (km s-1)b | |
|---|---|---|---|
| Stellar photospheric lines | 8 | 0.00 | |
| Interstellar abs. lines | 29 | ||
| H II emission lines | 4 | ||
| Ly emission line | 1 |
| Line | (Å) | Identification | (Å) | Comments | |
|---|---|---|---|---|---|
| 1 | 5113.79 | Mg II 2796.352 | 0.8287 | 1.19 A | |
| 2 | 5127.06 | Mg II 2803.531 | 0.8288 | 0.96 A | |
| 3 | 5483.90 | Fe II 2344.214 | 1.3393 | 0.33 A | |
| 4 | 5573.37 | Fe II 2382.765 | 1.3390 | 0.62 A | |
| 5 | 6050.20 | Fe II 2586.6500 | 1.3390 | 0.59 B | Blended |
| 6 | 6082.13 | Fe II 2600.1729 | 1.3391 | 0.45 B | |
| 7 | 6541.22 | Mg II 2796.352 | 1.3392 | 0.96 A | |
| 8 | 6558.47 | Mg II 2803.531 | 1.3394: | 0.61 B | |
| 9 | 6672.79 | Mg I 2852.9642 | 1.3389 | 0.42 C | |
| Mean | |||||
| 10 | 5158.21 | ? | ? | 1.24c A | Unidentified |
| 11 | 5666.56 | ? | ? | 0.99c A | Unidentified |
| 12 | 5891.54 | Na I 5891.5833 | 0.0000 | 0.97: | Galactic ISM? |
| (affected by sky emission) |