Velocity bias in a CDM model
Abstract
We use a high resolution -body simulation to study the velocity bias of dark matter halos, the difference in the velocity fields of dark matter and halos, in a flat low-density CDM model. The high force, , and mass, , resolution allows dark matter halos to survive in very dense environments of groups and clusters making it possible to use halos as galaxy tracers. We find that the velocity bias measured as a ratio of pairwise velocities of the halos to that of the dark matter evolves with time and depends on scale. At high redshifts () halos move generally faster than the dark matter almost on all scales: . At later moments the bias decreases and gets below unity on scales less than : at . We find that the evolution of the pairwise velocity bias follows and probably is defined by the spatial antibias of the dark matter halos at small scales. One-point velocity bias , defined as the ratio of the rms velocities of halos and dark matter, provides a more direct measure of the difference in velocities because it is less sensitive to the spatial bias. We analyze in clusters of galaxies and find that halos are “hotter” than the dark matter: for , where is the virial radius. At larger radii, decreases and approaches unity at . We argue that dynamical friction may be responsible for this small positive velocity bias () found in the central parts of clusters. We do not find significant systematic difference in the velocity anisotropy of halos and the dark matter. The dark matter the velocity anisotropy can be approximated as , where distance is measured in units of the virial radius.
1 Introduction
Peculiar velocities of galaxies arise due to the gravitational pull of surrounding overdense regions and therefore reflect the underlying density field. The statistical study of galaxy velocities is important in cosmology since it can be used as a tool to constrain cosmological models. The connection between theoretical predictions and the observed statistics usually requires an additional quantity: the difference between galaxy and dark matter velocities, termed the velocity bias. The situation with predictions of the velocity bias is rather confusing. There is a wide range of estimates of the velocity bias. Values change from strong antibias with galaxies moving twice slower than the dark matter (Gelb & Bertschinger, 1994; Klypin et al., 1993), to almost no bias (Klypin et al. 1998 (KGKK); Ghigna et al. 1998), to slight positive bias (Diaferio et al., 1998; Okamoto & Habe, 1999). Following Carlberg (1994) and Summers, Davis, & Evrard (1995) we distinguish two forms of the velocity bias. The one-point velocity bias is defined as the ratio of the rms velocity of galaxies or galactic tracers to that of the dark matter:
| (1) |
where the rms velocity is estimated on some scale. Traditionally, this measure of the velocity bias is used for clusters of galaxies. Two-particle or pairwise velocity bias compares the relative velocity dispersion in pairs of objects separated by distance :
| (2) |
The pairwise velocity dispersion (PVD) was often used to complement the analysis of the two-point spatial correlation function. At small scales, the cosmic virial theorem Peebles (1980) predicts that the PVD of galaxies should be proportional to the product of the mean density of the universe and the two-point correlation function. The PVD of galaxies has been estimated for the CfA catalog (Davis & Peebles 1983; Zurek et al.1994; Somerville, Davis & Primack 1997) and recently for the Las Campanas Redshift Survey by Landy, Szalay, & Broadhurst (1998) and Jing, Mo & Börner (1998). The latter two studies gave and , respectively, for a separation. Jing & Börner (1998) show that the discrepancy between these two studies is due to the difference in treatment of the infall velocities. The value of as well as the infall velocities depend on which regions (clusters or field) are included in the surveyed sample.
The PVD of the dark matter, , has also been estimated for a variety of cosmological models (e.g., Davis et al. 1985; Carlberg & Couchman 1989; Carlberg, Couchman & Thomas 1990; Klypin et al.1993; Colín, Carlberg, & Couchman 1997; Jenkins et al. 1998). If galaxies were a random sample of the mass distribution, we would expect that were approximately equal to . Davis et al. (1985) showed that in this case an model with produces a PVD that is too large compared to observations. Here is the rms of mass fluctuation estimated with the top-hat window of radius 8Mpc. This is an example of a model which needs some kind of bias to be compatible with the observations.
The notion of the pairwise velocity bias was introduced by Carlberg & Couchman (1989). They found that the dark matter had a PVD a factor of two higher than that of the simulated “galaxies”. In a further analysis, Carlberg, Couchman, & Thomas (1990) suggested that an model with could be made consistent with the available data for (velocity antibias) and almost no spatial bias. Estimates of the pairwise velocity bias are in the range of 0.5–0.8 (Couchman & Carlberg, 1992; Cen & Ostriker, 1992; Gelb & Bertschinger, 1994; Evrard, Summers & Davis, 1994; Colín, Carlberg, & Couchman, 1997; Kauffmann et al., 1998a, b). Differences between the estimates (especially the early ones) can be attributed to some extent to numerical effects (“overmerging problem”) and to different methods of identifying galaxy tracers. Only recently -body simulations achieved a high dynamic range in a relatively large region of the universe necessary for a large number of galaxy-size halos to survive in clusters and groups (e.g.,KGKK, Ghigna et al., 1998; Colín et al., 1999). The estimates of the pairwise velocity bias start showing a tendency for convergence. For example, results of Kauffmann et al. (1998a, 1998b) for a low-density model with a cosmological constant and results presented in this paper for the same cosmological model agree reasonably well in spite of the fact that we use very different methods. Results point systematically to a antibias .
One-point velocity bias for clusters and groups of galaxies tells a different story. Values of are typically larger than those for and range from 0.7 to 1.1 (Carlberg & Dubinski, 1991; Katz & White, 1993; Carlberg, 1994; Ghigna et al., 1998; Frenk et al., 1996; Metzler & Evrard, 1997; Okamoto & Habe, 1999; Diaferio et al., 1998). Carlberg & Dubinski (1991) suggested that if the pairwise velocity antibias is significant, galaxies in clusters should have orbital velocities lower than the dark matter. However, this may not necessarily be true. In this paper (see also, for example, Kauffmann et al. 1998a) we argue that galaxy tracers do not need to move slower in clusters to have the pairwise velocity bias . In particular, we find that while for halos in our study, the halos in many clusters actually move somewhat faster than dark matter. Ghigna et al. (1998) also do not detect a significant difference between the orbits of DM particles and halos. They find that the cluster radial velocity dispersion of halos is within a few percent of that of the DM particles. Okamoto & Habe (1999) used hundreds of galaxy-size halos in their simulated cluster. They are able to compute the halo velocity dispersion profile. Their results suggest that in the range halos have a velocity dispersion slightly larger than that of the DM particles. Diaferio et al. (1998) using a technique that combines -body simulations and semi-analytic hierarchical galaxy formation modeling also find that galaxies in clusters have higher orbital velocities than the underlying dark matter field. They suggest that this effect is due to the infall velocities of blue galaxies. We find in this paper a similar effect: galaxy-size halos are “hotter” than the dark matter in clusters.
The paper is organized as follows. In § 2 brief descriptions of the model, simulation, and group-finding algorithm are given. In § 3 the DM and halo PVDs as well as the corresponding velocity bias are computed at four epochs. We take a sample of the most massive clusters in our simulation and compute an average halo and DM velocity dispersion profile. A cluster velocity bias is then defined and computed. A discussion of the main results are presented in § 4. The conclusions are given in § 5.
2 Model, simulation, halo-finding algorithm
We use a flat low-density model (CDM) with and . Cluster mass estimates (e.g., Carlberg et al., 1996), evolution of the abundance of galaxy clusters (e.g., Eke et al., 1998), baryon fraction in clusters (e.g., Evrard, 1997), and the galaxy tracer two-point correlation function(e.g., Colín et al., 1999; Benson et al., 1999) favor a low-density universe with (see also Roos & Harun-or-Rashid, 1998). On the other hand, various observational determinations of (the Hubble constant in units of ) converge to values between 0.6–0.7. Our model was set to which gives an age for the universe of 13.4 Gyr in close agreement with the oldest globular cluster age determinations (Chaboyer, 1998). The approximation for the power spectrum is that given by (Klypin & Holtzman, 1997). The adopted normalization of the power spectrum is consistent with both the COBE observations and observed abundance of galaxy clusters.
The Adaptive Refinement Tree code (ART; Kravtsov, Klypin & Khokhlov 1997) was used to run the simulation, as described by Colín et al. (1999). The simulation followed the evolution of dark matter particles in a 60Mpc box which gives particle mass of . The peak force resolution reached in the simulation is . The mass resolution is sufficient for resolving and identifying galaxy-size halos with at least 30 particles. The force resolution allows halos to survive within regions of very high density (as those found in groups and clusters of galaxies). In dense environment of clusters the mass of halos is not well defined. Therefore, we use the maximum circular velocity
| (3) |
where is the mass of the halo inside radius , as a “proxy” for mass.
Halos begin to form at very early epochs. For example, at we identify halos with maximum circular velocity, , greater than . The numbers of halos that we find at , 1, and 0 are 14102, 14513, 10020, respectively. We use a limit of on the circular velocity which is slightly lower than the completeness limit (Colín et al., 1999) of our halo catalog. This value increases the number of halos quite substantially (a factor of two as compared with the limit of ), and, thus, reduces the statistical noise. We checked that our main results are only slightly affected by partial incompleteness of the sample.
Our halo identification algorithm, the Bound Density Maxima (BDM; see KGKK), is described in detail elsewhere (Klypin & Holtzman 1997). The main idea of the BDM algorithm is to find positions of local maxima in the density field smoothed at the scale of interest (). BDM applies physically motivated criteria to test whether a group of DM particles is a gravitationally bound halo. The major virtue of the algorithm is that it is capable of finding both isolated halos and halos orbiting within larger dense systems. Cluster-size halos were also located by the BDM algorithm. The physical properties of a sample of the twelve most massive groups and clusters111The cluster number 8, in descending order in mass, was excluded from the sample because it has a group close to it that produces too much disturbance to the cluster. are shown in Table 1. The total number of clusters chosen for the sample is a compromise between taking a relatively large number of clusters, so that we could talk about cluster average properties, and using clusters with a relatively high number of halos. This cluster sample is used to compute the average DM and halo velocity dispersion profiles as well as the average DM and halo velocity anisotropy profiles.
| M⊙ | (km/sec) | (km/sec) | (Mpc) | |
|---|---|---|---|---|
| 1645 | 1402 | 1.43 | 246 | |
| 1022 | 910 | 1.28 | 132 | |
| 992 | 831 | 1.17 | 98 | |
| 975 | 789 | 1.11 | 95 | |
| 887 | 747 | 1.05 | 58 | |
| 887 | 730 | 1.02 | 55 | |
| 831 | 695 | 0.98 | 45 | |
| 820 | 680 | 0.95 | 33 | |
| 789 | 673 | 0.94 | 74 | |
| 789 | 668 | 0.94 | 60 | |
| 753 | 659 | 0.92 | 67 | |
| 720 | 635 | 0.89 | 64 | |
3 Results
3.1 The pairwise velocity bias
The three-dimensional pairwise velocity dispersion PVD is defined as
| (4) |
where is the relative velocity vector of a pair of objects separated by a distance and brackets indicate averaging over all pairs with the separation . Figure 1 shows the PVD for the dark matter, , at four epochs (top panel). At 1 Mpc the radial PVD is about 1100 km/s at . For the same cosmological model Jenkins et al. (1998) find a radial PVD of . Jenkins et al. used slightly lower normalization for the model () and used a bigger simulation box (). When the differences in are taken into account the Jenkins et al. value increases to 1,120 km/s. Thus, both estimates roughly agree.
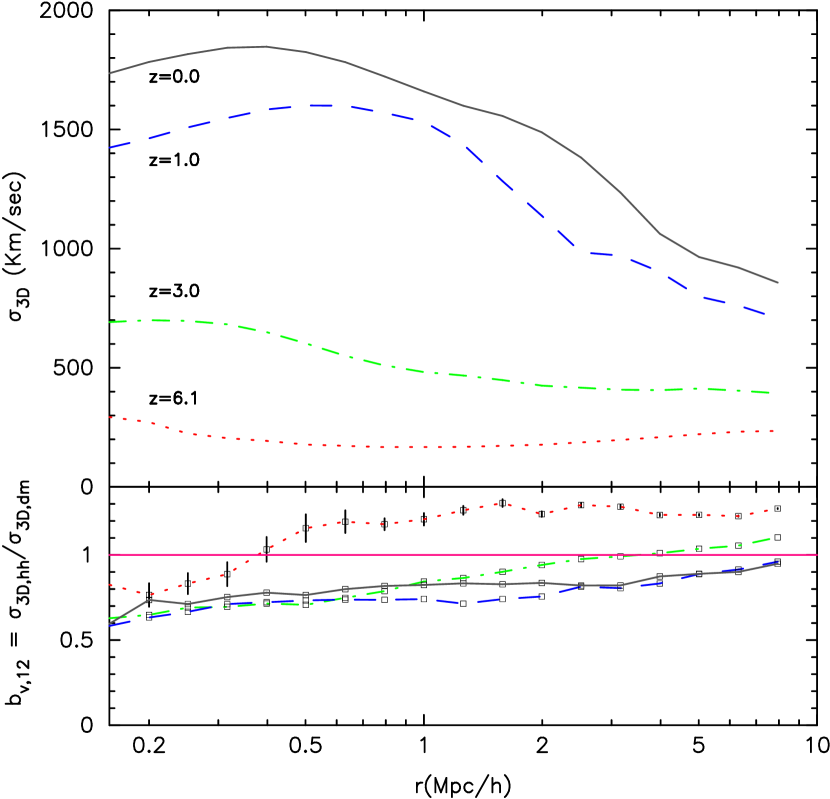
The ratio of the halo and the dark matter PVDs, the pairwise velocity bias , is shown in the bottom panel of Figure 1. All halos with were included in the computation. At very early epochs and on large scales halos tend to move faster than the dark matter. At later moments the pairwise velocity bias becomes smaller than unity. It is interesting to compare the evolution of with the changes in the spatial bias for the same cosmological model (Colín et al., 1999). The spatial bias is defined as the square root of the ratio of correlation functions . In general, the biases evolve in the same way. At high redshifts both biases are positive () and decline as the redshift decreases. At low redshifts biases dive below unity (antibias) and stop evolving. In spite of similarities, there are some differences. The pairwise velocity bias becomes less than unity at on scales below . At the same redshift the spatial bias is still positive on all scales.
Colín et al. (1999) and Kravtsov & Klypin (1999) interpret the evolution of the spatial bias as the result of several competing effects. Statistical bias (higher peaks are more clustered) tends to produce large positive bias and explain bias evolution at high redshifts. At later epochs halos of a given mass or circular velocity become less rare and start merging inside forming groups of galaxies. Both effects lead to a decrease of bias. The merging becomes less important as clusters with large velocity dispersions form at . This results in a very slow evolution of the halo correlation function and bias. It is likely that the same processes define the evolution of the pairwise velocity bias. The differences can be explained by the known fact that the PVD is strongly dominated by few largest objects (e.g., Zurek et al. 1994; Somerville, Davis & Primack 1997): merging of halos inside forming groups at results in fewer pairs with large relative velocities and in velocity antibias on scales. If this interpretation is correct, the pairwise velocity bias mostly measures the spatial bias, not the differences in velocities.
3.2 The velocity anisotropy
A sample of 12 groups and clusters (see Table 1) was used to compute various average cluster velocity statistics. In order to reduce the noise in the profiles because of the small number of clusters in the sample, we double the sample by using also the same clusters at slightly different time . For each cluster the halo distances to the cluster center are divided by the corresponding cluster virial radius (normalized distances). The halo velocities (averaged in spherical bins) are divided by the corresponding cluster circular velocity at the virial radius (normalized velocities). In Figure 2 we show radial profiles, in normalized units, for halos and DM: the mean radial velocity (), the radial () and the tangential () velocity dispersions. All halos are given equal weight. We have accounted for the Hubble flow when we compute and (so, proper, not peculiar velocities are used); no correction for the mean radial velocity was made. The trend in both the velocity dispersion and the anisotropy velocity is slightly affected if the mean radial velocity is subtracted at distances and it is not affected at all at smaller distances.
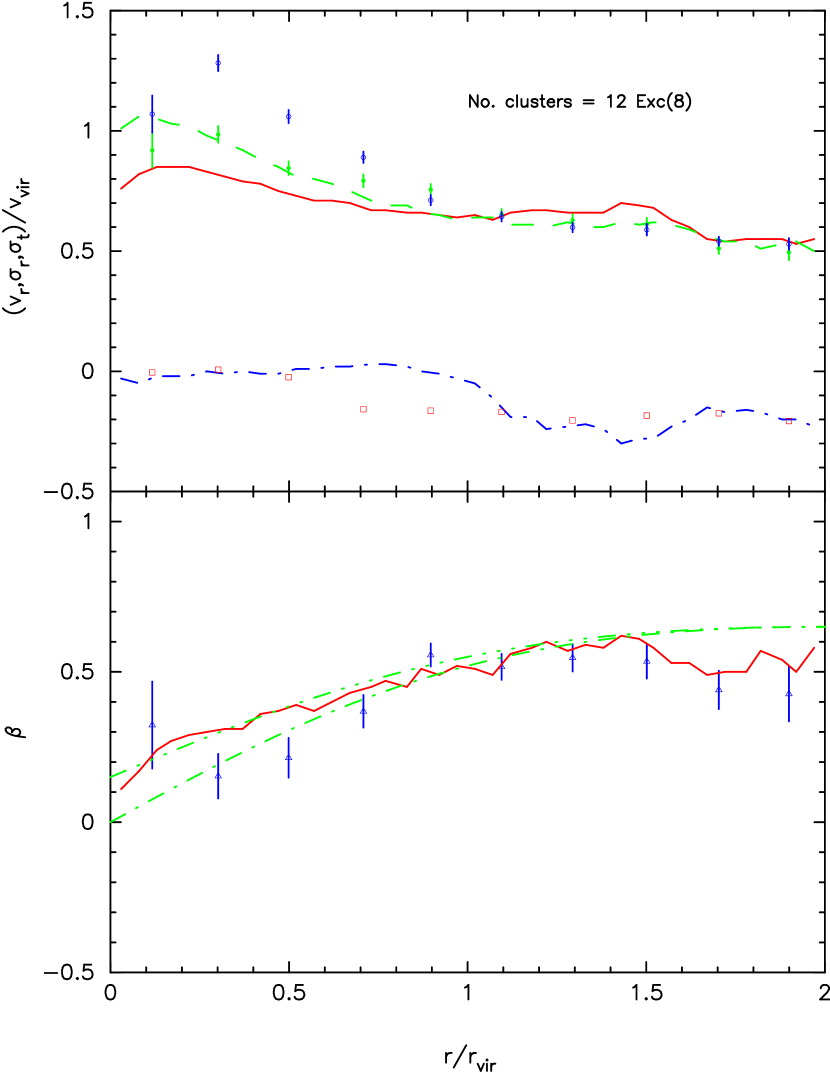
The velocity anisotropy function
| (5) |
is presented in the bottom panel of Figure 2 for halos and for DM. For pure radial orbits , while an isotropic velocity dispersion implies . The two lines added to the panel show a fitting formula (Carlberg et al., 1997).
| (6) |
for two pairs of parameters (, ): (0.65,0.) and (0.5,0.15). The first set of parameters gives a better approximation for halos. It explicitly assumes that at the center. The second set of parameters allows a small anisotropy at the center. It provides a better fit for the dark matter. Note that while the halos have a tendency for more isotropic velocities (with possible exception of the center), the difference between halos and the dark matter is not statistically significant.
The variances of and are computed using standard expressions for errors; for example, for
| (7) |
where and , and is the number of halos. The statistical error is, thus, given by the square root of . The variance of is given by
| (8) |
3.3 The cluster velocity bias
The three-dimensional velocity dispersions for both halos and DM are shown in the top panel of Figure 3. The bottom panel shows the cluster velocity bias, defined here as . It is surprising that halos in clusters appear to have larger, by about 20%, velocity dispersions than the DM particles (positive bias). The trend is the same regardless of what type of velocity dispersion (3D, tangential or radial) we use in the velocity bias definition. There is almost no bias in the very center of clusters. However, the value of the innermost bin increases if we exclude the “cD” halos (defined as those halos which lie within the inner radius and have maximum circular velocities greater than about 300 km/s). Their exclusion increases the positive velocity bias to 1.22, a value which is comparable to that found in the adjacent bin.

The cluster positive velocity bias is robust to changes in the limit of the circular velocity . Only the innermost bin experiences significant changes when this limit is increased. For example, when we increase from to (more massive halos are chosen) the value of in the innermost bin reduces to 0.6. This favors a picture in which the central regions of clusters large galaxy-size halos feel more the slowing effect of the dynamical friction. All the other bins (within the virial radius) continue to show small positive velocity biases. The positive velocity bias is also robust to changes in the number of clusters of the sample. For instance, one might suspect, that the most massive cluster weights so much that it alters the statistics222In fact, the most massive cluster of our simulation has had a recent major merger and halos may still have large (“overheated”) velocities (e.g., Katz & White, 1993). This is true to some degree, but is does not change the “sign” of the bias. For example, when we exclude this cluster and take , all bins continue to show positive bias (within the virial radius) except the innermost bin where . The results for the innermost bin should be taken with caution because the effects of overmerging may still be present in the central of the clusters.
The difference in velocity dispersions of halos and dark matter particles indicates that their velocity distribution functions (VDF) are different. We have examined both differential and cumulative VDFs for the analyzed clusters and found that the halo VDFs are generally skewed towards higher velocities as compared to the dark matter VDF, at . The two VDFs are approximately the same for larger radii. The observed differences in the velocity distribution may be caused either by the differences in velocity fields of infalling halos and dark matter (if, for example, halos are accreted preferentially along filaments resulting in orbits of higher ellipticity) or by effects of dynamical friction operating on halos, but not on dark matter, in clusters. The dynamical friction may affect the slowest halos more efficiently because the dynamical friction time is proportional to the cube of the halo velocity. The slowest halos may therefore merge more efficiently thereby skewing the velocity distribution of the surviving halos towards higher velocities.
One could ask whether or not this positive cluster velocity bias persists in the next set of twelve clusters or groups, in descending order in mass (with virial masses below those clusters shown in Table 1). Because this new sample of clusters have an average virial mass lower than the average mass of clusters of Table 1, dynamical friction is expected to operate more efficiently (e.g., West & Richstone, 1988; Diaferio et al., 1998). The number of halos per cluster or group in this new sample is small, we therefore use the whole group velocity dispersion. We find integral values which are in general lower than one, and in some cases there are groups that exhibit a strong velocity antibias (ratios close to 0.6). This is contrary to what we find for the clusters of Table 1, where the majority of clusters have an integral positive velocity bias.
4 Discussion
Literature on the velocity bias is very extensive and results are often contradictory. In this section we review some of the published results and compare them with our results. There are some reasons for the chaotic state of the field. One of them is the confusion of two different notions of the velocity bias – the single-point and the pairwise biases. The biases have different nature, and, thus, give different results. Another source of confusion is the way how galaxies are identified or approximated in theoretical models. When we combine this uncertainty with many physical processes, which we believe can create and change velocity bias, the situation becomes rather complicated.
Velocity profiles seems to be the easiest part of the picture. In this paper we present results, which are less noisy and are based on a more homogeneous set of clusters than in most of previous publications. Our results on the average cluster profiles for the dark matter ( and ) roughly agree with the results of Cole & Lacey (1996), Tormen, Bouchet, & White (1997), and Thomas et al. (1998). For example, Tormen, Bouchet, & White (1997) find a DM velocity anisotropy at and at , which is close to our results. The structure of galaxy clusters in various cosmologies is analyzed in detail by Thomas et al. (1998). From a total sample of 208 clusters they choose a subsample which shows no significant substructure. They find a more isotropic averaged beta profile ( at ) in their CDM model. The differences between our result and theirs can be accounted for the fact that their clusters were selected not to have significant substructure. More substructure in a cluster likely means a more anisotropic cluster. The value at the cluster center (innermost bins) is around 0.1, which is close to our results.
Pairwise velocity bias is very sensitive to the number of pairs found in rich clusters of galaxies. Removing few pairs may substantially change the bias. Thus, it mostly measures the spatial bias (or antibias) and is less sensitive to real differences in velocities. The value of that we find at is typically higher than previous estimates reported in the literature, computed for the CDM model (Carlberg & Couchman, 1989; Carlberg, Couchman & Thomas, 1990; Gelb & Bertschinger, 1994; Summers, Davis, & Evrard, 1995) Some of the results are difficult to compare because the pairwise velocity bias is expected to evolve with time and vary from model to model.
The first interesting result of this paper, that comes out from the evaluation of at very high redshift, is that the halo PVD can be greater than that of the DM. This positive velocity bias had not been detected before (but see below) partly because of the lack of simulations with very high resolution that could overcome the overmerging problem. This result is surprising in part because halos are expected to be born dynamically cool 333Halos tend to form near the peaks of the DM density distribution, (e.g., Frenk et al., 1988).. In fact, this is one of the reasons given in the literature to explain the present-day pairwise velocity bias (e.g., Evrard, Summers & Davis, 1994). The other is the dynamical friction (e.g., Carlberg, Couchman & Thomas, 1990). We offer the following explanation to this positive velocity bias. Those halos that are formed at very high redshift come from very high density peaks. They are dynamically cooler than an average DM particle from the region where they were born in, but hotter than most of the matter. The pairwise velocity bias rapidly becomes smaller than one at non-linear scales. As time goes on, the mergers inside forming groups reduce the number of high velocity halos, while velocities of DM particles increase. As the result the average halo random relative velocities are reduced below that of the DM.
Using a semi-analytical method to track the formation of galaxies Kauffmann et al. (1998a; 1998b) also find a pairwise velocity bias greater than one at high redshifts. They find that the galaxy PVD is greater than that of the DM at (their figure 11, CDM model). A is expected at higher redshift in their CDM model as well.
Single-point velocity bias appears to be the most difficult and controversial quantity. It is important because it is a more direct measure of the velocity differences. It still depends on the spatial bias, but to much lesser degree as compared with the pairwise bias. An interesting result was found when we evaluated the average cluster halo velocity dispersion profile and compared it with that of the DM particles: within the virial radius halos move faster than the dark matter.
We believe that the explanation for this fact comes from a combination of two known physical mechanisms: the dynamical friction and the merging of halos. One may naively expect that the dynamical friction should always slow down halos, which must result in halos moving slower than the dark matter particles. This is not true. While on a short time-scale the dynamical friction reduces velocity of a halo, the halo may decrease or increase its velocity depending on the distribution of mass in the cluster and on the trajectory of the halo. For example, if a halo moves on a circular orbit inside a cluster with the Navarro-Frenk-White profile, its velocity will first increase as it spirals from the virial radius to , where is the characteristic radius of the core of the cluster. The halo velocity will then decrease at smaller radii. When the halo comes close to the center of the cluster it merges with the central cD halo, which will have a tendency to increase the average velocity of remaining halos. It appears that the Jeans equation provides a better tool for understanding the velocity bias.
We will use the Jeans equation as a guide through the jungle of contradictory results. It cannot be used more than a hint because it assumes that a cluster is stationary and spherical, which is generally not the case. If a system is in a stationary state and is spherically symmetric, the mass inside radius is related to the radial velocity dispersion :
| (9) | |||||
| (10) |
where is the (number) density profile, and is the velocity anisotropy function. The left-hand-side of this equation (the total mass) is the same for both halos and the dark matter. Thus, if the term is the same for the dark matter and halos, then there should be no velocity bias: halos and the dark matter must have the same . Numerical estimates of the term are inevitably noisy because we have to differentiate noisy data. Nevertheless, we find that the value of the term for halos is systematically smaller than for the dark matter. This gives a tendency for to be larger for halos. In turn, this produces a positive velocity bias. The main contribution comes typically from the the logarithmic slope of the density: the halo density profile is shallower in the central part as compared with that of the dark matter. The halo profile is shallower likely because of merging in the central part of the cluster, which gave rise to a central cD halo found in each of our clusters. We note that while the Jeans equation shows the correct tendency for the bias, it fails to reproduce correct magnitude of the effect: variations of the term are smaller than the measured velocity bias.
One can also use the Jeans equation in a different way – as an estimator of mass. We have computed for our average cluster using both DM and halos. At , where is close to its maximum, the halo mass determination is larger than that of the DM by a factor of 1.4. This is due to the larger halo velocity dispersion. Because the term is actually higher for DM by about 10%, the overestimation is reduced from 1.56 to 1.4. As the distance to the cluster center approaches the virial radius the mass overestimation disappears. At the virial radius both mass estimations agree, essentially because , , and the sum of the logarithm derivatives are the same for both halos and DM, and are within % of the true mass.
Using the Jeans equation for a spherically symmetric system and assuming an isotropic velocity field, Carlberg (1994) showed that a cool tracer population, , moving inside a cluster with a power-law density profile (the density profile for the tracer is also assumed to be a power-law), produced a mass segregation. That is, the tracer population had a steeper density profile. We can invert this reasoning and say that a more centrally concentrated halo distribution produces a velocity antibias. We do not find this kind of mass segregation in our halo cluster distribution. In fact, we see the opposite – halos are less concentrated than DM. Dynamical friction along with merging produces a lack of halos in the center of the cluster. This very likely explains differences between our and Carlberg’s results for the velocity bias.
Carlberg & Dubinski (1991) simulated a spherical region of 10 Mpc radius and DM particles. They were unable to find galaxy-size halos inside cluster at because of insufficient resolution: softening length was 15 kpc instead of needed for survival of halos (KGKK). Their identification of “galaxies” with those DM particles which were inside high-density groups found at high redshift, may have produced a spurious cluster velocity antibias. Using different galaxy tracers Carlberg (1994) also found an integral cluster velocity bias lower than one. This result could still be affected by numerical resolution (). Evrard, Summers, & Davis (1994) run a two-fluid simulation in a small box, , and stopped it at . Each DM particle had a mass and an effective resolution of 13 kpc (at ). The initial conditions were constrained to assure that a poor cluster could form in their simulation. Their “globs” (galaxy like objects) exhibit a lower than one velocity bias. This velocity bias appeared not to depend on epoch and mass. Their velocity antibias qualitatively agrees with our results for groups and poor clusters. At the same time, their value for the pairwise velocity bias agrees with our results.
Metzler & Evrard (1997) use an ensemble of two-fluid simulations to compute the structure of clusters. Unfortunately, their simulations do not have high mass resolution to allow the gas in their simulations to cool and form “galaxies” (and then they could also allow for some feedback). Instead, they use a high-density peak recipe to convert groups of gas particles into galaxies particles. They find a one-point “galaxy” velocity bias that depends on cluster mass: the higher the cluster mass is the higher the value. We find a similar result when we do the analysis of the velocity bias cluster by cluster 444On individual clusters we take only integral velocity dispersions. Their ensemble-averaged bias parameter is 0.84. Their recipe for galaxy formation produces a galaxy number density profile which is steeper than that of the DM. This is likely the reason why they find a value lower than one (Carlberg 1994, see above).
Frenk et al. (1996) simulated a Coma-like cluster with a P3M + SPH code that includes the effects of radiative cooling. The mass per gas particle is with a softening parameter of the Plummer potential. Their galaxies have two extreme representations: one as a pure gas clumps and the other as lumps of the stellar component. They find a mass segregation in both representations – galaxies are more clustered than DM toward the center of the cluster which is not seen in our halo distribution 555The reader might want to compare the Fig. 11 in Frenk et al. (1996) with the Fig. 2 in Colín et al. (1999). Once again, according to Carlberg (1994) analysis, this would result in a one-point velocity bias lower than one (). Because of a strong cooling, their “galaxies” can acquire high density contrasts, which helps galaxies to survive inside cluster. At the same time, poor force resolution (35 kpc) could have affected their results.
There are two studies where values greater than one are obtained. Okamoto & Habe (1999) simulate a spherical region of 30 Mpc radius using a constrained random field method. They use a multi-mass initial condition to reach high resolution. Their high-resolution simulated region, where the cluster ends up, has a softening length and mass per particle . They find a cluster velocity bias lower than one only in the innermost part of the cluster where dynamical friction is expected to be more efficient. A small positive bias () is found in the range . Based on the previous work by Kauffman et al. (1998a), Diaferio et al. (1998) study properties of galaxy groups and clusters. They also find that galaxies in clusters are “hotter” than the underlying dark matter field. They suggest that this effect is due to the infall velocities of blue galaxies. Infall could explain the positive velocity bias of the outermost bin (within the virial radius) of our Figure 3, but it definitely cannot account for the value seen in the inner bins (the mean radial velocity is close to zero for both DM and halos in the three innermost bins).
There are several differences between our simulation and those mentioned above. First, some of the papers cited above simulate only a region which ends up as a cluster. So, they have structure for only one cluster. The single-cluster one-point velocity bias could not represent an average velocity bias, found using a sufficiently large sample of clusters. For example, if our small positive velocity bias is influenced by non-equilibrium cluster features, then when one selects a cluster which is in good dynamical equilibrium (this could be defined, for example, by the absence of substructure in the cluster) and computes the one-point velocity bias, it could be biased toward low values () because dynamical friction have had more time to operate. Second, we simulate a relatively large random volume that gives us many clusters in which effects such as tidal torques, infall, and mergers are included naturally. A cluster simulated region or a random large region but without enough resolution may not have a sufficiently large number of galaxy tracers and, thus, introduce high statistical errors. Our relatively large number of halos in clusters reduces significantly the statistical errors in the computation of and makes them suitable to the determination of, for example, the radial dependence of the velocity bias. Third, in view of the Okamoto & Habe (1999) and Ghigna et al. (1998) results, and our own results, it seems that numerical resolution not only plays an important role in determining the whole cluster velocity bias value (both spatial and velocity bias intervene to affect its value) but it is also important in determining the radial dependence of (almost pure velocity bias).
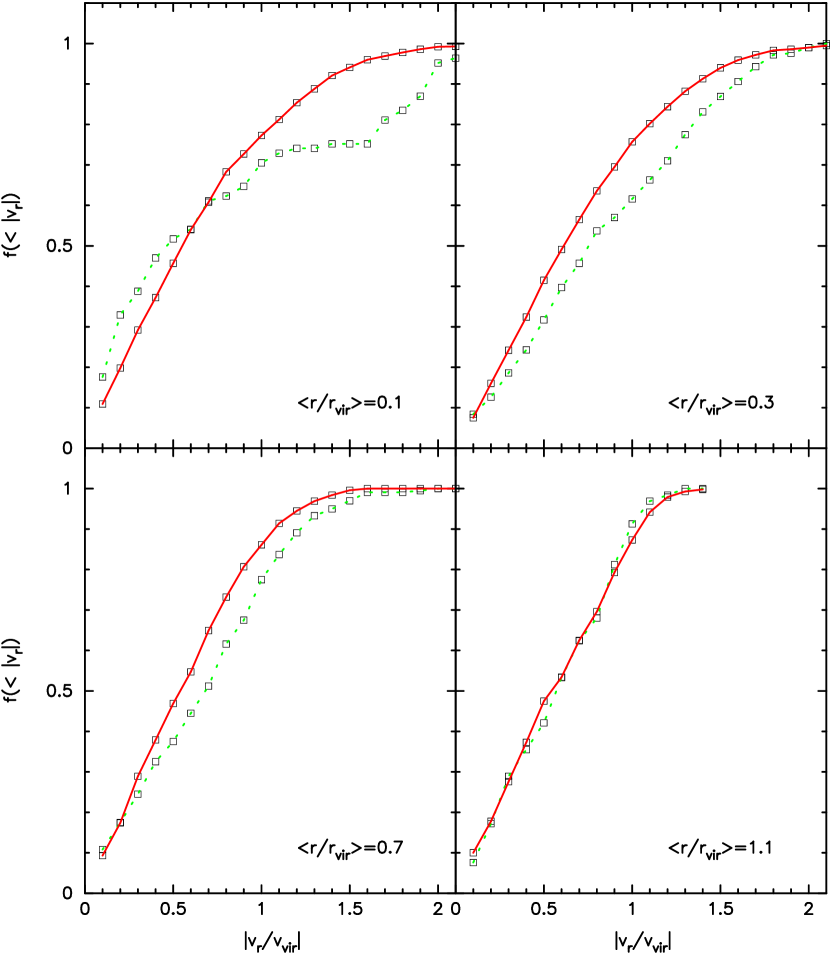
What could account for the small positive velocity bias that we see in our average cluster? We have examined both the differential and the cumulative radial velocity distribution functions. We use the radial velocity to highlight any contribution of infall velocities to the velocity bias. The cumulative radial velocity distribution function is shown in the Figure 4 for four different radial bins. In the top-right panel (the innermost bin) we see a higher fraction of low-velocity halos at small values. This is due to central cD halos, which move very slowly relative to clusters themselves. At large values we observe the contrary – a higher slope, which means that there are many fast moving halos. If we do not include the cD halos, the velocity bias becomes larger then unity even in the central radial bin. However, as we noticed earlier in section 3.3, a velocity antibias can appear in the central bin, if the value of is increased. It is clear that the deficiency of low and moderate halos produces the positive velocity bias measured at (see the top-left and the bottom-right panels). We have used the Kolmogorov-Smirnov test in order to evaluate whether or not the halo and the DM velocity distribution functions are statistically different. We find that the probability that these functions were drawn from the same distribution is smaller than 0.01 in all radial bins that are within the virial radius. As mentioned in § 3.3, the dynamical friction may have affected the slow moving halos more significantly because the dynamical friction time-scale is proportional to the cube of the halo velocity. It is thus expected that low-velocity halos merge sooner than their high-speed counterparts, thereby skewing the VDF toward high-velocity halos666It should be also kept in mind that as halos move to orbits of smaller radii they could acquire higher velocities because the DM velocity dispersion increases toward the cluster center. Infall could also be an important source of positive velocity bias for the outermost bins.
5 Summary
1. We have found that galaxy-size halos have a time- and scale- dependent pairwise velocity bias. At high redshifts () this bias is larger than unity (). It declines with time and becomes at . The evolution of the pairwise velocity bias follows and probably is defined by the spatial bias of the dark matter halos. These results are in qualitative agreement with those by Kauffmann et al. (1998b).
2. We have evaluated the velocity anisotropy function for both halos and DM particles. For both halos and DM is a function that increases with radius and reaches a value of at the virial radius. The difference between this value and that found by Thomas et al. (1998) likely can be explained by the fact that Thomas et al. (1998) selected a sample of clusters which had little substructure. Our simulations indicate that the halo velocity anisotropy closely follows (but lies slightly below) that of the underlying dark matter.
3. Halos in our clusters move faster than DM particles: for . This result disagrees with many previous estimates of the cluster velocity bias. This difference appears to be due to differences in numerical resolution. More work needs to be done to settle the issue. Nevertheless, it is encouraging that Diaferio et al. (1998) and Okamoto & Habe (1999) found results similar to ours.
4. Usual argument that dynamical friction slows down galaxies and, thus, must produce velocity antibias is not correct. Galaxy tracers in clusters move through an environment which has a steep density gradient. A sinking halo may either increase or decrease its velocity depending on the distribution of cluster mass and on the trajectory of the halo. A combination of the dynamical friction and merging appears as the most compelling hypothesis which could account for our small positive velocity bias.
We acknowledge the support of the grants NAG-5-3842 and NST-9802787. Computer simulations were performed at NCSA. P.C. was partially supported by DGAPA/UNAM through project IN-109896.
References
- Benson et al. (1999) Benson, A.J., Cole, S., Frenk, C.S., Baugh, C.M., & Lacey, C.D. 1999, MNRAS submitted (astro-ph/9903343)
- Carlberg (1994) Carlberg, R.G. 1994, ApJ, 433, 468
- Carlberg & Couchman (1989) Carlberg, R.G., & Couchman, H.M.P. 1989, ApJ, 340, 47
- Carlberg, Couchman & Thomas (1990) Carlberg, R.G., Couchman, H.M.P., & Thomas, P.A. 1990, ApJ, 352, L29
- Carlberg & Dubinski (1991) Carlberg, R.G., & Dubinski, J. 1991, ApJ, 369, 13
- Carlberg et al. (1996) Carlberg, R.G., Yee, H.K.C., Ellingson, E., Abraham, R., Gravel, P., Morris, S., Pritchet, C.J. 1996, ApJ, 462, 32
- Carlberg et al. (1997) Carlberg, R.G. et al. 1997, ApJ, 485, L13
- Cen & Ostriker (1992) Cen, R., & Ostriker, J.P. 1992, ApJ, 399, L113
- Chaboyer (1998) Chaboyer, B. 1998, Phys. Reports, in press (astro-ph/9808200)
- Cole & Lacey (1996) Cole, S., & C. Lacey. 1996, MNRAS, 281, 716
- Colín, Carlberg, & Couchman (1997) Colín, P., Carlberg, R.G., & Couchman, H.M.P. 1997, ApJ, 490, 1
- Colín et al. (1999) Colín, P., Klypin, A.A., Kravtsov, A.V., & A.M. Khokhlov. 1999, ApJ in press (astro-ph/9809202)
- Couchman & Carlberg (1992) Couchman, H.M.P., & Carlberg, R.G. 1992, ApJ, 389, 453
- Davis et al. (1985) Davis, M., Efstathiou, G., Frenk, C.S., & White, S.D.M. 1985, ApJ, 292, 371
- Davis & Peebles (1983) Davis, M., & Peebles, P.J.E. 1983, ApJ, 267, 465
- Diaferio et al. (1998) Diaferio, A., Kauffmann, G., Colberg, J.M., & White, S.D.M. 1998, MNRAS submitted (astro-ph/9812009)
- Eke et al. (1998) Eke, V.R., Cole, S., Frenk, C.S., & Henry, P.J. 1998, MNRAS, 298, 1145
- Evrard (1997) Evrard, A.E. 1997, MNRAS, 292, 289
- Evrard, Summers & Davis (1994) Evrard, A.E., Summers, F.J., & Davis, M. 1994, ApJ, 422, 11
- Frenk et al. (1988) Frenk, C.S., White, S.D.M., Davis, M., & Efstathiou, G. 1988, ApJ, 327, 507
- Frenk et al. (1996) Frenk, C.S., Evrard, A.E., White, S.D.M., & Summers, F.J. 1996, ApJ, 472, 460
- Gelb & Bertschinger (1994) Gelb, J.M., & Bertschinger, E. 1994, 436, 491
- Ghigna et al. (1998) Ghigna, S., Moore, B., Governato, F., Lake, G., Quinn, T., Stadel, J. 1998, MNRAS, 300, 146
- Jenkins et al. (1998) Jenkins et al. (The Virgo Consortium) 1998, ApJ, 499, 20
- Jing & Börner (1998) Jing, Y.P.,& Börner, G. 1998, ApJ, 503, 502
- Jing, Mo & Börner (1998) Jing, Y.P., Mo, H.J., & Börner, G. 1998, ApJ, 494, 1
- Katz & White (1993) Katz, N., & White, S.D.M. 1993, ApJ, 412, 455
- Kauffmann et al. (1998a) Kauffmann, G., Colberg, J.M., Diaferio, A., & White, S.D.M. 1998a, MNRAS, 303, 188
- Kauffmann et al. (1998b) Kauffmann, G., Colberg, J.M., Diaferio, A., & White, S.D.M. 1998b, MNRAS submitted (astro-ph/9809168)
- Klypin et al. (1998) Klypin, A., Gotlöber, S., Kravtsov, A., Khokhlov, A.. 1998, ApJ, 516, 530 (KGKK)
- Klypin & Holtzman (1997) Klypin, A., & Holtzman, J. 1997, preprint (astro-ph/9712217)
- Klypin et al. (1993) Klypin, A., Holtzman, J., Primack, J., & Regos, E. 1993, ApJ, 416, 1.
- Kravtsov & Klypin (1999) Kravtsov, A.V., & Klypin, A. 1999, ApJ in press (astro-ph/9812311)
- Kravtsov & Klypin (1997) Kravtsov, A.V., Klypin, A., & Khokhlov, A.M. 1997, ApJS 111, 73
- Landy, Szalay, & Broadhurst (1998) Landy, S.D., Szalay, A.S., & Broadhurst, T.J. 1998, ApJ, L133
- Metzler & Evrard (1997) Metzler, C., & Evrard, A.E. 1997, ApJ, submitted (astro-ph/9710324)
- Okamoto & Habe (1999) Okamoto, T., & Habe, A. 1999, ApJ, 516, 591
- Peebles (1980) Peebles, P.J.E. 1980, The Large-Scale Structure of the Universe (Princeton: Princeton Univ. Press)
- Roos & Harun-or-Rashid (1998) Roos, M., & Harun-or-Rashid, S.M. 1998, A&A, 329, L17
- Somerville, Davis & Primack (1997) Somerville, R., Davis, M., & Primack, J. 1997, ApJ, 479, 616
- Summers, Davis, & Evrard (1995) Summers, F.J., Davis, M., & Evrard, A.E. 1995, ApJ, 454, 1
- Thomas et al. (1998) Thomas et al. (The Virgo Consortium) 1998, MNRAS, 296, 1061
- Tormen, Bouchet, & White (1997) Tormen, G., Bouchet, F.R., & White, S.D.M. 1997, MNRAS, 286, 865
- West & Richstone (1988) West, M.J., & Richstone, D.O. 1988, ApJ, 335, 532
- Zurek et al. (1994) Zurek, W., Quinn, P.J., Salmon, T.K., & Warren, M.S. 1994, ApJ, 431, 559