ACCRETION DISKS AROUND YOUNG OBJECTS. II. TESTS OF WELL-MIXED MODELS WITH ISM DUST
Abstract
We construct detailed vertical structure models of irradiated accretion disks around T Tauri stars with interstellar medium dust uniformly mixed with gas. The dependence of the structure and emission properties on mass accretion rate, viscosity parameter, and disk radius is explored using these models. The theoretical spectral energy distributions (SEDs) and images for all inclinations are compared with observations of the entire population of Classical T Tauri stars (CTTS) and Class I objects in Taurus. In particular, we find that the median near-infrared fluxes can be explained within the errors with the most recent values for the median accretion rates for CTTS. We further show that the majority of the Class I sources in Taurus cannot be Class II sources viewed edge-on because they are too luminous and their colors would be consistent with disks seen only in a narrow range of inclinations. Our models appear to be too geometrically thick at large radii, as suggested by: (a) larger far-infrared disk emission than in the typical SEDs of T Tauri stars; (b) wider dark dust lanes in the model images than in the images of HH30 and HK Tau/c; and (c) larger predicted number of stars extincted by edge-on disks than consistent with current surveys. The large thickness of the model is a consequence of the assumption that dust and gas are well-mixed, suggesting that some degree of dust settling may be required to explain the observations.
1 Introduction
With the advent of IRAS, it became clear by the mid-1980s that the infrared excesses of many T Tauri stars were probably produced in dusty circumstellar disks rather than gaseous envelopes (e.g., Rucinski 1985). However, it was also recognized that the spectra of the infrared excess of T Tauri stars (Rydgren & Vrba 1987) was not of the form predicted either for a steady accretion disk (Lynden-Bell & Pringle 1974) or for a flat disk heated by radiation from the central star (Friedjung 1985), with the implication that the outer disk temperatures are much hotter than predicted by the standard models. A variety of mechanisms were invoked to explain this result, but the most robust model has proved to be that of the irradiated “flared disk” (Kenyon & Hartmann 1987, hereafter KH87). Because the scale height in a Keplerian (geometrically thin) disk varies with the sound speed and radius as , any disk temperature distribution which decreases less rapidly with radius than (expected on quite general grounds) causes the disk to become proportionately thicker with increasing . This “flaring” of the disk allows it to absorb more radiation from the star, especially at large distances, resulting in spectral energy distributions (SEDs) that reproduce observations much better (KH87; Kenyon & Hartmann 1995, hereafter KH95).
More detailed models of flared disks, which relax the assumption of vertical isothermality adopted by KH87, have been constructed by Chiang & Goldreich (1997, hereafter CG), who presented a two-isothermal-layer model, to allow for irradiation heating of the upper layers, and by D’Alessio et al. (1998, hereafter DCCL), who solve the detailed vertical hydrostatic disk structure with irradiation and viscous heating self-consistently. Although the resulting model SEDs have been shown to agree with observations of a single T Tauri star in each of these papers (not the same star in both), they have not been shown to agree with typical disk emission spectra. Moreover, there are reasons to suspect that these models, which assume well-mixed gas and dust throughout the disk, may not be able to reproduce many results. In particular, the disk models presented in these studies are so vertically thick that, if inclinations were randomly distributed, roughly half of all T Tauri stars should be hidden behind their disks for typical radii. Not only would this mean large incompleteness in present surveys of star-forming regions, it would also suggest that many of the Class I objects, which were originally thought to be protostars with infalling dusty envelopes, might simply be T Tauri stars seen edge-on. On the other hand, the results of Miyake and Nakagawa (1995) suggested that some T Tauri SEDs could be explained with flat disks, possibly implying dust settling to the disk midplane.
In this paper we construct detailed irradiated disk models for T Tauri stars and compare them with typical T Tauri SEDs. This comparison suggests that T Tauri disks are thinner than predicted by the models with complete mixing of ISM dust and gas. Survey incompleteness due to stars hidden behind their edge-on disks does not seem to be very large. We also argue that most Class I objects in Taurus cannot simply be edge-on disks, but are probably protostars surrounded by their infalling envelopes, as previously proposed (Adams, Lada, & Shu 1987; Kenyon, Calvet & Hartmann 1993). The models suggest that the assumptions of complete mixing of dust and gas and standard ISM dust may need to be relaxed, and we explore such new models in a subsequent paper.
2 Disk Models
2.1 Assumptions and Methods
We solve self-consistently the complete set of vertical structure equations, including irradiation and viscous heating, resulting in detailed profiles of temperature and density with vertical height. The model of the disk vertical structure is calculated with the equations and method described by DCCL, as summarized briefly here. The disk is assumed to be geometrically thin and in steady state with a constant mass accretion rate , and in vertical hydrostatic equilibrium. The viscosity is described using the prescription (Shakura & Sunyaev 1972), with a viscosity coefficient written as , where is the local sound speed, is the local scale height of the gas and is the viscosity parameter, assumed constant through the disk. The scale height is given by , where is the angular Keplerian velocity and is the local temperature. A characteristic scale height of the disk is , calculated with the sound speed evaluated at the midplane temperature . The disk has azimuthal symmetry, and its equations are written in cylindrical coordinates , where is the radial distance from the star, in a direction parallel to the disk midplane, and is the vertical distance from the midplane, in a direction parallel to the rotation axis.
The radiation field is separated into two frequency ranges as proposed by Calvet et al. (1991, 1992), one characteristic of the stellar effective temperature and the other corresponding to the local disk temperature. We use mean opacities to quantify the disk interaction with the two different radiation fields. The Planck mean absorption coefficient for a stellar effective temperature is similar to the monochromatic absorption coefficient at (e.g. KH87). The stellar radiation field is described as a beam of parallel rays impinging on the disk surface at an angle relative to the disk normal.
The differential equations for the disk vertical structure are the same as those in DCCL. We write them here in a slightly different and clearer way. First, we consider the equations for radiative transfer in the “disk-frequency range” (Mihalas 1978),
| (1) |
| (2) |
where and are the flux and the mean intensity, respectively, at the disk frequency range, is the mass density, and are the Planck mean and the Rosseland mean opacities, respectively, and is the Stefan-Boltzmann constant.
The disk energy balance equation is
| (3) |
where is the total flux given by the sum of the radiative, convective, and turbulent energy fluxes (DCCL). Here, is the heating due to viscous dissipation (e.g., Frank et al. 1992), is the heating due to ionization by cosmic rays and radioactive decay (Nakano & Umebayashi 1986; Stepinski 1992) and is the heating by irradiation. This last heating function can be written as (see DCCL):
| (4) |
where is a mean opacity calculated using the Planck function at the stellar effective temperature as a weighting function, and and are the mean intensities of the direct and scattered stellar radiation field. To calculate the transfer of the stellar radiation through the disk, we use the formulation of Calvet et al. (1991, 1992), with the assumption of constant albedo in the region of the atmosphere where most of the stellar radiation is scattered. The mean intensity of the direct stellar radiation field is given by
| (5) |
where is the vertical optical depth to the stellar radiation and is the mean intensity of the stellar radiation at the top of the disk. The scattered mean intensity is
| (6) |
where is the mean albedo, , is the stellar flux intercepted by the “irradiation surface” of the disk. We take as the cosine of the angle between the incident direction and the normal to this surface. The irradiation surface is defined by requiring that the optical depth in the direction to the star is , with calculated integrating the opacity in the radial direction, i.e.,
| (7) |
where , and is a mean opacity calculated including true absorption and scattering, using the Planck function evaluated at as the weighting function. Since this optical depth depends on the disk structure, which in turn depends on the irradiation flux, we iterate to find the self-consistent disk structure. Notice that in equations (5) and (6) we have used the plane parallel approximation, so , but this approximation is not used to find the height of the irradiation surface.
The turbulent and/or convective energy transport are included as
| (8) |
where is calculated taking into account that the disk may have a finite optical depth (i.e., without using the diffusion approximation) and that the convective elements lose energy by radiation and by the turbulent flux (see DCCL and D’Alessio (1996) for details).
Finally, we have the vertical hydrostatic equilibrium equation
| (9) |
where is the gas pressure, is the component of the stellar gravity, i.e., , where is the stellar mass, and we have neglected radiation pressure and the disk self gravity.
The boundary conditions for these equations are basically the same as in DCCL. At the disk midplane the fluxes are zero because of reflection symmetry. The height of the disk is an unknown boundary where we specify the ambient gas pressure , the emergent fluxes produced by viscous dissipation , ionization heating (by cosmic rays and radioactive decay) and irradiation , and the mean radiative intensity at the disk frequency , where is a function of and (cf. DCCL). The turbulent and convective energy fluxes equal zero at by definition. We assume , which is an arbitrary value, but small enough that its precise value does not significantly affect the resulting disk structure.
The intercepted irradiation flux is calculated as the component of the incoming stellar radiant energy normal to the irradiation surface (instead of the surface where the pressure is the ambient pressure , as in DCCL). Note that the normal to the disk surface is not precisely in the z direction. Since the slope of this irradiation surface is used to evaluate and (see KH87) we estimate this slope using the following procedure. We fit a power law to the height of the irradiation surface, , in an interval centered at each radius and the slope is estimated as , using the actual value of . This smoothing procedure accelerates the convergence and avoids numerical instabilities, and is justified since irregularities in the shape of the disk surface are damped in times shorter than the viscous timescale (Cunningham 1976; D’Alessio et al. 1999). The irradiation flux is the fraction of the intercepted stellar flux absorbed or scattered by the disk. We estimate this fraction as , where is the total optical depth of the disk to the stellar radiation. We calculate the flux as described by KH87, but multiply by to take into account that there can be optically thin regions, which cannot absorb all the intercepted stellar radiation. For typical parameters of T Tauri disks, .
The disk dust opacity is calculated using optical constants from Draine & Lee (1984) and the MRN size distribution (Mathis, Rumpl & Nordsieck 1977). For the gaseous component, we use the opacities described by Calvet et al. (1991). In this paper, we assume that gas and dust are well mixed and thermally coupled.
2.2 Fiducial Model
To illustrate the basic results of the detailed disk calculations, we constructed a fiducial disk model using typical parameters of CTTS. The central star is assumed to have a radius , a mass , and an effective temperature K typical of K7-M0 T Tauri stars in Taurus (KH95). We adopt a mass accretion rate and a viscosity parameter , as suggested by recent studies (Gullbring et al. 1998; Hartmann et al. 1998). Variations of the outer disk radius are easily incorporated in our formalism; the fiducial model has . We also include an inner disk hole, consistent with a magnetospheric radius of (Kenyon et al. 1994a; Kenyon, Yi, & Hartmann 1996; Meyer, Calvet, & Hillenbrand 1997).
Figure 1 shows characteristic temperatures, heights, surface density, and mass of the fiducial disk model as functions of the distance to the central star. The plotted temperatures are the temperature at the midplane , the irradiation temperature , which is the effective temperature corresponding to the irradiation flux , the surface temperature , given by the temperature at , the viscous temperature , defined as , and the photospheric temperature , defined as the temperature at the height where the Rosseland mean optical depth is , so it is only plotted for those regions where the disk total vertical Rosseland optical depth is larger than this value.
A comparison of and indicates that for irradiation is the main heating agent of the disk upper layers, while in the inner disk the viscous flux is significant in comparison with the irradiation flux. In this region, is larger than because the disk is optically-thick to its own radiation, resulting in effective trapping of the viscously-generated flux. The plateau in is a result of dust sublimation, which acts as a kind of thermostat because the gas opacity for K is very low. As the central temperature rises beyond K, the dust opacity which produces the high central temperature by trapping of viscous energy disappears. This results in sublimation of dust near the midplane, while the layers near the photosphere retain enough dust opacity to produce a nearly fixed central temperature.
The total optical depth of the fiducial disk model at its own radiation becomes for . Beyond , it is smaller than 2/3 and is no longer defined; however, the central temperature dependence on radius is similar to that of the regions where the disk is optically thick to its own radiation, as long as the optical depth to the stellar radiation is very large. To see the reason for this, consider the limit where the cosmic ray and viscous heating can be neglected. In this limit, the energy balance equation (eq. 1) can be written as
| (10) |
using and equation (3). When the disk is very optically thick to the stellar radiation, the high optical depth prevents the stellar radiation from reaching directly the disk midplane and the irradiation heating , (eq. 4), so the temperature then depends only upon . Similarly, near the midplane, (by reflection symmetry) and equation (2) yields . So, is approximately constant in height at given radius; using the boundary condition, it is given by
| (11) |
where is the relevant Eddington factor (cf. §2.1). Thus energy balance yields a central temperature
| (12) |
and therefore the temperature has the radial dependence of the fourth root of the irradiation flux, in this case .
The terms on the left-hand side of the energy balance equation (10) represent integrals over frequency, and in a more complete treatment can be written as , where is the mean opacity weighted by the disk mean intensity. We are assuming that , i.e. that the disk radiation field has a spectrum comparable to that of the local Planck function . The characteristic temperature of the hotter upper regions where most of the stellar radiation is absorbed, and therefore where most of is produced is roughly . Figure 1a demonstrates that is only slightly higher than from the detailed numerical calculations, so it appears to be a reasonable approximation to set in our models.
Other treatments attempt to include the difference in effective wavelength of the radiation emitted in different parts of the disk in an approximate way, but these approaches have other difficulties. For instance, CG assumed that the hot upper layer which absorbs the central star’s light radiates into the disk at the maximum temperature, so that can be characterized by a temperature , and this is much hotter than the central temperature. However, this approximation overestimates the characteristic temperature of because most of the radiation of the upper layers is produced at lower temperatures than , as discussed above. Moreover, the CG treatment differs most from ours in the case where the disk is assumed to be optically thick to the hot layer radiation but optically thin to its own radiation; but CG ignore the vertical stratification of the radiation field, and for optically-thick transfer, the hot layer radiation will be degraded into lower-temperature emission as the energy moves toward the disk midplane.
In the case where the central layers of the disk are optically thick to the radiation impinging upon them but optically thin to their own radiation, a typical assumption is to write the energy balance equation as
| (13) |
namely, optically thick heating is balanced by optically thin cooling. The temperature of the assumed isothermal layer obtained from this equation has a much flatter radial dependence than (Cantó et al. 1995; Aikawa et al. 1999). We can obtain this equation by taking the integral over the vertical optical depth of the energy transport equation (1), from which we can write
| (14) |
where
| (15) |
With , this equation becomes
| (16) |
for , which is similar to equation (13). This shows that the temperature that is obtained by using equation (13) is a mean temperature over the vertical structure and not the actual physical depth-dependent temperature of the interior. This distinction may be important when considering disk properties which are very very sensitive to local conditions as for instance, the molecular processes which determine the chemical composition of the disk (Aikawa et al. 1997, 1999).
Irradiation, enhanced by the disk curvature, also dominates the thermal structure of the disk atmosphere. The surface temperature is higher than the photospheric temperature, since the stellar incident energy is mostly deposited in the upper layers of the disk; this, in turn, is due to the large dust opacity at wavelengths characteristic of the stellar radiation and to the oblique entry of this radiation into the disk (Calvet et al. 1991, 1992; Malbet & Bertout 1992; CG). This is the temperature inversion found by Calvet et al. (1991), which can produce molecular and silicate bands in emission even when the disk is optically thick. The inversion is present even in the regions where the disk is optically thin to its own radiation, so (Figure 1a).
Figure 1b shows some characteristic heights of the disk as a function of radius. We have plotted the irradiation surface height , the photospheric height (where ), the maximum height of the disk (where , see §2.1) and the gas scale height , calculated using the sound speed at the disk midplane. In particular, can be taken as proportional to for , as in the approximation usually found in the literature, with a proportionality constant . The height corresponds to a flared surface, with , at least for which is the maximum disk radius we have considered. On the other hand, the photospheric height has a maximum beyond which it decreases as the disk becomes optically thin to its own radiation. However, since the disk is still optically thick to the stellar radiation in the radial direction, is flared in regions where bends down. The behavior of and the bump shown by led Bell et al. (1997) to conclude that the outer disk was in the shadow of the inner disk, ignoring the role of the material at the upper disk atmosphere, which is able to absorb and scatter stellar radiation effectively. Our results contradict their claim, since a more realistic treatment, allowing for the very different wavelengths at which light is absorbed and emitted by the disk, results in no shadowed regions.
The surface density of mass is the integral along the vertical direction of the volumetric mass density . In steady disk models using the prescription, (e.g., Frank et al. 1992). With in the outer disk, , as shown in Figure 1c. The surface density flattens towards smaller radii, where the midplane temperature increases in the optically thick annuli of the disk. The mass of the disk for the assumed viscosity parameter and mass accretion rate is for a disk radius in the range (Figure 1d), which is similar to the typical masses estimated from mm observations of CTTS (Beckwith et al. 1990; Osterloh & Beckwith 1995).
2.3 Consistency of the plane-parallel approximation
The incident stellar flux is calculated assuming there is a well-defined surface into which the radiation enters. Given the irradiation flux, we solve the transfer of stellar radiation, assuming a plane parallel geometry. This may not be a good assumption for the outer regions of the disk, where the height of the irradiation surface becomes of the order of the radial distance. To test this approximation, we have used the two-dimensional disk structure to calculate a posteriori the mean intensity of the direct stellar radiation at each depth attenuated by the radial optical depth,
| (17) |
where the integration is performed over the solid angle subtended by the star, as seen from each point of the disk. The stellar disk is divided into bands parallel to the disk midplane and symmetrically distributed with respect to the line between the center of the star and a given point of the disk. Ignoring the stellar diffuse field, the local heating by stellar radiation can be evaluated as
| (18) |
where the subindex refers to the direct incident stellar radiation. Thus, the flux corresponding to the irradiation input of energy, which has to emerge at the top of the disk is
| (19) |
Figure 2 shows the flux and given by the stellar flux intercepted by the irradiation surface, absorbed by the disk, calculated using the plane-parallel approximation and the iterative method described in §2.1. To make a consistent comparison, the flux is smoothed fitting a local power law in intervals of centered at each radius, which is the same kind of smoothing procedure we have done in the iterative plane parallel calculation. Figure 2 shows that both fluxes are very similar. Since one of them results from a ray by ray integration of the transfer equation of the stellar radiation, and the other was obtained using the plane-parallel approximation, we conclude that the latter is a good approximation to describe the effect of the stellar irradiation on the disk.
The plane-parallel approximation breaks down for the transfer of radiation in the “disk-frequency” range in the outer disk, where the relevant optical depths can become small. We estimate that this does not greatly affect our calculated temperature distributions, which are effectively determined by the balance between the irradiation flux heating, which is relatively well known as discussed above, and optically-thin cooling, which is insensitive to geometry. A detailed test of this approximation requires two-dimensional radiative transfer and is beyond the scope of this paper.
2.4 The Parameter Space
We next explore the effect of changing the disk mass accretion rate and the viscosity parameter . Figures 3 and 4 show the resulting disk structure for , , and , and , 0.01, and 0.1, for a fixed central star with , and . The panels are organized in such a way that the surface density of the disk increases towards the bottom and the right of the figure, as increases.
Figure 3 shows the radial distribution of characteristic temperatures: , , , and (defined in §2.2). The lower the mass accretion rate, the smaller the contribution of viscous dissipation as a heating mechanism of the disk photosphere, which can be seen by comparing and . For , the disk photospheric temperature distribution is dominated by stellar irradiation (upper panels).
The behavior of the central temperature in the inner disk depends upon the relative importance of viscous dissipation and irradiation and upon the optical depth of the disk, which in turn . As the optical depth increases, the ratio increases. In all optically thick models, the central temperature shows the plateau at due to dust sublimation, as in the fiducial model (§2.2). Since viscous heating at a given radius increases with mass accretion rate, the outer boundary of the dust sublimation region moves outwards with higher .
For and , which corresponds to the densest disk model shown in Figure 3, the midplane temperature becomes very high, reaching at . The dominant opacity source at this high temperature range is the ionization of H, He and metals, and the disk probably is subject to thermal instabilities (Kawazoe & Mineshige 1993; Bell & Lin 1994).
In all models, irradiation heating enhanced by the flaring of the surface dominates in the outer disk. The radius where irradiation begins to dominate () increases as increases. In the lowest surface density cases we have calculated, and (left upper corner in Figure 3), the temperature distribution flattens out at large radii. In this regions, the disk becomes optically thin to both its own radiation and the stellar radiation. In this case, a fraction of direct and diffuse stellar radiation is able to penetrate the disk and reach the midplane, so (c.f. §2.2).
Figure 3 shows the surface temperature inversion discussed in §2.2, in many models over a wide range of radii ( for ). The upper layer temperature is approximately the temperature of optically thin dust heated by stellar radiation only geometrically diluted (e.g., Calvet et al. 1992; CG; DCCL) and it is independent of and , being sensitive to dust properties, the effective temperature and luminosity of the central star, and other cooling ingredients different from dust (CO, H2O, etc).
Figure 4 shows the mass surface density of the different models, with the fiducial repeated in each panel as a reference. ¿From this plot it is clear that scales as . As mentioned above, the surface density of a steady -disk is , but in the outer regions the midplane temperature is almost independent of and , since irradiation is the dominant heating mechanism, The disk mass, given in Table 1 for three different disk radii, depends on the mass surface density of the outer annuli, and scales roughly as .
Regions in the disk are unstable to axisymmetric gravitational perturbations if the Toomre parameter
| (20) |
(Toomre 1964) is less than unity. It has been suggested that disks cannot maintain such regions because they will be unstable to non-axisymmetric gravitational perturbations which effectively transfer angular momentum, causing rapid accretion (e.g., Pringle 1981). The most unstable regions in our models occur at large radii. Table 1 shows the radius beyond which . The most critical case is the disk model with and , which is gravitationally unstable for .
3 Comparison with Observations
3.1 Calculation of the Model Emission
Given the disk structure and assuming an inclination angle between the disk axis and the line of sight, we integrate the radiative transfer equation through the disk along rays parallel to the line of sight, in a grid of points at the plane of the sky. To calculate the disk thermal emission we integrate
| (21) |
| (22) |
where is the coordinate along the ray which is zero at the plane of the sky and increases towards the observer, is the monochromatic optical depth, is the Planck function evaluated at the local temperature, is the true absorption coefficient, and is the total opacity including absorption and scattering.
The contribution of the stellar radiation scattered by the disk is calculated assuming single and isotropic scattering, so we integrate the transfer equation
| (23) |
where is the scattering coefficient, is the geometric dilution factor of the stellar radiation which reaches radial distance , is the Planck function evaluated at the stellar effective temperature, and is the optical depth in the radial direction, between the star (assumed as a point-like source) and the point in the disk. For each wavelength we calculate in cylindrical coordinates once, and use this array to interpolate during the integration of equation (23). We calculate the emergent intensity of the disk thermal radiation at 57 wavelengths between and , and since the intensity of the stellar radiation peaks around , we calculate the scattered light contribution only at 13 wavelengths between and .
The intensity emerging at each ray is crossing the plane of the sky is
| (24) |
where is the stellar intensity, which is added if the ray intersects the stellar disk, and is the optical depth towards the central star produced by the disk.
Finally, we calculate the fluxes and images of disks with arbitrary orientations and at different wavelengths, convolving with appropriate Gaussian instrumental responses. More details about this procedure and useful integration limits can be found in D’Alessio (1996). We take the observed SED of V819 Tau which is a weak emission T Tauri Star (WTTS), scaled to 1 , as the typical central star for calculating the system SED.
3.2 SEDs
3.2.1 The Median Observed SED
The principal observational constraints we use in this paper come from the SEDs of T Tauri stars in the Taurus-Auriga molecular cloud, taken from the compilation of KH95. Taurus may not be the most representative region of star formation, but it is nearby, well-studied, and not heavily extincted, so that its stellar population is fairly well characterized (e.g., Hartmann et al. 1991; Gomez et al. 1993; Briceño et al. 1997, 1998).
Analysis of the SED of any particular source is complicated by a number of effects. One of the principal concerns must be the presence of binary companions, especially infrared bright-companions, such as in T Tau (Ghez et al. 1991), which can alter the interpretation of the spectrum dramatically. In some cases the near-infrared spectra can be decomposed between the objects (e.g., Simon et al. 1992, 1995; Leinert et al. 1993); however, the IRAS fluxes, which are crucial to understanding the (cool) outer disk structure, cannot similarly be separated into individual components because of poor spatial resolution. Beyond this, there are many other factors - variability, uncertainty in extinction corrections, IRAS sensitivity limits, observational errors, effects of (generally unknown) inclination which render the fitting of an individual SED non-unique.
For these reasons we have estimated a median TTS SED, with a measure of the typical range of SED properties, for comparison with the disk models. To do this we first selected K5-M2 stars from KH95 to isolate a reasonably restricted range of stellar effective temperature (this also happens to include a large fraction of the known T Tauri stars in Taurus). We eliminated the WTTS, to avoid including objects which have little or no infrared excess emission from disks. We also eliminated a few objects for which the data is inadequate, or which may have infrared excesses dominated by envelope rather than disk emission (e.g., Calvet et al. 1994). Finally, we eliminated objects for which the strong optical veiling makes the intrinsic system colors uncertain, and therefore have very uncertain extinctions. These criteria resulted in a final list of 39 objects for further study, as listed in Table 2. As described in KH95, we adopt the luminosity estimate from the reddening-corrected J magnitude, , as the best estimate of the stellar luminosity (Table 2).
We then corrected the individual SEDs for extinction, using the values given in KH95, and normalized all the SEDs at m. This normalization was motivated by the expectation (as confirmed below) that most of the disk heating in typical TTS is from absorbing light from the central star, not by intrinsic accretion energy generation, in which case the disk luminosity should scale with the stellar luminosity. For this sample of stars, which have nearly the same effective temperature, it is sufficient to normalize in the H photometric band, near the peak of the stellar SED. Adopting a near-infrared rather than optical wavelength for normalization also helps minimize the effects of errors in extinction corrections.
The median fluxes and quartile limits resulting from this procedure are given in Table 3, and the median fluxes along with the individual observations normalized at m are illustrated in Figure 5. Substantial scatter is observed at each wavelength, but there is a clearly defined trend encompassing most objects. The dot-dashed line is the median SED, constructed independently at each wavelength. This median is straightforwardly constructed except at m, where 13 of the 39 objects are undetected, and at mm wavelengths, where there is very large incompleteness. Figure 5 shows the two estimates of the median, calculated with and without the upper limits at 100 m; the difference at this wavelength between the two estimates is comparable to the quartile scatter in the median. In the subsequent comparison between the observed median and the models we adopt the 100 m value which allows for incompleteness (i.e., calculated with upper limits). We emphasize that the mm-wave points are meant to be indicative rather than definitive; these fluxes are not used as constraints on disk models in this paper because we do not consider changing dust opacities (see below).
This is not the only way of developing a median SED. We have tried normalizing at the J and K photometric bands, but the results are essentially the same. A crucial parameter of our models is the ratio of the disk brightness to the stellar brightness, and so normalization at the peak of the stellar SED rather than at some wavelength dominated by disk emission seems most appropriate.
In principle, the median flux approach might not yield the correct SED spectral indices as a function of wavelength if the underlying SEDs are not smooth. In practice, this does not seem to be a problem. The spectral indices derived from our median spectrum agree well with the average spectral indices derived by KH95 by straight averaging of spectral slopes without normalization.
It might be objected that our method of normalization (basically to the stellar luminosity) introduces additional error in cases where the accretion luminosity is not negligible. In such cases, the absolute values of and are important. However, it can be seen from Table 2 that most of the objects selected have quite similar stellar luminosities; half of the sample have , so that normalization introduces relatively small shifts in the data for many objects. We think that the advantages of our procedure in establishing a well-determined, stable benchmark SED to test models against outweigh the disadvantages of giving individual differences reduced weight, especially because irradiation heating probably dominates accretion energy release in most of the sample. In any event, since we do not include continuum stars which are likely to have high accretion rates, neither our sample nor our method are well-suited to an exploration of the extreme range of properties among T Tauri disks.
3.2.2 Fiducial model SED
Figure 6 shows the median observed SED compared to the SEDs of the fiducial model and of a flat disk with the same stellar and disk parameters, assuming an inclination angle of . Fluxes are presented for the fiducial model truncated at three different outer radii, 30, 100, and 300 AU.
It is evident that the fiducial model, viewed at the median inclination expected for a random distribution of orientations, is roughly consistent with the SEDs of many T Tauri stars from near-infrared wavelengths out to around 100 m. However, the model fluxes are slightly too low around m, and somewhat too high in the m range, when compared with the median SED, though the latter problem may be reduced if disk radii are smaller than the typical 100 AU estimate.
The largest systematic problem of the fiducial model occurs at mm wavelengths, where the model fluxes are too low by a factor of 10 (for ). In contrast with the disk flux at shorter wavelengths, which is dominated by optically-thick regions, much of the disk emission in the mm range is produced by optically thin regions, and so is strongly dependent upon the dust opacity at long wavelengths. The typical practice in modeling mm emission of T Tauri disks is to adjust the dust opacity to larger values than resulting from the Draine and Lee (1984) calculations. A frequently-used estimate (e.g., Beckwith et al. 1990) would increase the 1 mm opacity by a factor of 10 over what we are using here, and such an opacity increase would bring the model fluxes into much better agreement with observations. We defer discussion of matching the long-wavelength fluxes to the next paper in this series, where we will consider the effect of changing dust opacities.
The comparison between the fiducial model and the flat disk model shows that flaring is relatively unimportant in determining the flux in the m wavelength range. To estimate the required additional heating of the inner region, we made the experiment of increasing the irradiation flux by a factor of 2.5 for ; this increases the disk photospheric temperature by a factor of 1.2, and gives rise to a spectrum identical to the observed median SED in the range m. This required large increase in heating suggests that reducing the dust albedo will not explain the discrepancy. Alternatively, an increase of of a factor would produce the requiring heating (see §3.2.3).
The far-infrared flux increases as the outer disk radius increases because the flaring results in more light from the central star to be intercepted by the disk. The large far-IR excesses are a consequence of the substantial vertical thicknesses of the disk models. The corresponding result is that more lines of sight to the central star are strongly extincted by the disk. For the fiducial parameters, an outer disk radius of 300 AU results in substantial extinction of the star by the disk; at , the star would appear to be extincted by approximately , as shown in Figure 6. Although in principle this extinction would be removed by the reddening correction used in constructing the model SEDs, this value is rather large in comparison with the extinctions adopted for most Taurus Class II sources (Table 2).
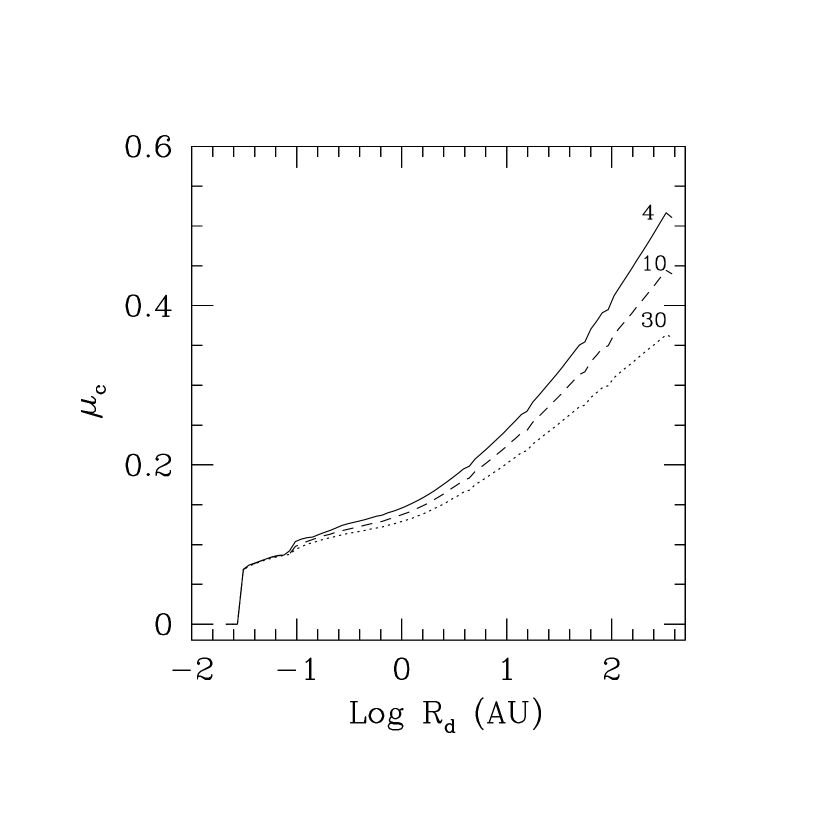
To illustrate the disk extinction in more detail, we calculated surfaces of constant along the line of sight to the star. It is convenient to present these results in terms of a critical angle , such that . Thus, is the cosine of the inclination angle at which an observer would view the central star through magnitudes of visual extinction for a disk of outer radius . For inclination angles greater than , the extinction is larger, and vice versa.
Figure 7 shows for and for the fiducial model. The curves show why the models with outer radii AU exhibited only small extinction toward the central star at (), while the 300 AU outer radius model heavily extincted the star. The fiducial model has a substantial vertical thickness (cf. Figure 1b); the “disk photosphere” that an observer might define at visual wavelengths would be quite thick, with a height of nearly half the cylindrical radius at 100 AU.
The large vertical thickness of the fiducial disk model implies that the central star would be heavily extincted at a wide range of inclination angles. To illustrate this in detail, Figure 8 shows SEDs of our fiducial model as a function of inclination, fixing . As inclination increases, the star first becomes heavily reddened. At large inclination, , the SED becomes separated into two distinct peaks, with the short-wavelength emission resulting from stellar light scattered by the disk into the line of sight.
Large vertical thickness and corresponding large extinction towards the star for a large range of inclination angles are also found by CG and Chiang & Goldreich (1998), who assumed that the dust and gas are well mixed as we do in this work. However, the disk thickness and the resulting infrared emission are larger in the Chiang & Goldreich models than in ours. The difference arises for two reasons. First, we include a finite albedo. Second, as discussed in §2.2, the disk atmosphere in our calculations has a range of temperatures (similarly to a stellar atmosphere), and the temperature where most of the emission of the upper atmospheric levels is produced is lower than the single temperature CG assume for these upper layers.
Conversely, the isothermal disk models of Miyake & Nakagawa (1995) exhibited thinner disk structure than found here. However, even with this property, Miyake & Nakagawa argued that the SEDs of a few T Tauri stars could be explained only if their disks were geometrically flat, which could be attributed to dust settling toward the disk midplane.
One other property to note is the presence of emission in the 10 silicate band in the low inclinations disk models; this band is produced by the temperature inversion in the disk atmosphere (Calvet et al. 1991, 1992), which is more conspicuous in the SED of flared disk models than in the flat disk. Both, the flat and the flared models have a temperature inversion in the vertical direction (Calvet et al. 1991, 1992), but the smaller the angle between the incidence direction and the disk normal, the larger the vertical optical depth of the atmospheric layer where the largest fraction of stellar energy is deposited and the more important its contribution to the disk SED. As inclination increases, a very strong silicate absorption feature develops (as also is shown by Chiang & Goldreich 1998, hereafter CG2).
3.2.3 SED dependence on and
The models presented in §2.4 cover a range of compatible with observations of veiling in CTTS (Valenti, Basri & Johns 1993; Hartigan, Edwards & Ghandour 1995; Gullbring et al. 1998). In this section we show how the SEDs depend on and to see if different combinations of these parameters give a better fit to the median SED than our fiducial model.
Figure 9 shows SEDs of irradiated accretion disks with the same parameters as in §2.4, namely, , , and , and , 0.01, and 0.1, at an inclination . The near-IR emission (m) is dominated by optically thick regions at (see §2.4). The difference between the models with and (upper panels in Figure 9) is small because irradiation is the dominant heating source at low accretion rates. For these models the near IR flux (at ) is smaller than the median (approximately at the level of the lower quartiles). On the other hand, accretion energy is important in enhancing the optically thick emission for the , and so these models exhibit near IR fluxes larger than the median and the upper quartiles.
We find that an accretion rate of fit the median observed SED in the 2-8 spectral range reasonably well. This is slightly larger than the median accretion rate of found by Gullbring et al. (1998). Note that the actual median stellar luminosity is , so the required mass accretion rate would be . The agreement is reasonably satisfactory considering that there may be systematic errors in accretion rates at the factor of two level. Moreover, the spread between the quartile fluxes is consistent with a random distribution of inclinations and a quartile spread of order in accretion rates consistent with observations (Hartmann et al. 1998).
The mid- to far-infrared fluxes () are much less sensitive to the accretion rate because of the importance of irradiation in outer disk regions. In general, the models in the grid also show the same excess in this wavelength region relative to the median SED that the fiducial model exhibits. The exception is the lowest accretion rate, largest- model; in this case the m flux is reduced because the very low mass disk becomes optically thin. However, these model parameters do not seem to represent a good solution to the excess mid- to far-IR fluxes, because the mm-wave fluxes become extremely small, and it would require an enormous increase in the long-wavelength opacity to reconcile the model with observations.
The flux in the mm range tends to scale as the disk mass (e.g., Beckwith et al. 1990), which in our grid of fixed radius models scales as . Figure 9 shows that models with an larger by a factor of 10 with respect to the fiducial model (i.e., and or and ) can account for the mm emission without changing the dust opacity (cf. discussion in previous subsection). However, the masses of these disks are (Table 1), not far from the limit for gravitational stability (Table 1; §3.2.2). In addition, the high of these disks results in near infrared fluxes much higher than the median SED.
At short wavelengths, the extinction of the stellar radiation produced by the disk is shown by the difference between the model fluxes and the median. As increases, so does the disk density and thus the towards the central star. To illustrate how the extinction depends on the disk parameters, Table 4 lists the cosine of the critical inclination angle, , for and . The excess of extinction of the central star radiation (cf. Table 4) and the excess of flux in the range are a consequence of the large vertical thickness of the disk models.
3.2.4 Images
Figure 10 shows images of the fiducial disk model for inclination angles such that and , and a disk radius . The images are calculated at m, convolving with a Gaussian point-spread function with a full width half maximum of 0.1 arcseconds (i.e., 14 AU at a distance pc). The contour levels are separated by a factor 1.58, which is approximately 0.5 magnitudes. For the flux from the star is obscured by the intervening disk material, and the scattered light intensity relative to the peak intensity is high. For the stellar radiation dominates the image, and the light scattered by the disk is not detectable by contrast.
The image of the edge-on disk () shows two elongated reflection nebulosities, almost parallel, separated by a dark lane. The apparent thickness of the disk, measured as the distance along the polar axis between the center of the elongated nebulae below and above the disk plane, is , and the aspect ratio of the image, as defined by thickness divided by diameter, is . It is similar in shape to, but larger in aspect ratio than, the disk model shown by Whitney & Hartmann (1992) (cf. their Figure 6), which has an aspect ratio of .
There are images of two known edge-on disks in Taurus with which we can compare the model predictions. The image of HH30 (Burrows et al. 1996) shows a clearly flared geometry. This geometry is not so apparent in the theoretical image because the extinction due to the dust in the outer disk is large, even at large heights, resulting in a very thick dark lane which hides the curvature of the irradiation surface. The HH30 disk can be detected out to a radius , which is larger than our fiducial model; however, increasing the radius of the disk model does not change the shape of the image, which still is not as flared as observed (as shown by Whitney & Hartmann 1992, cf. their Figure 7).
Burrows et al. (1996) found that the (isothermal) disk model which produces the best fit of the observed HH30 images has a scale height of 15.5 AU at (similar values are found by Wood et al. 1998). We compare this height to the theoretical local scale height (defined in §2.1) evaluated at the upper atmospheric layers, since these are the layers where most of the scattering is taking place. The scale height determined from fitting the scattered light is factor of 2 smaller than the gas scale height of the upper atmosphere of our fiducial model, calculated using the temperature . This suggests that the region of the atmosphere where most of the scattering is happening is colder than the upper atmospheric layers of the fiducial model, supporting the idea of a less flared irradiation surface.
HK Tau/c (Stapelfeldt et al. 1998; Koresko 1998) has a shape closer to the image of the edge-on model, i.e., two parallel reflection nebulae separated by a dark lane. The apparent thickness of this disk is AU (Koresko 1998) and the thickness of the dark lane is 0.13 times the apparent width of the nebulae (Stapelfeldt et al. 1998). In the case of the edge-on model, the relative thickness of the dark lane is times the observed one. Again, we conclude that the disk model is too thick to explain the observations. The disk model that Stapelfeldt et al. (1998) proposed as the best fit for HK Tau/c has a scale height of 3.8 AU at 50 AU. The scale height of the disk model evaluated at is a factor of 2 higher, and it is even larger at , suggesting again that the disk has to be thinner and colder than the model.
In summary, the thickness of the predicted dark lane in our edge-on fiducial model is larger than what is observed in HK Tau/c, and the overall disk structure is inconsistent with the observations of HH30, which also probably require a thinner absorption layer, suggesting that our fiducial model is a factor of too thick in the vertical direction.
4 Discussion
4.1 Edge-on Disks and Class I sources
If T Tauri disks have substantial geometrical thicknesses, then a sizeable number of objects should be viewed edge-on, through the disk. Many heavily-extincted young stellar objects could be edge-on disk systems, detected only as infrared sources. These considerations may suggest that some of the Class I infrared sources, usually interpreted as protostars surrounded by infalling envelopes (e.g., Adams et al. 1987; Butner et al. 1991; Kenyon, Calvet & Hartmann 1993) could be instead simply T Tauri stars viewed through their disks (CG2). For example, CG2 presented a SED calculation for a disk system viewed at an intermediate angle which agrees reasonably well with that of an individual Class I source in Taurus.
As in the case of T Tauri stars, in considering Class I sources it is helpful to analyze the properties of an entire population of objects rather than simply fitting an individual source. One clear prediction is that edge-on systems should appear less luminous than they really are, since the disk emission is reduced at large inclinations and the central star becomes heavily extincted (Figure 8). If Class I objects were simply Class II (face-on disk) systems viewed edge-on, then the Class I sources should appear to have systematically lower luminosities than Class II objects. Yet the luminosity distributions of Class I and Class II sources in Taurus (taken from KH95) are nearly identical (Figure 11). To make a quantitative test, we have constructed a predicted luminosity distribution for edge-on disk systems as follows. For a given stellar luminosity, , we calculate a frequency distribution of observed luminosities for the star+disk system assuming a random distribution of inclinations. We scaled the fluxes of the fiducial model to to obtain the luminosity of the star+disk system at a given inclination. We restrict the range of inclinations to , which corresponds to SEDs with increasing with , as expected for Class I objects. Finally, we convolved this frequency distribution with the observed distribution of stellar luminosities of Class II sources in Taurus. The luminosity distribution resulting from this procedure, shown in Figure 11, indicates that Class I sources are brighter than expected from edge-on disks, suggesting that only a modest fraction of these sources are likely to be edge-on disk systems. The luminosity distribution resulting from this procedure, shown in Figure 11, differs substantially from that of the currently recognized Class I sources in Taurus, suggesting that only a modest fraction of these sources are likely to be edge-on disk systems.
Another problem with interpreting Class I sources as edge-on disks is that the observed SEDs do not agree with the models over a significant range of inclinations. In particular, our models tend to predict extremely large silicate absorption, which is not observed in general (Kenyon, Calvet & Hartmann 1993). This can be illustrated by the color-color diagram vs. , shown in Figure 12. The circles represent the observed colors of Class II (open circles) and Class I (dark circles) sources in Taurus (KH95), the line corresponds to the colors of the fiducial model for . The predicted color , which quantifies the slope of the SED between the near and mid IR, increases with the inclination angle and for becomes larger than the maximum observed for a Class I source. Only disks within a narrow range of inclination angles would have the IR colors and bolometric luminosities consistent with observed Class I sources. Because the probability of observing an object in a given range of inclination is proportional to the range in , the model predicts a much larger number of sources with and colors much redder than observed.
In summary, while our models suggest, in agreement with CG2, that some Class I sources may be edge-on disk systems, most Class I sources are unlikely to be edge-on disk systems because they are not systematically underluminous in comparison with Class II (face-on disk) systems, and because their infrared colors and SEDs are inconsistent with disk model predictions for all but a narrow range of inclinations.
4.2 “Missing” sources
The model calculations shown in Figure 12 indicate that approximately 30% of all T Tauri disk systems should have colors and infrared SEDs which are not characteristic of known objects. In Taurus, with a total Class II T Tauri population of objects (KH95), this would correspond to about systems with peculiar SEDs. While this appears to be strongly inconsistent with observations, one must also consider selection effects. In particular, since edge-on systems are fainter, one must consider whether surveys have systematically missed these sources.
The first question we address is whether edge-on disk systems would be detectable as IRAS sources. As above, we scaled the edge-on disk models to the stellar luminosity distribution of Class II sources, but consider the flux distribution at 60 m instead of the luminosity distribution. We find that approximately 80 % of the edge-on disks should be detectable, using a flux limit of 0.5 Jy at 60 microns as adopted in the survey of faint Taurus sources by Kenyon et al. (1994b). Scaling from the known Class II sources in Taurus, this would suggest that there should be approximately 34 edge-on sources in the region which should be detected from IRAS surveys.
To test this hypothesis, we use the results of Kenyon et al. (1994b), who searched the IRAS Serendipitous Survey Catalog for previously unidentified point sources with fluxes exceeding 0.5 Jy at 60 microns, adding some other candidates with fluxes above 0.3 Jy at 25 or 60 microns provided they were detected in at least two bands from the SSC and the PSC2 catalogs. We selected objects from Kenyon et al. (1994b) which are not galaxies as found by near-IR imaging and which also were not classified as Class I or II sources. There are 19 such sources, out of which we estimated 8 candidates by comparison with theoretical SEDs at high inclinations. Figure 13 shows two of these candidates for edge-on systems: I04267+2221 and I04413+2608A. However, this estimate is likely to be a generous upper limit to the number of possible edge-on sources, since there is a lack of multiwavelength data for most of these objects. Some of these sources could still be galaxies (9) as mentioned by Kenyon et al. (1994b). In addition, not all objects with near-IR and far-IR peaks are necessarily edge-on disks. It is known that many young binary systems have greatly differing extinctions to the individual stars, and this multicomponent SED could mimic that of an edge-on disk. But even counting all these candidates and including the 10 Class I objects that overlap the predicted distribution of edge-on systems (Figure 11), we end up with 19 candidates, a factor of 2 lower than expected.
In summary, our disk models with well-mixed gas and dust appear to predict a larger number of low-luminosity, but detectable, highly reddened objects than consistent with current surveys of Taurus.
5 Conclusions
We have presented models of irradiated accretion disks with well-mixed ISM dust and compared them with observations representative of the entire population of Classical T Tauri stars in Taurus. We find that our models can explain the near-infrared fluxes of the median SED of T Tauri stars with a disk accretion rate consistent with the mean value estimated by Gullbring et al. (1997). However, our models appear to be too geometrically thick at large radii, as suggested by: (a) larger far-infrared disk emission than the typical SEDs of T Tauri stars; (b) scattered light images with wider dark dust lanes than observed in two objects in Taurus; and (c) model predictions of large numbers of T Tauri stars hidden by their edge-on disks which contradict current surveys.
Solar nebula theory predicts that dust settling and coagulation could occur on timescales that are comparable to or shorter than T Tauri lifetimes, (e.g., Hayashi, Nakazawa & Nakagawa 1985; Weidenschilling & Cuzzi 1993; Weidenschilling 1997). Because dust dominates the disk opacity, settling can strongly reduce the geometrical thickness of the disk, and may be required to explain the observations of T Tauri stars (Miyake & Nakagawa 1995). We will consider this possibility in a subsequent paper.
This work was supported in part by the Visiting Scientist Program of the Smithsonian Institution, by NASA grant NAG5-4282, by Academia Mexicana de Ciencia and Fundación México-EEUU para la Ciencia, by DGAPA/UNAM and CONACyT, México.
| TABLE 1 | |||||
| MODEL DISK MASSES AND TOOMRE RADIUS | |||||
| aaMass accretion rate in | bbMasses in | ccRadius in AU | |||
| -9 | -1 | ||||
| -9 | -2 | ||||
| -9 | -3 | ||||
| -8 | -1 | ||||
| -8 | -2 | ||||
| -8 | -3 | ||||
| -7 | -1 | ||||
| -7 | -2 | ||||
| -7 | -3 | ||||
| TABLE 2 | ||
|---|---|---|
| STARS USED FOR MEDIAN SED | ||
| Object | log | |
| HO Tau | 1.15 | -0.72 |
| HN Tau | 0.53 | -0.66 |
| DM Tau | 0.00 | -0.60 |
| GO Tau | 1.21 | -0.55 |
| FM Tau | 0.71 | -0.49 |
| FS Tau | 1.89 | -0.49 |
| DP Tau | 1.49 | -0.39 |
| IP Tau | 0.25 | -0.37 |
| CY Tau | 0.09 | -0.33 |
| V710 Tau | 0.90 | -0.27 |
| DI Tau | 0.78 | -0.21 |
| DS Tau | 0.31 | -0.19 |
| IQ Tau | 1.27 | -0.19 |
| CoKu Tau/3 | 3.35 | -0.18 |
| DH Tau | 1.27 | -0.17 |
| HK Tau | 2.39 | -0.17 |
| DD Tau | 0.78 | -0.14 |
| DQ Tau | 0.99 | -0.14 |
| AA Tau | 0.50 | -0.13 |
| JH 112 | 3.32 | -0.13 |
| LkCa 15 | 0.65 | -0.13 |
| V819 Tau | 1.40 | -0.09 |
| GM Aur | 0.15 | -0.08 |
| GI Tau | 0.90 | -0.07 |
| CI Tau | 1.83 | -0.06 |
| FY Tau | 3.56 | -0.05 |
| DN Tau | 0.50 | -0.04 |
| V955 Tau | 2.76 | -0.03 |
| BP Tau | 0.50 | -0.02 |
| GK Tau | 0.90 | 0.07 |
| DO Tau | 2.70 | 0.08 |
| Haro 6-37 | 2.17 | 0.11 |
| LkHa 332/G1 | 3.25 | 0.15 |
| GG Tau | 0.78 | 0.18 |
| DF Tau | 0.22 | 0.20 |
| UZ Tau E | 1.52 | 0.20 |
| UY Aur | 1.40 | 0.30 |
| FV Tau | 4.84 | 0.34 |
| V807 Tau | 0.00 | 0.61 |
| TABLE 3 | |||
|---|---|---|---|
| MEDIAN SED AND QUARTILES | |||
| Wavelength (m) | log (med) | upper | lower |
| 0.36 | -10.01 | -10.24 | -9.70 |
| 0.44 | -9.70 | -9.88 | -9.56 |
| 0.55 | -9.48 | -9.63 | -9.34 |
| 0.64 | -9.28 | -9.43 | -9.17 |
| 0.79 | -9.10 | -9.23 | -9.04 |
| 1.22 | -9.01 | -9.04 | -8.96 |
| 1.63 | -9.00 | -9.00 | -9.00 |
| 2.19 | -9.10 | -9.17 | -9.08 |
| 3.45 | -9.43 | -9.49 | -9.32 |
| 4.75 | -9.60 | -9.72 | -9.50 |
| 10.60 | -9.84 | -10.07 | -9.53 |
| 12.00 | -9.81 | -9.96 | -9.50 |
| 25.00 | -9.89 | -10.10 | -9.71 |
| 60.00 | -10.16 | -10.56 | -9.97 |
| 100.00 | -10.43 | -10.73 | -10.13 |
| 800.00 | -11.81 | -11.89 | -11.58 |
| 1100.00 | -12.26 | -12.33 | -11.86 |
| 1300.00 | -12.59 | -12.81 | -12.30 |
Note. - The m entry is the median flux for the sample including upper limits; the lower quartile flux cannot be directly determined because of the large number of non-detections, so the quartile spread is assumed to be the same as when considering only detections (see text).
| TABLE 4 | |||
| MODEL DISK CRITICAL ANGLE | |||
| -9 | -1 | 0.25 | 75.5 |
| -9 | -2 | 0.34 | 70.1 |
| -9 | -3 | 0.41 | 65.8 |
| -8 | -1 | 0.34 | 70.1 |
| -8 | -2 | 0.41 | 65.8 |
| -8 | -3 | 0.46 | 62.6 |
| -7 | -1 | 0.41 | 65.8 |
| -7 | -2 | 0.46 | 62.6 |
| -7 | -3 | 0.50 | 60.0 |
References
- Adams et al. (1987) Adams, F.C., Lada, C.J., & Shu, F.H. 1987, ApJ, 312, 788
- Aikawa et al. (1997) Aikawa, Y., Umebayashi, T., Nakano, T., & Miyama, S. M., 1997, ApJL, 51
- Aikawa et al. (1999) ikawa, Y., Umebayashi, T., Nakano, T., & Miyama, S. M., 1998, ApJ, (in press).
- Beckwith et al. (1990) Beckwith, S.V.W., Sargent, A.I., Chini, R. S., & Guesten, R. 1990, AJ, 99, 1024
- Bell & Lin (1994) Bell, K.R., & Lin, D.N.C. 1994, ApJ, 427, 987
- Bell et al. (1997) Bell, K.R., Cassen, P.M., Klahr, H.H., & Henning, Th. 1997, ApJ, 486, 372
- Briceño et al. (1997) Briceño, C., Hartmann, L., Stauffer, J., Gagne, M., & Stern, R.A. 1997, AJ, 113, 740
- Briceño et al. (1998) Briceño, C., Hartmann, L., Stauffer, J., & Martín, E. 1998, AJ, 115, 2074
- Burrows et al. (1996) Burrows, C.J., Stapelfeld,K.R., Watson, A.M., Krist, J.T., Ballester, G.E., Clarke, J.T., Crisp, D., Gallagher, J.S., Griffiths, R., Hester, J.J., Hoessel, J.G., Holtzman, J.A., Mould, J.R., Scowen, P.A., Trauger, J.T., Westphal, J.A., 1996, ApJ, 473, 437
- Butner et al. (1991) Butner, H.M., Evans, N.J. II, Lester, D.F., Levreault, R.M., & Strom, S.E. 1991, ApJ, 376, 636
- Calvet et al. (1991) Calvet, N., Patiño, A., Magris, G., & D’Alessio, P. 1991, ApJ, 380, 617 (CPMD).
- Calvet et al. (1992) Calvet, N., Magris, G., Patiño, A., & D’Alessio, P. 1992, Rev. Mex. Astronom. Astrofís., 24, 27
- Calvet et al. (1994) Calvet, N., Hartmann, L., Kenyon, S.J., & Whitney, B.A. 1994, ApJ, 434, 330
- Cantó, D’Alessio & Lizano (1995) Cantó, J., D’Alessio, P. & Lizano, S., 1995, in Disks, Outflows and Star Formation, ed. S. Lizano & J. M. Torrelles, RevMexAASC,1, 217
- Chiang & Goldreich (1997) Chiang, E.I., & Goldreich, P., 1997 ApJ, 490, 368 (CG)
- Chiang & Goldreich (1998) Chiang, E.I., & Goldreich, P., 1998, in press (CG2)
- Cunningham (1976) Cunningham, C., 1976, ApJ, 208, 534
- D’Alessio (1996) D’Alessio, P. 1996, Ph.D. Thesis, Universidad Nacional Autónoma de México, México
- D’Alessio et al. (1998) D’Alessio, P., Cantó, J., Calvet, N., & Lizano, S. 1998, ApJ, 500, 411 (DCCL)
- D’Alessio et al. (1999) D’Alessio, P., Cantó, J., Hartmann, L., Calvet, N., & Lizano, S. 1999, ApJ, in press
- Draine & Lee (1984) Draine, B. T., & Lee, H. M. 1984, ApJ, 285,89
- Frank, King & Raine (1992) Frank, J., King, A.R., & Raine, D. J., 1992, Accretion power in Astrophysics, (Cambridge: University Press), p.72.
- Friedjung (1985) Friedjung, M., 1985, A&A, 146, 366
- Ghez et al. (1991) Ghez, A.M., Neugebauer, G., Gorham, P.W., Haniff, C.A., Kulkarni, S.R., Matthews, K., Koresko, C., & Beckwith, S.V.W. 1991, AJ, 102, 2066
- Gómez et al. (1993) Gómez, M., Hartmann, L., Kenyon, S.J., & Hewett, R. 1993, AJ, 105, 1927
- Gullbring et al. (1998) Gullbring, E., Hartmann, L., Briceño, C, & Calvet, N. 1998, ApJ, 492, 323
- Hartigan, Edwards & Ghandour (1995) Hartigan, P., Edwards, S., & Ghandour, L. 1995, ApJ, 452, 736
- Hartmann et al. (1991) Hartmann, L., Stauffer, J.R., Kenyon, S.J. & Jones, B.F. 1991, AJ, 101, 1050
- Hartmann et al. (1998) Hartmann, L., Calvet, N., Gullbring, E., & D’Alessio, P. 1998, ApJ, 495, 385
- Hayashi, Nakazawa & Nakagawa (1985) Hayashi, CH., Nakazawa, K. & Nakagawa, Y. 1985, in Protostars and Planets II, eds. D.C. Black and M.C. Matthews (Tucson: University of Arizona Press), p.1100
- Kawazoe & Mineshige (1993) Kawazoe, E. & Mineshige, S. 1993, PASJ, 45, 715
- Kenyon & Hartmann (1987) Kenyon, S.J., & Hartmann, L. 1987, ApJ, 323, 714 (KH87)
- Kenyon, Calvet & Hartmann (1993) Kenyon, S.J., Calvet, N. & Hartmann, L. 1993, ApJ, 414, 676
- (34) Kenyon, S.J., Whitney, B.A., Gómez, M., & Hartmann, L. 1993, ApJ, 414, 773
- (35) Kenyon, S.J., Hartmann, L., Hewett, R., Carrasco, L., Cruz-gonzalez, I., Recillas, E., Salas, L., Serrano, A., Strom, K. M., Strom, S. E., & Newton, G. 1994, AJ, 107, 2153
- (36) Kenyon, S.J., Gómez, M., Marzke, R.O., & Hartmann, L. 1994, AJ, 108, 251
- Kenyon & Hartmann (1995) Kenyon, S.J.,& Hartmann, L. 1995, ApJS, 101,117 (KH95)
- Kenyon, Yi & Hartmann (1996) Kenyon, S.J., Yi, I., & Hartmann, L. 1996, ApJ, 462, 439
- Koresko (1998) Koresko, CH. D. 1998, ApJ, 507, L145
- Leinert et al. (1993) Leinert, CH, Zinnecker, H., Weitzel, N., Christou, J., Ridgway, S.T., Jameson, R., Hass, M., & Lenzen, R. 1993, A&A, 278, 129
- Lynden-Bell & Pringle (1974) Lynden-Bell, D., & Pringle, J. E. 1974, MNRAS, 168, 603
- Malbet & Bertout (1991) Malbet,F., & Bertout, C. 1991, ApJ, 383, 814
- Mathis, Rumpl & Nordsieck (1977) Mathis, J.S., Rumpl, W., & Nordsieck, K.H., 1977, ApJ, 217, 425
- Meyer, Calvet & Hllenbrand (1997) Meyer, M. R., Calvet, N., & Hillenbrand, L. A. 1997 AJ, 114, 288
- Mihalas (1978) Mihalas, D. 1978, Stellar Atmospheres (San Francisco:Freeman)
- Miyake & Nakagwa (1995) Miyake, K., & Nakagwa, Y. 1995, ApJ, 441, 361
- Nakano & Umebayashi (1986) Nakano, T., & Umebayashi, T., 1986, MNRAS, 218, 663
- Natta (1993) Natta, A., 1993, ApJ, 412, 761
- Osterloh & Beckwith (1995) Osterloh, M., & Beckwith, S.V.W. 1995, A&A, 295, 31
- Pringle (1981) Pringle, J.E. 1981, ARA&A, 19,137
- Rucinski (1985) Rucinski, S.M. 1985, AJ, 90, 2321
- Rydgren & Vrba (1987) Rydgren, A.E., & Vrba, F.J. 1987, PASP, 99, 482
- Shakura & Sunyaev (1973) Shakura, N. I., & Sunyaev, R. A. 1973, A&A, 24,337
- Simon et al. (1992) Simon, M., Chen, W.P., Howell, R.R., Benson, J.A., & Slowik, D. 1992, ApJ, 384, 212
- Simon et al. (1995) Simon, M., Ghez, A.M., Leinert, CH., Cassar, L., Chen, W.P., Howell, R.R., Jameson, R.F., Matthews, K., Neugebauer, G., & Richichi, A. 1995, ApJ, 443, 625
- Stapelfeldt et al. (1998) Stapelfeldt, K.R., Krist, J.E., Ménard, F., Bouvier, J., Padgett, D.L., & Burrows, C.J. 1998, ApJ, 502, L65
- Stepinski (1992) Stepinski, T. F., 1992, Icarus, 97, 130
- Toomre (1964) Toomre, A. 1964, ApJ, 139, 1217
- Valenti, Basri & Johns (1993) Valenti, J. A., Basri, G., & Johns, C. M. 1993, AJ, 106, 2024
- (60) Weidenschilling, S.J. & Cuzzi, J.N. 1993, in Protostars and Planets III, eds. E.H. Levy & J.I. Lunine (Tucson: University of Arizona Press), p. 1031
- Weidenschilling (1997) Weidenschilling, S.J. 1997, Icarus, 127, 290
- Whitney & Hartmann (1992) Whitney, B.A. & Hartmann, L. 1992, ApJ, 395, 529
- Wood et al. (1998) Wood, K., Kenyon, S. J., Whitney, B.A., & Turnbull, M. 1998, ApJ, 497, 494