Cosmic Rays and Non-Thermal Emission in Galaxy Clusters
Abstract
We discuss the origin of thermal and non-thermal phenomena in galaxy clusters. Specifically, we present some expectations for the non-thermal emission (from radio to gamma ray wavelenghts) expected in a model in which secondary electrons are produced via collisions in the intracluster medium. We also discuss the possibility to test this cosmic ray model in the light of recent data on radio halos and hard X-ray excesses found in nearby galaxy clusters.
1 Introduction
Clusters of galaxies emit thermal and non-thermal diffuse radiation in the radio, EUV, X-rays, hard X-rays and possibly gamma rays. In fact, the Coma cluster shows, besides the well known thermal X-ray emission in the keV range, evidence of non-thermal diffuse emission in the radio (see Feretti at this Meeting) , EUV (see Lieu and Bowyer at this Meeting) and hard X-rays (see Fusco-Femiano at this Meeting). In the gamma rays, there is only an upper limit obtained with EGRET (Sreekumar et al. 1996).
Several other clusters also show evidence of non-thermal emission and most of them exhibit an extended radio halo. All of these radio halo clusters have a strong merging occurring in their central regions and do not show strong cooling flows. On the other hand, clusters with strong cooling flows are mostly non-merging systems and do not show evidences for radio halos and/or other non-thermal diffuse emission. The cluster A2199 constitutes an exception: in fact, it has a strong cooling flow in its center and a diffuse hard X-ray and a soft X-ray/EUV excesses over the thermal model (Kaastra et al. 1999).
Most of the non-thermal phenomena occurring in clusters have been interpreted as due to synchrotron and ICS emission from a population of relativistic cosmic ray electrons diffusing in the intra cluster medium (ICM). Cosmic ray models for the origin of non-thermal phenomena in clusters belong basically to two categories: primary electron models (PEM; see, e.g., Jaffe 1977, Rephaeli 1979) in which relativistic electrons are accelerated by discrete sources in the cluster, and possibly reaccelerated by turbulence in the ICM (Jaffe 1977, Roland 1981, Schlickeiser et al. 1987); secondary electron models (SEM; Dennison 1980, Vestrand 1982) in which cosmic ray electrons of galactic origin are produced as secondary products of collisions. The main difficulty of the PEM is the short propagation distance ( kpc) for the electrons. This calls for continuous reacceleration processes in order to explain diffuse non-thermal emission (radio and X-rays) out to Mpc scales, as observed in Coma and A2199. Other potential problems may come from the selective acceleration efficiency required by non-hadronic models in order to avoid the production of a large gamma ray emission coming from both the electron bremsstrahlung and the electromagnetic decay. The original SEM (Dennison 1980) has the potential problem of a too steep injection spectrum (with index ) required to fit the Coma radio halo spectrum compared to the standard CR spectral slopes () (Chi et al. 1996).
In the following, we consider the available radio and X-ray data for clusters with known non-thermal emission to discuss the possible constraints that can be set on the cosmic ray models for the origin of such non-thermal phenomena. Here we mainly discuss the predictions from collisions in the ICM.
2 Theory
We consider here a simple spherical cluster formed as a result of the collapse and virialization from an original top-hat perturbation originated at early times. We assume that its final gas density distribution is given by with , where is the central density, is the cluster core radius and (see Sarazin 1988 for a review). If we assume virial and hydrostatic equilibrium of the gas in the cluster potential wells, then the IC gas temperature is , where is the total cluster mass and is its virial radius. In the simple top-hat model, the cluster temperature and core radii are related by , where the quantity contains, in this model, all the cosmological dependence in terms of the evolution of the cluster density contrast, (here is the internal density of the cluster at the collapse epoch and is the external background density; see, e.g., Colafrancesco, Mazzotta & Vittorio 1998 for details). The cluster X-ray luminosity is mainly provided by thermal bremsstrahlung emission and, in this framework, it reads .
2.1 Non-thermal emission
Cosmic rays (CR) produced within a cluster can yield gamma-rays through the production and the subsequent decay of neutral pions: with In the same interactions, charged pions are also produced, which determine neutrino and emission through , , . These secondary products occur at the same place (e.g., in situ) of collisions.
Various sources of CRs are effective in clusters. Normal galaxies provide at most CR production rates erg/s and active galaxies can yield erg/s. Also ICM shocks, produced by accretion and/or merging in clusters, are effective in accelerating CR and can yield a few erg/s (see CB98 for details). These CR production rates are averaged over a Hubble time.
The CR diffusion and confinement in the IC medium are crucial mechanisms to maximize the efficiency of collisions and are strictly related to the value and configuration of the magnetic field in clusters. For a Kolmogorov spectrum one obtains (CB98):
| (1) |
For the range of energies we are interested in, CRs propagate diffusively according to the transport equation:
| (2) |
where is the density of CRs with energy , is the spectrum of the CR source in the cluster and is the rate of CR energy losses. For average IC gas densities (as in Coma), and CR energy losses are . In the case of a point-like CR source the solution of eq.(2) is
| (3) |
The maximum length over which CR can diffuse in a Hubble time, , is:
| (4) |
and the CR diffusion time at energy and distance is:
| (5) |
Thus, confinement on scales happens for and confinement in the core, is effective for .
In the extreme case of a homogeneous injection of CR in the ICM, the equilibrium CR distribution is given by
| (6) |
where the constant is obtained requiring that and is the total CR energy injected in the cluster volume .
Once CR protons are confined in the ICM, they can produce secondaries through collisions with the thermal protons in the ionized, metal rich ICM. The number of i-secondaries () per unit time and unit volume, at energy is (BBP, CB98). In the diffusion regime, the total number of i-secondaries reads:
| (7) |
where is the rate of collisions, is the cross section, and are the yields for i-secondary production.
The emissivity in gamma rays at distance and energy is given by
| (8) |
where (see BC99 for further details).
The production spectrum of secondary electrons, , can be derived from the known , spectra (see BC99 for details). The equilibrium electron spectrum is obtained from the transport equation:
| (9) |
where is the rate of energy losses at energy . These secondary electrons produce synchrotron radio emission in the magnetized ICM
| (10) |
and X-ray emissivity through Inverse Compton Scattering (ICS) off the microwave background photons
| (11) |
(see Longair 1993 for details). The calculation of the radio emissivity is performed here in the simplified assumption that electrons with energy radiate at a fixed frequency given by:
| (12) |
For ICS also we adopt the approximation that electrons radiate at a single energy, given by
| (13) |
These approximations introduce negligible errors in the final result and have the advantage of making it of immediate physical interpretation.
3 Observational constraints
The most natural prediction of the SEM is a substantial diffuse emission of gamma rays extending at least up to GeV (see Fig.1). On the other hand, the PEM predicts a substantially lower gamma-ray flux from clusters due to relativistic bremsstrahlung from high energy electrons and moreover with a steeper spectrum which is strongly suppressed at energies GeV.
A definite prediction of the SEM is the existence of a correlation between the gamma ray flux, , and the thermal X-ray flux, , of clusters
| (14) |
(see CB98 for details) which arises because of the dependence of the rate of collisions from the density of the gas (see eq.7). The gamma ray flux predicted for Coma from eq.(14), , and those of many nearby clusters which are also in the range are unobservable with the present gamma ray telescopes. The cluster gamma ray spectrum of Coma predicted in the SEM shows also a peculiar feature (bump) at MeV which is directly correlated to the decay (the mass is MeV).

The next generation gamma ray telescope (GLAST, VERITAS) have enough sensitivity and spatial resolution to disentengle between the role of the SEM and of the PEM in galaxy clusters. These facilities will be however available in the next decade. Meanwhile, the available data in the radio and hard X-ray energy ranges can be used to put constraints on the cosmic ray models for the origin of non-thermal processes in clusters.
3.1 Constraints from the Coma cluster
The SEM is able to reproduce the integrated spectrum of the Coma radio halo up to GHz for different values of the field (see Fig.2), contrary to the claims by Chi et al. (1996). The high- data could be also reproduced using a more detailed diffusion picture for CR in the ICM.

The observed Hard X-Ray Excess (HXE) in Coma (Fusco-Femiano et al. 1999) can be reproduced in the SEM only with low values of (see BC99). The Coma HXE, if confirmed, puts a strong constraint to the SEM. In fact, if the Coma HXE is mostly produced by ICS, the SEM should be ruled out because the gamma ray flux predicted for Coma in the case (the case which fits both the Coma radio halo spectrum and its HXE) exceeds the EGRET upper limit by a factor (see Table 1).
| 0.13 | ||||
| 0.10 | ||||
| 0.14 | ||||
| 0.11 | ||||
| 0.12 | ||||
| 0.095 |
However, if the magnetic field in Coma decreases with the distance - as indicated by recent simulations (see Friaca & Goncalves 1999) - from a few G at Mpc, as probed by the radio halo, to G at Mpc, as probed by the SAX observation, then the SEM could be consistent with radio, HXE and gamma ray data on Coma. Nonetheless, the HXE observed by SAX can be interpreted more simply by bremsstrahlung emission of a population of high energy electrons which are stochastically accelerated in the ICM and populate the supra-thermal tail of a Maxwellian distribution (see Dolgiev 1999, Ensslin 1999 in these Proceedings). If the HXE in Coma can be explained in this last way, then the SEM would be entirely consistent with the radio, X-ray and gamma-ray data.
3.2 The case of A2199
A soft excess in EUVE-DS, ROSAT-PSPC, SAX-LECS together with a HXE in the SAX-PDS data have been found recently in A2199 (Kaastra et al. 1999). The HXE in A2199 has been also detected in the SAX-MECS, which allowed to map the increase of the HXE from the inner regions out to arcmin away from the cluster center (see Fig.3). While the HXE in the inner arcmin of A2199 could be due to the steep spectrum, central radio galaxy, the HXE detected in the outer parts of A2199, requires unavoidably an explanation in terms of a diffuse non-thermal emission.
At energies GeV, the maximum distance that protons can diffuse away from the central CR source is:
| (15) |
Protons can reach distances Mpc, at which the HXE is observed, if the average value of the magnetic field is . This low value of allows the diffusion of CR protons in the cluster out to large distances without affecting the IC emission induced by secondary electrons.
In the case of a central CR source, the IC emissivity integrated along the line of sight, , and evaluated at the projected distance [here is the angular diameter distance], is
| (16) |
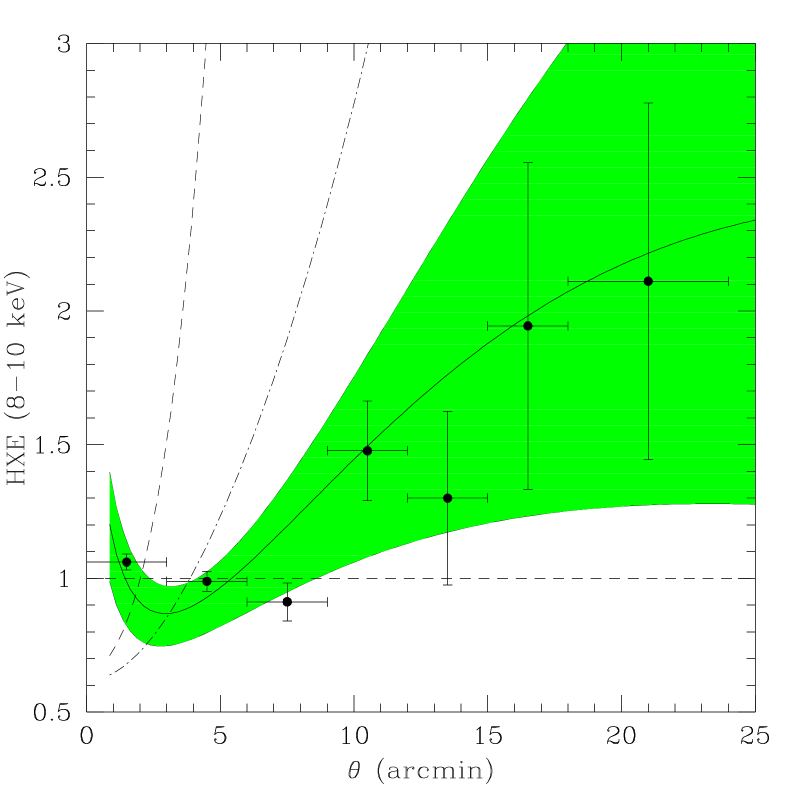
The projected bremsstrahlung emissivity is if const. The ratio HXE , evaluated numerically in the range keV, is shown in Fig.3 for the best fit values arcmin and . Remarkably, the SEM is able to reproduce the observed spatial behaviour of the HXE at both small and large radii. The small radius excess is due to the presence of the central CR source whose effect is described by a peaked distribution of CR protons, (the solution of the proton diffusion equation for ), which reflects in an analogous behaviour of the secondary electron IC emissivity. The large radius excess is mainly provided by the flatter spatial dependence of the IC emissivity, , compared to the much rapid decrease of the thermal bremsstrahlung emissivity, .
In the PEM, the relativistic electrons produced by the central radiogalaxy suffer strong energy losses which prevent them from diffusing out to distances larger than a few dozens kpcs. A possible strong IC emission from the radio galaxy would then explain the small radius excess of A2199 but not the large radius excess. If a reacceleration process is effective in A2199 out to Mpc from its center, then the predicted HXE increases as
| (17) |
If the relativistic electron density, , is uniformly accelerated in the ICM, then the HXE , which increases much faster than the observed HXE. If, however, the relativistic electrons are accelerated at large distance from the center of A2199 and soon reach equipartition with the thermal gas, then the predicted HXE increases as
| (18) |
which is still too steep than the observed HXE (see Fig.3). If the HXE in A2199 is due to bremsstrahlung emission from a population of high energy electrons, the spatial behaviours and Const obtain when the electron spectrum, , is uniformly distributed in the cluster or when equipartition of relativistic electrons and thermal gas is assumed, respectively.
The previous results indicate that ICS of secondary electrons can reproduce naturally the spatial dependence of the HXE observed in A2199. The solution in eq.(3) is able to reproduce both the small radius and the large radius excesses in A2199. The CR power needed to reproduce also the amplitude of the observed HXE in A2199 is of order of a few , a value slightly in excess over the average production rate estimated for active galaxies in clusters (BC98). An important point to notice is that the SEM naturally predicts that the HXE should be accompanied by an extended radio halo due to synchrotron emission of the same electrons in the intracluster magnetic field. The power, , of such radio halo is extremely low due to the strong dependence, . Using , as required to diffuse protons out to Mpc from the cluster center and assuming erg/s, we expect a luminosity, W/Hz for the A2199 radio halo, which gives a vary faint brightness, below the current observational sensitivities. Simple models of primary electron reacceleration have difficulties in reproducing the observed HXE because they predict a too flat profile of IC emission compared to the thermal bremsstrahlung one. These models require a inhomogeneous reacceleration mechanism which has to be more efficient at large distances from the A2199 center and a condition of almost complete equipartition with the thermal gas. Bremsstrahlung emission from a non-thermal or supra-thermal population of electrons could explain the HXE if a stochastic acceleration of the high-energy electrons results to be more efficient at large distance from the cluster center.
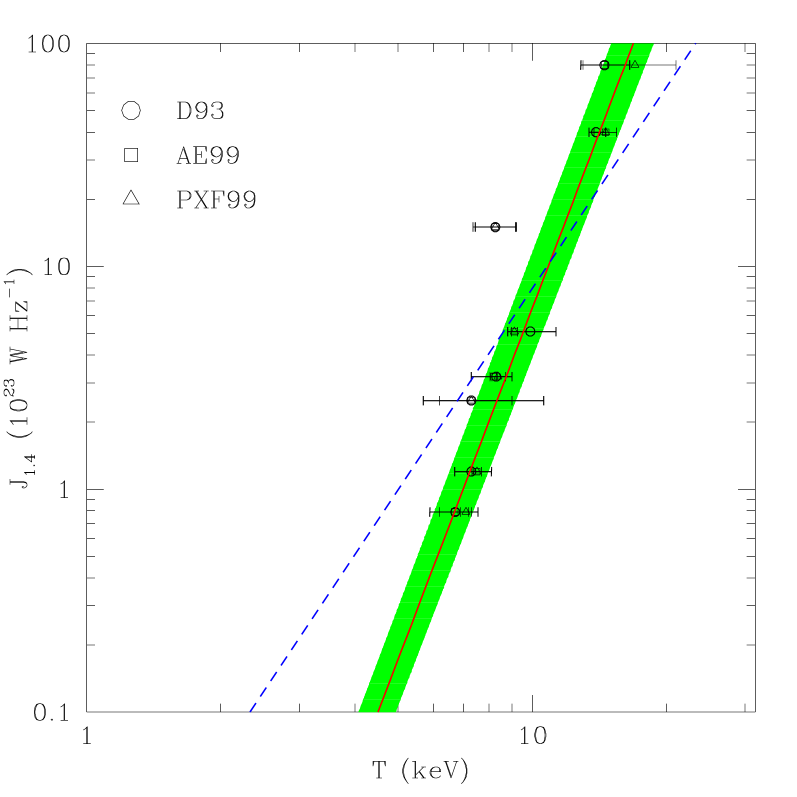
4 The radio luminosity - temperature correlation
The available data on the radio halo clusters (see Giovannini & Feretti 1996, Feretti 1999, Liang 1999, these Proceedings) show a tight correlation between their radio power at GHz, , and their ICM temperature, (see Fig.4). Different temperature data (we consider the D93 temperatures with the associated c.l. uncertainties and for the AE99 and PXF99 data, we quote the sigma uncertainties on ) are quite consistent among them and do not introduce a systematic large scatter in the relation. Fitting these data with a simple power law, , we obtain the following best fit parameters (we give in parentheses the c.l. range): (range ) and (range ) with a , for the AE99 temperature data. The results of the fit do not change very much if we use the D93 data [ (range ) and (range ) with a ] or the PXF99 data [ (range ) and (range ) with a ].
This correlation can be used to put constraints on models for the radio halo origin. In the case of a single CR source acting in the central regions of the cluster, the integrated radio halo spectrum predicted in the SEM is
| (19) |
where is the cluster production rate of CR.
Substituting (as derived from thermal bremsstrahlung emission) in eq.(19) one obtains:
| (20) |
which simplifies to for a spherical, virialized cluster. Using the observed correlation with (we use here the best fit slopes given by AE99 and D93, respectively) one finally finds, in the framework of the SEM, the relation
| (21) |
The predictions of the simple top-hat model in which and do not depend on cannot fit the data. On the other hand, the effects of merging play a relevant role in the halo formation. First, the merging clusters found in the AE99 sample here considered show evidence of a core radius sensibly larger than that of normal clusters. In particular, a relation, with is indicated by the available data and expected on simple theoretical grounds (see Colafrancesco 1999). The merging correction to , by itself, increases sensibly the quality of the fit in the SEM but it does not reproduce the observed correlation.
The data require a strong dependence of and/or . A possibility to recover the SEM is to assume that the ICM shocks occurring in radio halo clusters are pervasive and occupy all the cluster volume with a continuous and efficient set of reacceleration events. In the case of a very extended and continuous CR source, the SEM would predict a relation which is sensibly steeper ( for ) than that for a single CR source. In this framework, moreover, merging can also provide a non-universal CR production rate which increases with increasing cluster temperature (or mass). As a simple example, let us consider that a fraction of the kinetic energy involved in the merging of two subclumps, (with , for simplicity), is transferred to the accelerated particles so that, (we consider here for the sake of illustration the case of a constant acceleration time scale, const, and uncorrelated relative velocities, and ). Adding also this ingredient, consistently with the merging picture, the SEM predicts a relation (for and ) which fits well the observed correlation (see Fig.4). Also the PEM prediction in this case is but is still not sufficient to fit the data. However, assuming also an overall equipartition (both with the thermal gas and with the magnetic field) a steeper relation, , obtains in the PEM (Colafrancesco 1999).
5 Conclusions
The available data on the radio and hard X-ray emission in galaxy clusters provide a test-bed for cosmic ray models for the origin of such non-thermal processes. The SEM yields a viable alternative to explain the overall characteristics of the radio halo spectra and the consistency of the gamma-ray emission with the EGRET limit of Coma, provided that the bulk of the HXE observed in this cluster is due to stochastic acceleration of suprathermal electrons. Moreover, the SEM provides also a viable explanation of the spatial distribution of the HXE observed in A2199. Simple primary electron models have difficulties in reproducing the spatial extent of the HXE in A2199, unless an efficient spatially inhomogeneous acceleration is effective in the ICM of this cluster. Both the SEM and the PEM moreover require a non-universal CR production rate to explain the observed relation.
The extensive search for radio halos and HXE in low and high- clusters, together with the future observations of the gamma-ray emission from nearby clusters which will be available with the future high energy experiments (GLAST, VERITAS, MAGIC, STACEE), will definitely break the model degeneracy here discussed and probe the origin of non-thermal phenomena in galaxy clusters.
References
- [1] Arnaud, M. & Evrard, G. 1999, A&A, in press (AE99)
- [2] Berezinsky,V., Blasi,P. & Ptuskin,V.1997, ApJ, 487, 529 (BBP)
- [3] Blasi, P. & Colafrancesco, S. 1999, APh., in press (BC99)
- [4] Chi, X. et al. 1996, Phys. Rev. Lett., 77, 1436
- [5] Colafrancesco, S. 1999, ApJ, submitted
- [6] Colafrancesco, S. et al. 1998, ApJ, 488, 566
- [7] Colafrancesco, S. & Blasi, P. 1998, APh., 9, 227 (CB98)
- [8] David, L.P. et al. 1993, ApJ, 412, 479 (D93)
- [9] Dennison, B. 1980, ApJ, 239, L93
- [10] Fusco-Femiano, R., et al. 1999, ApJ, in press
- [11] Friaca, F. & Goncalves, G. 1999, preprint astro-ph/9906469
- [12] Giovannini, G. & Feretti, L. 1996, in Extragalactic Radio Sources, R. Ekers et al. eds, p.333
- [13] Jaffe, W.J. 1977, ApJ, 212, 1
- [14] Jaffe, W.J. 1980, ApJ, 241, 924
- [15] Longair, M. 1993, ‘High Energy Astrophysics’
- [16] Kaastra, J. et al. 1999, ApJ, in press
- [17] Ping,X.W. et al. 1999, preprint astro-ph/9905106 (PXF99)
- [18] Rephaeli, Y. 1979, ApJ, 227, 364
- [19] Roland, J. et al. 1981, A&A, 100, 7
- [20] Sarazin, C., 1988, ’X-ray emission from clusters of galaxies’, Cambridge Univ. Press
- [21] Schlikaiser,R. et al. 1987, A&A, 227, 236
- [22] Sreekumar, P. et al. 1996, ApJ, 464, 628
- [23] Vestrand, W.T. 1982, ICRC Proceedings, OG 3.1-5,97