The Galactic Magnetic Field in the Quasar 3C 216
Abstract
Multifrequency polarimetric observations made with the Very Long Baseline Array of the quasar 3C 216 reveal the presence of Faraday rotation measures (RMs) in excess of 2000 rad m-2, in the source rest frame, in the arc of emission located at mas from the core. Rotation measures in the range 300 – 300 rad m-2 are detected in the inner 5 mas ( 30 parsecs). While the rotation measure near the core can be explained as due to a magnetic field in the narrow line region, we favor the interpretation for the high RM in the arc as due to a “local” Faraday screen produced in a shock where the jet is deflected by the interstellar medium of the host galaxy. Our results indicate that a galactic magnetic field of the order of G on a scale 100 pc must be present in the ambient medium.
1 Polarimetric Parsec-Scale Observations of High RM Radio Sources
While typical extragalactic radio sources have Faraday rotation measures (RMs) of order 10 rad m-2 at arcsecond resolution, there exists 30 sources with RMs in excess of 1000 rad m-2 (see Taylor, Barton & Ge 1995; Carilli et al. 1997; Athreya et al. 1998). Approximately 40% of such sources are unresolved at arcsecond resolution. The parsec-scale study of the RM distribution in these radio sources exhibiting an excess of RM is important in order to understand the scale at which such high RMs originate, and to explain the origin of the phenomenon itself. High rotation measures could originate either within the source itself, given a sufficiently dense thermal component, or they could be due to an external Faraday screen of thermal gas and magnetic field.
A large fraction of radio sources with high RM on the arcsecond scale, i.e. 40% of the total, are compact steep spectrum radio sources (CSSs), while the rest are extended radio galaxies. For a few extended radio galaxies, such as Cygnus A and Hydra A, both located at the center of clusters of galaxies, it has been proposed that a highly magnetized intracluster gas is responsible for the high RM detected (see respectively Dreher, Carilli & Perley 1987 and Taylor & Perley 1993).
Recent polarimetric observations of a few high RM radio sources carried out at parsec-scale resolution with the Very Long Baseline Array (VLBA) revealed that the RM distribution differs considerably from source to source. In the CSS quasar OQ172 (Udomprasert et al. 1997) the high RM observed on the arcsecond scale originates within the central parsecs, where values around 40000 rad m-2 are observed. It is therefore likely that the nuclear environment (i.e. the Narrow Line Region, or NLR) is responsible for the high RM observed. Taylor (1998) studied 4 quasars with normal to low RMs on the arcsecond scale, and for three of them found RMs in excess of 1000 rad m-2 within a few mas of the core, while the RM drops abruptly by over an order of magnitude farther along the parsec-scale jet. Again, it is likely that the nuclear environment is responsible for the RM distribution observed. Similar results were obtained also for 3C 138 (Cotton et al. 1997). Finally Aaron et al. (1998) studied the RM distribution in the CSS quasar 3C 309.1, and found small RMs and little depolarization, and concluded that the NLR environment in this quasar is “normal” and uniform.
The quasar 3C 216 was found to have high RMs in the single dish surveys of Tabara & Inoue (1980) and in VLA observations made by Taylor, Ge & O’Dea (1995). In this paper we present and discuss the parsec-scale RM distribution based on multifrequency polarimetric VLBA observations carried out at 3.6 cm and 6 cm.
3C 216 is associated with an optically polarized quasar located at z=0.668. This object is peculiar, since it exhibits properties typical both of blazars and of CSS sources. Detailed observations carried out at parsec-scale resolution (Barthel et al. 1988, Venturi et al. 1993) revealed superluminal motion in the inner part of the VLBI jet, which argues in favor of a small orientation of the VLBI structure to the line of sight. The parsec- and kiloparsec-scale radio emission are misaligned by . High frequency VLA polarimetric observations (Taylor, Ge & O’Dea 1995) showed that the source is strongly polarized, and that the high RM originates mainly in the arcsecond core and in the northeastern component. In particular their results indicate that the polarized flux in the nuclear components peaks at 150 mas southeast of the core.
A Hubble constant H0 = 65 km sec-1 Mpc-1 and q0 = 0.5 will be used throughout this paper. With this choice of the cosmological parameters, at the distance of 3C 216 1 mas corresponds to 6.1 parsec.
2 Observations and Data Reduction
The observations, performed on 1996 Nov. 3, were carried out at four frequencies in the 3.6 and 6 cm bands (see Table 1) using the 10 element VLBA of the NRAO111The National Radio Astronomy Observatory is a facility of the National Science Foundation operated under a cooperative agreement by Associated Universities, Inc.. Both right and left circular polarizations were recorded using 1 bit sampling for 4 widely spaced IFs of 8 MHz bandwidth each. The VLBA correlator produced 16 frequency channels/IF in every 2 second integration.
Amplitude calibration for each antenna was derived from measurements of the antenna gain and system temperatures. The polarization calibration was performed following a procedure suggested by Cotton (1993). Global fringe fitting was performed using the AIPS task FRING, an implementation of the Schwab & Cotton (1983) algorithm. The fringe fitting was performed using a solution interval of 4 minutes, and a point source model was assumed. Next, a short segment of the cross hand data from the strongly polarized calibrator 3C 345 was fringe fitted in order to determine the right-left delay difference, and the correction obtained was applied to the rest of the data. Once delay and rate solutions were applied, the first and last channel were omitted, and the data were averaged in frequency over the remaining 7 MHz. The data from all sources were edited and averaged over 30 second intervals using Difmap (Shepherd, Pearson & Taylor 1994; Shepherd 1997) and then were subsequently self-calibrated within AIPS.
Finally, the strong, compact calibrator 0552+398 was used to determine the feed polarizations of the antennas. We assumed that the VLBA antennas had good quality feeds with relatively pure polarizations, which allowed us to use a linearized model to fit the feed polarizations. Once these were determined, the solutions were applied to snapshot observations of 3C 286 and 3C 345. 3C 286 has been observed to have a polarization angle of 30∘ (Cotton et al. 1997), so a single R-L phase difference was applied to all 3.6 and 6 cm frequencies to correct the polarization angles to this value. As a check on the absolute polarization angle calibration, 3C 345 was also imaged. Components along the jet of 3C 345 lie parallel to the jet axis at 6 cm (Cawthorne et al. 1993, Taylor 1998). Assuming that this remains the case over time, we found that the jet component was within 5∘ of the expected value at 6 cm. Of prime importance to this experiment are the relative angles between frequencies, and these were preserved by applying a constant correction to all frequencies within each band.
3 Results
3.1 Total intensity images and parsec-scale morphology
Our total intensity VLBA images were obtained using all four frequencies in both the 3.6 and 6 cm bands. This provided a very good coverage and allowed high sensitivity imaging. Natural weighted total intensity images at 6 cm and 3.6 cm are shown in Fig. 1. Details about the images are given in Table 2.
In both bands the parsec-scale structure of 3C 216 extends 140 mas in p.a. , south-east of the northernmost, most compact component, which we assume to be the core, as our data demonstrate (see below). The images in both bands show that the jet within the first 40 mas from the core is not straight, but wiggles with an amplitude of . The jet has a knotty structure, with two brightness peaks at 7 mas and mas from the core dominating the jet emission. Our image also indicates that the parsec-scale jet is not continuous. It remains collimated and readily visible, though diffuse, out to 40 mas from the core, then the surface brightness drops, the jet becomes invisible, then “reappears” at mas from the core.
At 140 mas from the core the radio jet bends sharply by an apparent angle of , to form the most striking feature of our total intensity images, i.e. the extended emission located at 140 mas from the core, which we will refer to as the “arc”. The total extent of the parsec-scale morphology corresponds to a projected linear distance of 0.85 kpc for our choice of cosmological parameters. The extension of the parsec-scale radio emission in 3C 216 out to mas from the core was first revealed by EVN 50 cm and 18 cm observations (Fejes, Porcas & Akujor 1992), and its detailed morphology was first imaged at 18 cm in a global VLBI experiment (Akujor, Porcas & Fejes 1996). Our images agree even in the details of the earlier 18 cm image. The coverage and resolution of our data do not allow us to image the sub-kiloparsec radio emission beyond the “arc”. From the comparison of our images and those available in the literature, with resolutions ranging from a fraction of an arcsecond (Taylor, Ge & O’Dea 1995), to 30 milliarscecond (Fejes, Porcas & Akujor 1992), to the milliarcsecond resolution of the images presented in this paper, we suggest that the radio emission from the sub-kiloparsec scale jet and arc continues to the south-west and feeds the south-western knot visible on the arcsecond scale (see images in Fejes, Porcas & Akujor 1992 and in Taylor et al. 1995) This suggestion is consistent with the polarization properties of 3C 216 on the arcsecond scale. Taylor et al. found that the bright knot located 1 arcsecond south-west of the core is less depolarized than the north-eastern one, and it is therefore expected to be closer to the observer.
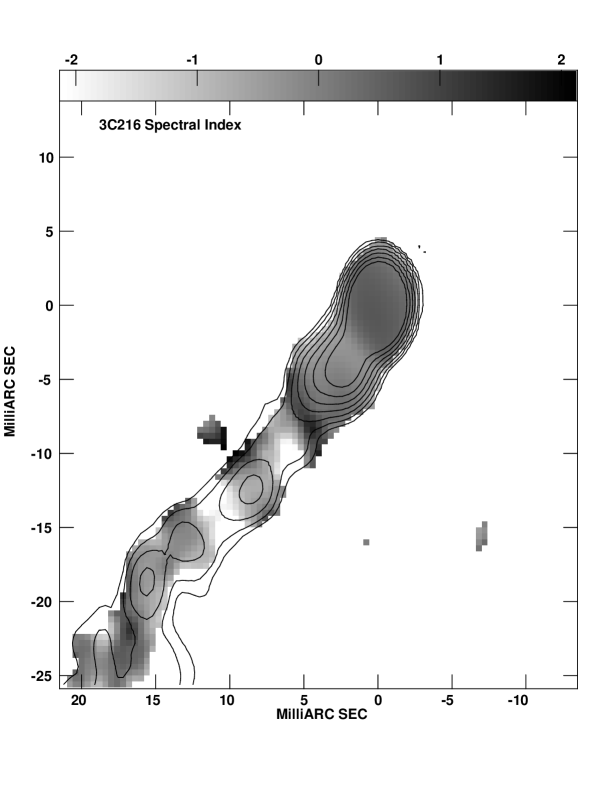
We computed the point-to-point spectral index of the parsec-scale components in 3C 216 between 3.6 cm and 6 cm, (). To this aim we used images made with the same coverage and convolved with the same restoring beam. In Fig. 2 the 6 cm total intensity contours are superposed on the grey scale image of the spectral index in the inner 30 parsec. As is clear from the figure, the northernmost component of the parsec-scale morphology has the most inverted spectrum, with . The spectral index steepens along the inner jet. Peaks in the spectral index distribution, i.e. flattening of the spectrum, coincide with brightness peaks along the jet.
The arc of emission at 140 mas from the core has a considerably steeper spectrum in our two bands. Comparison of the total flux in the arc derived from our images leads to a value of the spectral index . The point-to-point distribution (not shown here) is irregular, and regions of flatter spectrum are located in between the arc brightness peaks. We compared our flux measurements to the 18 cm image published in Akujor, Porcas & Fejes (1996) after tapering our images to match the published 18 cm image, and we derived the spectrum of the arc using the information in these three bands. The result is plotted it in Fig. 3. The spectrum is almost flat between 18 cm and 6 cm, with , then steepens to a value of .
3.2 Polarization Images and Rotation Measure structure
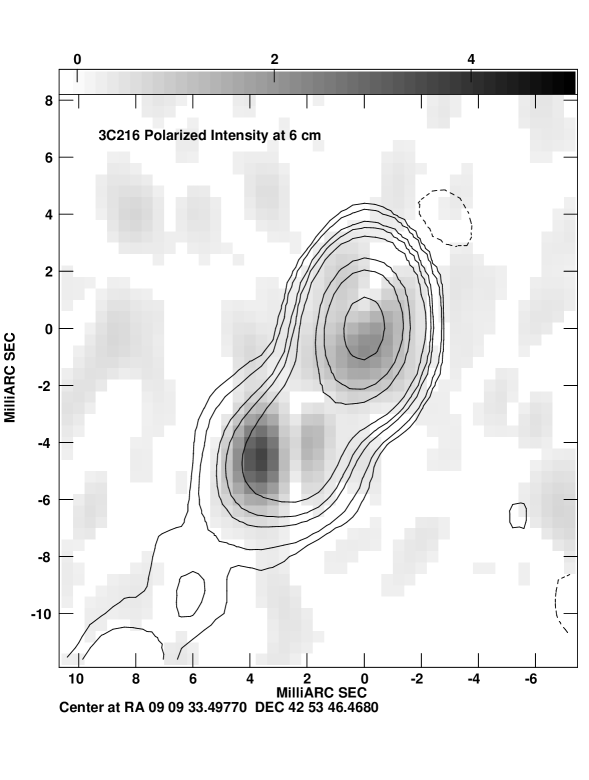
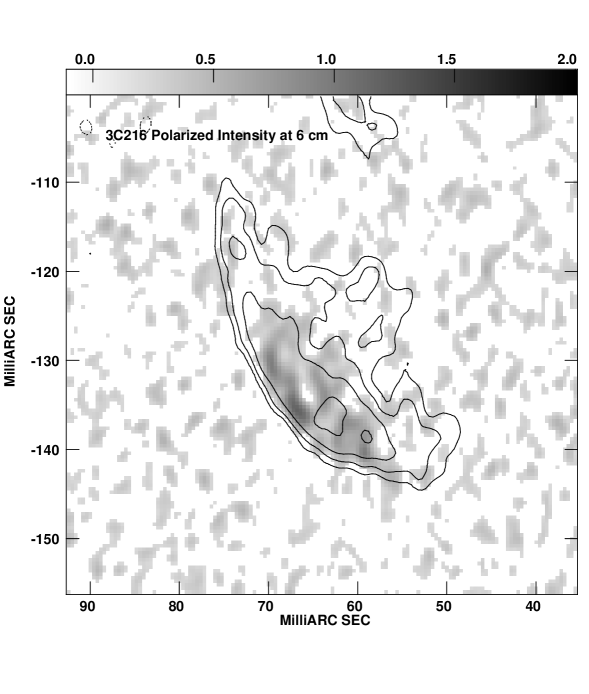
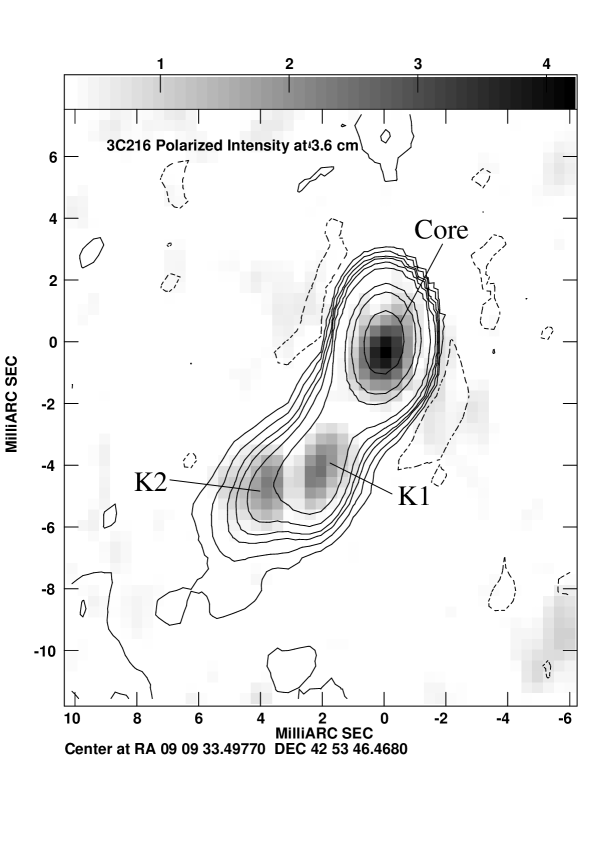
The fractional polarization and polarization percentage values are reported in Table 3 and the image of the polarized flux (grey scale) with superposed total flux density contours are given in Figures 4 and 5 for the 6 cm image (inner jet and arc respectively) and in Fig. 6 for the inner region in the 3.6 cm image. The total intensity and polarized intensity images used to derive the values in Table 3 were made using a single IF at both frequencies at matching resolution. To this aim we made a uniformly weighted image at 6 cm and a naturally weighted and tapered image at 3.6 cm.
As is clear from Table 3 and from the images, the polarized intensity of the parsec-scale radio emission of 3C 216 varies considerably along the structure. The core region is complex. The morphology of the polarized emission is very similar in both bands, and consists of three components, one coincident with the radio core, and the other two, labeled K1 and K2 in Fig. 6, along the inner jet, located respectively at 4 mas and 6 mas from the core. The core is very weakly polarized, while components K1 and K2 are polarized at a level of 6% and 20% in both bands. The core appears to depolarize by a factor of 2 between 3.6 and 6 cm. The arc of emission is strongly polarized, i.e. 30% level, in both bands. Our results indicate that no depolarization is found between 6 cm and 3.6 cm in the inner jet and in the arc of 3C 216.
The orientation of the projected magnetic field (already corrected for the RM) is shown in Figures 7 and 8 for the core and inner jet and for the arc respectively. The magnetic field is parallel to the jet axis near the core and in knot K2, while it is oriented perpendicular to the jet axis in knot K1. The orientation of the magnetic field also shows some structure in the arc (see Fig. 8) and tends to remain parallel to the outer edge. The high polarization percentage in the arc and the orientation of the magnetic field vector, coupled with its morphology, are suggestive of a strong interaction with an external medium.
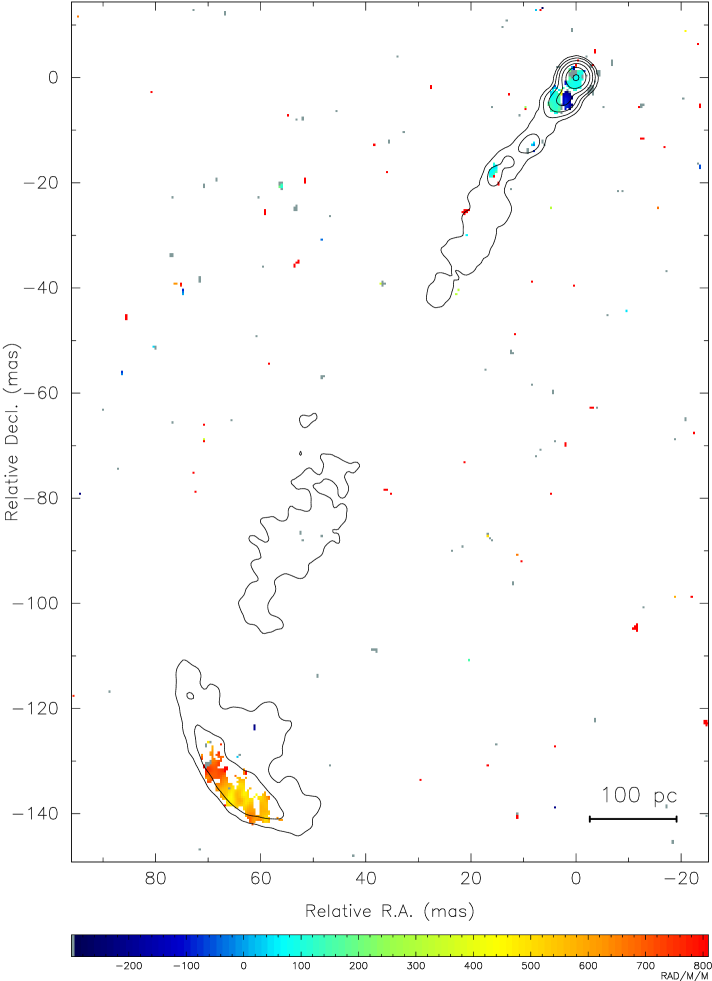
We derived the RM in 3C 216 between 6 cm and 3.6 cm. Our result is shown in Fig. 9, where total intensity contours at 6 cm are superposed on a false color map of the rotation measure. The RM values derived over the whole region imaged are in the range 100 to 800 rad m-2. Since the rotation measure in the rest frame of the source depends on the redshift through the simple relations RMintr = RM, in the case of 3C 216 the intrinsic rotation measure is in the range 280 to 2200 rad m-2.
The observed RM in the inner jet region is low, i.e. from 100 to 100 rad m-2. It flips from rad m-2 to rad m-2 from the core to the polarized knot K1 at 4 mas (see Fig. 6), then changes back to rad m-2 in knot K2. The fits to the polarization angle, derived using all four frequencies in the two bands, are shown in Fig. 10. The change in sign of the RM requires a magnetic field reversal in the inner jet region. The largest observed RM values, ranging from 500 to 800 rad m-2, are found in the arc, in agreement with the RM distribution on the arcsecond scale (Taylor et al. 1995). Fits of the RM to the observed polarization angle versus the square of the wavelength for the arc are given in Fig. 11. In both regions the variation of the position angle is well fit by a law. We note that the galactic contribution to the measured RM is in the range 0 – 10 rad m-2 (Simard-Normandin, Kronberg & Button 1981), and therefore negligible.
4 Discussion
Our study on the parsec-scale polarimetry and rotation measure structure in the compact steep spectrum quasar 3C 216 shows that the arc of emission located at mas from the core exhibits the most extreme properties, with an intrinsic rotation measure in excess of 2000 rad m-2. The rotation measure in the core region, on the other hand, is an order of magnitude smaller and ranges from to 300 rad m-2 with at least two sign reversals. The polarization percentage is also much higher in the arc than in the core region, independent of our two observing bands.
Since no depolarization is found in the jet or in the arc between 3.6 cm and 6 cm, even while the polarization angle changes by more than 100∘ in the arc, the most likely mechanism for the high rotation measure observed in 3C 216 is the presence of an external screen. Internal Faraday rotation is ruled out, as it would imply also considerable depolarization with frequency (Burn 1966), which is not observed. The lack of depolarization also argues against more complex situations, such as for example an external screen with magnetic field tangled on scales less than the beamsize (see Feretti et al. 1995 for a brief review on the subject). The situation in the core itself is less clear, since there is very low fractional polarization, and evidence of depolarization.
If our assumption is correct, then the intrinsic RM is related to the electron density (cm-3), to the component of the magnetic field parallel to the line of sight (G) and to the depth of the screen (kpc) through the formula
rad m-2.
4.1 The core and the inner jet
The screen responsible for the rotation measure distribution in the inner jet region of 3C 216 is most likely the NLR, given that it is all contained within a distance of mas from the core, a projected distance of parsec. From the intrinsic RM obtained in our observations, i.e. rad m-2, and assuming a depth of 10 pc, we derive cmG. With this constraint we can derive an estimate of the component of the magnetic field parallel to the line of sight for the narrow line region of the order of 10G, as suggested by Taylor (1998), only if we assume an electron density of the order of 3 cm-3, a lower limit for the density of the NLR. The sign reversal of the RM in the inner jet region, however, suggests that the magnetic field could be tangled on the assumed 10 pc scale, which implies stronger fields than estimated here.
These properties are different from the results reported in Taylor (1998) for a sample of quasars, where Faraday rotation measures in excess of 1000 rad m-2 are found within the first 10 – 20 parsec from the quasar core, and drop considerably further out. Our results are unexpected, considering that the inner region of 3C 216 shares the same global properties of the sources in Taylor sample, such as for example superluminal motion and low fractional polarization. These similar properties would lead to the conclusion that we are observing the same type of sources, all seen at a small viewing angle.
One explanation for this inconsistency is that the resolution of our 3C 216 images is too low to allow us to separate the core from the jet beginning, and therefore we lack information on the properties of the true core. The depolarization of the core between 3.6 and 6 cm could also be indicative of large RM gradients within the beam. The RM distributions of Taylor (1998) were derived between 8 GHz and 15 GHz, consequently with higher resolution. To test this hypothesis we made high resolution 3.6 cm images of the polarized intensity and rotation measure distribution, to see if there is an indication of an increase in the rotation measure in the northern extreme of the source. A RM of is found, and we suggest that the core may be located at the extreme end of the most compact component in our images. Observations at higher resolution and higher frequency are needed to investigate if the Faraday rotation in the core of 3C 216 follows the behavior which now seems common in quasar cores.
4.2 The arc
The external screen responsible for the high Faraday rotation in the arc must be located quite far from the central engine. As stated in Venturi et al. (1993), the superluminal motion in the inner 6 pc argues in favor of a small angle of the parsec-scale jet to the line of sight, i.e. . The global morphology on the parsec-scale does not indicate misalignments or bending after the first few parsecs, so it seems reasonable to assume that the arc where the jet bends is still seen at the same angle. If our assumptions are correct, then the true distance of the arc from the core of 3C 216 is 2.5 kpc. Such a distance could still be within the NLR, though it would be a somewhat extreme situation (Netzer 1991, Fanti et al. 1995), or it could be within the interstellar medium, possibly inside a shell surrounding the radio emission. Another possibility is that the arc is the result of a shock between the radio emission and the external medium. Under this hypothesis the Faraday screen would be “local”, in a thin sheet of shocked gas around the radio emission. In the following we will consider both frameworks and discuss their implications.
4.2.1 Galactic Faraday screen
Under the assumption that the Faraday screen has a depth of the order of a kiloparsec, for a value rad m-2 we obtain 2.5 cmG. The interstellar gas density at this distance from the nucleus in high redshift objects is not known. Studies carried out at X-ray energies on low redshift galaxies indicate the existence of hot coronae around galaxies, with densities of the order of 10-1 cm-3 and core radii of the order of few kiloparsecs (Forman et al. 1985, White & Sarazin 1988, see also Fanti et al. 1995 for a brief review on this topic). If we assume that the same condition holds also in distant ellipticals and quasars, such density would lead to a magnetic field strength in the interstellar medium (for the component parallel to the line of sight) of 25 G. Assuming that the field is ordered (as the positive rotation measure throughout the arc suggests), but not entirely along the line of sight, then a more accurate estimate for the magnetic field strength is G. A very similar value was found for the magnetic field in the galactic gas surrounding M87 (Owen, Eilek & Keel 1990).
4.2.2 Bow shock Faraday screen
The sub-kiloparsec scale morphology of 3C 216, characterized by a very faint jet which flares into the southern arc and bends westward here, suggests that the arc could be the working surface of a sub-kiloparsec jet in the galactic medium, and that the magnetized screen responsible for the Faraday rotation would be a thin layer of compressed galactic medium. A similar bow shock has been reported on somewhat larger scale for Cygnus A (Carilli, Perley & Dreher 1988). The interaction between the jet and the compressed ambient medium could be responsible for the jet deflection. We note here that with a viewing angle of , as we have assumed throughout the paper, the apparent bend of corresponds to an intrinsic bend of .
Under this hypothesis the smoothness of the RM distribution suggests a plausible depth of 100 pc for such a screen. This leads to an estimate of the product cmG. If the average density out of the shocked region is 0.1 cm-3 (as justified in §4.2.1) and with a compression factor of 4 for a strong adiabatic shock, the electron density just behind the shock is 0.4 cm-3, thus leading to an estimate of G in the shocked region. The galactic magnetic field outside the shock is expected to be 15G. Given the uncertainties in the assumptions made we can say that these two estimates are in agreement.
The external density could be much higher than assumed here, if the jet is deflected by interaction with a dense molecular cloud in the narrow line region. For this reason the value we derive for the galactic magnetic field in 3C 216 under this assumption should be considered an upper limit. However, three-dimensional hydrodynamic simulations of deflected cosmic jets (de Young 1991) show that jet-cloud interactions are not a stable mechanism for jet deflection, even in cases with an optimal geometry and choice of parameters for the deflection. This mechanism considerably reduces the jet speed on a short time scale ( yr), and leads to the cloud eroding on timescales yr. Furthermore, de Young (1991) argues that such interaction would not result in a coherent observable bent jet. This is not in agreement with the radio emission in 3C 216, which indicates that the sub-kiloparsec scale jet is smoothly bending and leading into the arcsecond scale emission in the source, as we have pointed out in §3.1.
Using equipartition arguments, with the standard assumptions (i.e. filling factor = 1, k=1 and integrating between 10 MHz and 100 GHz) and using the spectral index = 1 derived in Section 3.1, we derive an equipartition magnetic field in the arc = 1.3 mG and an internal non thermal pressure dyne cm-2.
5 Conclusions
Detailed polarimetric studies of compact sources on the parsec-scale have demonstrated that there are a variety of mechanisms that can add RMs in excess of 1000 rad m-2. These range from the narrow line region on scales of a few parsecs (e.g. OQ 172 – Udomprasert et al. 1997; and probably in the core of 3C 216 as well); to galactic magnetic fields organized on scales of 100s to 1000s of parsecs (see §4.2); to cluster magnetic fields organized on scales of 10s of kiloparsecs (e.g. 3C 295 – Perley & Taylor 1995). Clearly measuring an integrated RM by itself is not sufficient to determine the nature of the Faraday screen.
Given the parsec-scale morphology of 3C 216 we favor the bow shock model to explain the change in the jet direction and the presence of high Faraday rotation measures. In this picture, magnetic fields of G organized on scales of 100 pc are required.
TABLE 2 Parameters from the Final Total Intensity Images Frequency FWHM rms (1) (2) (3) (4) (5) (6) 4.805 2.651.75, 0∘ 0.07 513.5 86.1 83.5 8.381 2.651.75, 0∘ 0.10 707.6 73.2 32.9 Notes to Table 2 Col.(1).—Observing Frequency. Col.(2).—Restoring beam of the images presented in Figs. 1a and 1b, in mas. Col.(3).—The rms noise level in the final image given in mJy/beam. Col.(4).—Core flux density (mJy). Col.(5).—Flux density of the inner 30 mas of the parsec-scale jet (mJy). Col.(6).—Flux density of the bent component located at 140 mas (mJy).
TABLE 3 Parameters from the Final Polarized Intensity Images Frequency FWHM rms (1) (2) (3) (4) (5) (6) (7) (8) (9) (10) (11) 4.854 2.651.75, 0∘ 0.14 1.5 0.3 1.8 6 2.9 21 14.4 29 8.309 2.651.75, 0∘ 0.18 3.9 0.6 1.7 6 2.2 20 8.6 30 Notes to Table 3 Col.(1).—Observing Frequency. Col.(2).—Restoring beam of the images presented in Figs. 3a, 3b, 4a and 4b, in mas. Col.(3).—The rms noise in the final polarized image given in mJy/beam. Col.(4).—Polarized flux density of the core (mJy). Col.(5).—Fractional polarization in % for the core. Col.(6).—Polarized flux density of knot K1 (mJy). Col.(7).—Fractional polarization in % for knot K1. Col.(8).—Polarized flux density of knot K2 (mJy). Col.(9).—Fractional polarization in % for knot K2. Col.(10).—Polarized flux density of the arc (mJy). Col.(11).—Fractional polarization in % for the arc.
References
- (1) Aaron, S.E., Wardle, J.F.C. & Roberts, D.H., 1998, in IAU Colloq. 164, Radio Emission from Galactic and Extragalactic Compact Sources, ed. A. J. Zensus, G. B. Taylor & J. M. Wrobel, ASP Conf. Ser., 144, 105
- (2) Akujor, C. E., Porcas, R. W. & Fejes, I., 1996, in IAU Symp. 175, Extragalactic Radio Sources, Kluwer, ed. R. Ekers, C. Fanti & L. Padrielli, 83
- (3) Athreya, R.M., Kapahi, V.K., McCarthy, P.J., & van Breugel, W. J. M. 1998, A&A, 329, 809
- (4) Barthel, P.D., Pearson, T.J., Readhead, A.C.S., 1988, ApJ, 329, L51
- (5) Burn, B. F. 1966, MNRAS, 133, 67
- (6) Carilli, C. L., Röttgering, H. J. A., van Ojik, R., Miley, G. K., & van Breugel, W. J. M. 1997, ApJS, 109, 1
- (7) Cawthorne, T. V., Wardle, J. F. C., Roberts, D. H., Gabuzda, D.C., & Brown, L. F. 1993, ApJ, 416, 496
- (8) Cotton, W. D. 1993, AJ, 106, 1241
- (9) Cotton, W. D., Fanti., C., Fanti, R., Dallacasa, D., Foley, A. R., Schilizzi, R. T., & Spencer, R. E. 1997, A&A, 325, 479
- (10) Dreher, J. W., Carilli C. L. & Perley R. A., 1987, ApJ, 316, 625
- (11) de Young, D. S. 1991, ApJ, 371, 69
- (12) Fanti, C., Fanti, R., Dallacasa, D., Schilizzi, R. T., Spencer, R. E. & Stanghellini, C. 1995, A&A, 302, 317
- (13) Fejes I., Porcas R.W. & Akujor C.E. 1992, A&A 257, 449
- (14) Feretti, L., Dallacasa, D., Giovannini, G. & Tagliani, A. 1995, A&A 302, 680
- (15) Forman, W., Jones, C. & Tucker, W. 1985, ApJ, 293, 102
- (16) Netzer, H. 1991, in Active Galactic Nuclei, Eds. T. J.-L. Courvasier & M. Mayor, Springer-Verlag, 57
- (17) Owen, F. N., Eilek, J. A. & Keel, W. C. 1990, ApJ, 362, 449
- (18) Perley, R. A., & Taylor, G. B. 1991, AJ, 101, 1623
- (19) Schwab, F. R., & Cotton, W. D. 1983, AJ, 88, 688
- (20) Shepherd, M. C., Pearson, T. J., & Taylor, G. B. 1994, BAAS, 26, 987
- (21) Shepherd, M. C. 1997, Astronomical Data Analysis Software and Systems VI, eds. G. Hunt & H. E. Payne (San Francisco: ASP), 77
- (22) Simard-Normandin, M., Kronberg, P. P. & Button, S. 1981, ApJS, 45, 97
- (23) Tabara, H. & Inoue M., 1980, A&ASS, 39, 379
- (24) Taylor, G. B. & Perley R. A. 1993, ApJ, 416, 554
- (25) Taylor, G. B., Barton, E. J. & Ge, J. 1994, AJ 107, 1942
- (26) Taylor, G. B. 1998, ApJ, 506, 637
- (27) Taylor G. B., Ge, J. & O’Dea, C. P. 1995, AJ, 110, 522
- (28) Udomprasert, P. S., Taylor, G. B., Pearson, T. J. & Roberts, D. H. 1997, ApJ, 483, L9
- (29) Venturi, T., Pearson, T. J., Barthel, P. D. & Herbig, T. 1993, A&A, 271, 65
- (30) White, R. E. III. & Sarazin C. L. 1988, ApJ, 335, 688
- (31)
 ,
,