SEARCH FOR ANTIMATTER IN SPACE WITH THE ALPHA MAGNETIC SPECTROMETER
Abstract
The Alpha Magnetic Spectrometer (AMS) is a state of the art particle physics experiment for the extraterrestrial study of antimatter, matter and missing matter. AMS successfully completed the precursor STS91 Discovery flight (June 2nd-12th, 1998), completing 152 orbits at of latitude and about 400 km of height, collecting more than 100 million CR events. In this paper we report on the first flight experience and we present preliminary results on the search for nuclear antimatter. No antimatter nuclei with were detected. We obtain a model dependent upper limit on of . In the rigidity region between to GV we obtain a model independent, conservative upper limit on of and of for , improving the results of previous searches performed with stratospheric balloons
Invited talk at XIIIth Rencontres de Physique: Results and Perspectives in Particle Physics, La Thuile, Aosta Valley, February 22-27, 1999.
1 Introduction
The disappearance of cosmological antimatter and the pervasive presence of dark matter are two of the greatest puzzles in the current understanding of our universe.
The Big Bang model assumes that, at its very beginning, half of the universe was made out of antimatter. The validity of this model is based on three key experimental observations: the recession of galaxies (Hubble expansion), the highly isotropic cosmic microwave background and the relative abundances of light isotopes. However, a fourth basic observation, the presence of cosmological antimatter somewhere in the universe, is missing. Indeed measurements of the intensity of gamma ray flux in the MeV region exclude the presence of a significant amount of antimatter up to the scale of the local supercluster of galaxies (tens of Megaparsecs). Antimatter should have been destroyed immediately after the Big Bang due to a mechanism creating a matter-antimatter asimmetry through a large violation of CP and the baryon number [1]. Alternatively matter and antimatter were separated into different region of space, at scales larger than superclusters [2]. Other possibilities have also been recently suggested [3]. All efforts to reconcile the the absence of antimatter with cosmological models that do not require new physics failed [4].
We are currently unable to explain the fate of half of the baryonic matter present at the beginning of our universe.
Rotational velocities in spiral galaxies and dynamical effects in galactic clusters provide us convincing evidence that, either Newton laws break down at scales of galaxies or, more likely, most of our universe consists of non-luminous (dark) matter [5]. There are several dark matter candidates (for a recent review see [6]). They are commonly classified as ”hot” and ”cold” dark matter, depending on their relativistic properties at the time of decoupling from normal matter in the early universe. As an example, light neutrinos are obvious candidates for ”hot” dark matter while Weakly Interacting Massive Particles (WIMP’s) like the lightest SUSY particle (LSP) are often considered as plausible ”cold” dark matter candidate [7]. Even the recent results suggesting a positive cosmological constant [8] reducing the amount of matter in the universe, confirm the dominance of dark matter over baryonic matter.
We are then unable to explain the origin of most of the mass of our universe.
To address these two fundamental questions in astroparticle physics a state of the art particle detector, the Alpha Magnetic Spectrometer (AMS) [9] has been approved in 1995 by NASA to operate on the International Space Station (ISS).
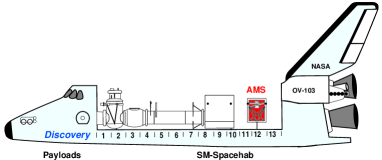
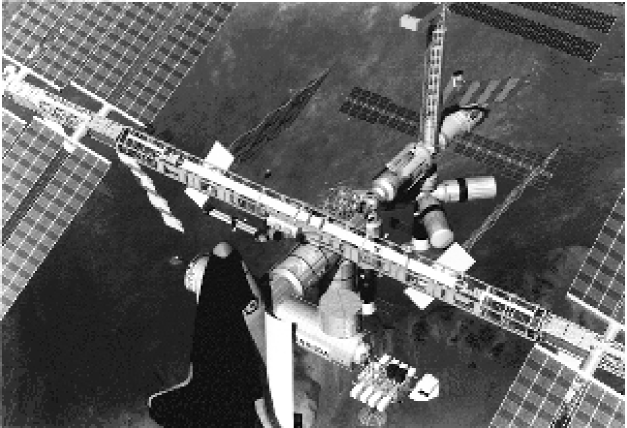
AMS has successfully flown on the precursor flight (STS91, Discovery, June 2nd 1998, Figure 1), and it is approved for a three year long exposure on the International Space Station (ISS), (Figure 2), after its installation during Utilization Flight n.4, now scheduled in 2004. AMS has been proposed and has been built by an international collaboration coordinated by DoE, involving China, Finland, France, Germany, Italy, Portugal, Rumenia, Russia, Spain, Switzerland, Taiwan and US.
In this conference we report on the operation of AMS during the precursor flight and we give preliminary results on the search for nuclear antimatter.
2 AMS design principles and operation during the Shuttle flight
Search of antiparticles requires the capability to identify with the highest degree of confidence, the type of particle traversing the experiment by measuring its mass, the absolute value and the sign of its electric charge. This can be achieved through repeated measurements of the particle momentum (Magnetic Spectrometer), velocity (Time of Flight, Cerenkov detectors) and energy deposition (Ionization detectors).
AMS configuration on the precursor flight is shown in Figure 3. It consists on a large acceptance magnetic spectrometer () based on a permanent Nd-Fe-B Magnet , surrounding a six layer high precision Silicon Tracker and sandwiched between the four planes of the Time of Flight scintillator system ().
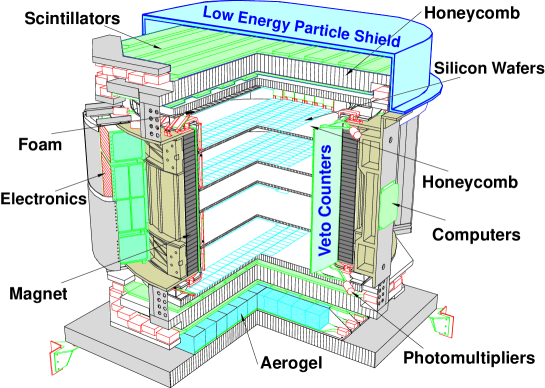
A scintillator Anticounter system, located on the magnet inner wall and a aerogel threshold Cherenkov detector (), complete the experiment. A thin shield on the top and the bottom sides absorb low energy particles present on the Earth radiation belts. The detector works in vacuum: the amount of material in front of the is about and in front of the Tracker.
The magnet is based on recent advancements in permanent magnetic material technology which made it possible to use very high grade Nd-Fe-B to construct a permanent magnet with weighting tons. The magnet has a cylindrical shape with of height and an internal diameter of . A charged particle traversing the spectrometer experiences a dipole field orthogonal to the cylinder axis: it triggers the experiment through the system (planes to ) which also measures the particle velocity () with a typical resolution of over a distance of .
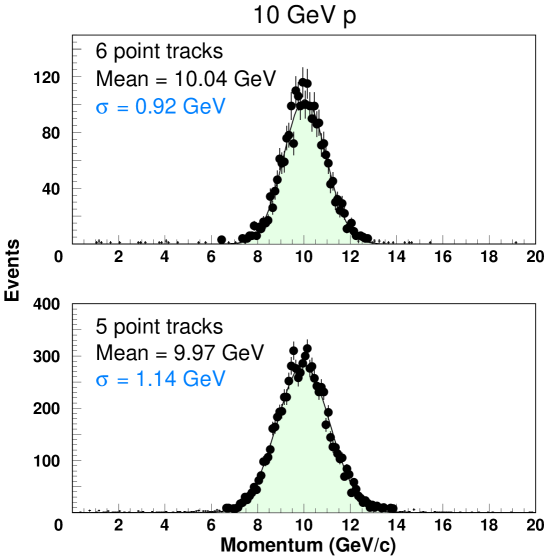
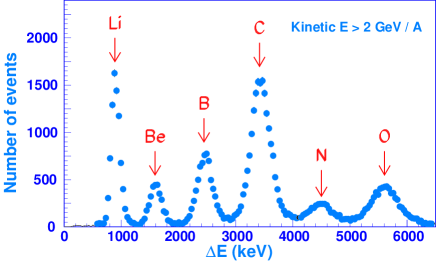
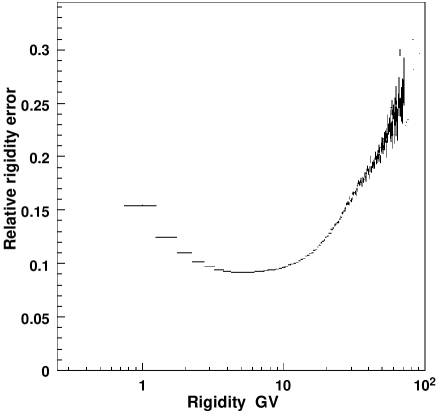
The curvature of the tracks is measured by up to six layers of silicon double sided detectors, supported on ultralight honeycomb planes: the total material traversed by a particle is very small, of over the tracking volume and for normal incidence. The momentum resolution of the Silicon Spectrometer [10] is about in the region between and of rigidity: at lower rigidities its resolution worsen due to the multiple scattering while, at high energy, the maximum detectable rigidity () is about . The Tracker rigidity resolution function was measured at the GSI ion accelerator facility in Darmstadt in october 1998, using and beams, and at CERN in november of the same year, using a proton beam. The results confirm the design value; an example of the measured resolution is shown in Figure 4. The parameters of the Silicon Spectrometer are given in Table 1: about of the Tracker sensitive area was equipped during the precursor flight, with a corresponding reduction on the spectrometer acceptance.
Both the scintillators and the Silicon Tracker layers measure , allowing a multiple determination of the absolute value of the particle charge, Z. Figure 5 show the measurement of the energy deposited by different light nuclei during the precursor flight.
| Number of planes | 8 |
|---|---|
| (6) | |
| Accuracy (bending plane) | |
| Accuracy (non bending plane) | |
| Number of channels | 163936 |
| (58368) | |
| Power consumption | |
| () | |
| Weight | |
| Silicon Area (double sided) | |
| () |
All detector elements during production have undergone thermo-vacuum tests which have demonstrated that neither the deep vacuum nor important temperature variations deteriorate detector performances. Systematic vibration tests qualified that the mechanical design and workmanship were suited to stand the mechanical stresses during launch and landing.
During the STS91 mission the Spectrometer collected data at trigger rates varying from at the equator to at , where the event rate was limited by the data acquisition speed.
After preprocessing and compression, the data were stored on hard disks located on the Shuttle. A total of about 100 million triggers have been recorded during the ten days mission. A considerable part of the time, however, the Shuttle was docked to the MIR station: in this condition the orientation was no good for the AMS since it was sometimes pointing towards Earth. Besides, some element of the station were in the AMS view, thus producing additional unwanted background. The useful time when only deep space was seen by the experiment was about 4 days. Samples of the data ( of the total) were are also sent to ground in real time using S-band receiving ground stations at an average rate of Mbit/s. Although only rough calibrations were applied to these data, the reconstructed events were used online to monitor AMS operating conditions during the mission.
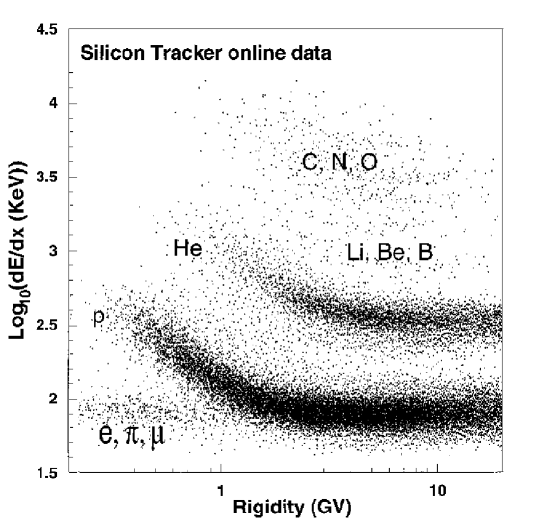
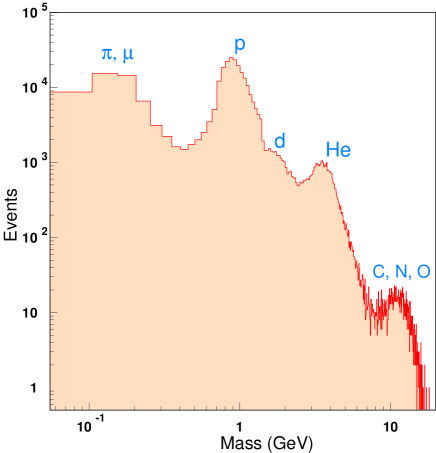
For example, Figure 6 shows the Tracker response to different types of CR during the MIR docking period: the double logarthmic plot versus clearly shows bands corresponding to light particles (), , and heavier ions. Figure 7 show the CR mass spectrum obtained from measured by the Tracker and measured by the ToF.
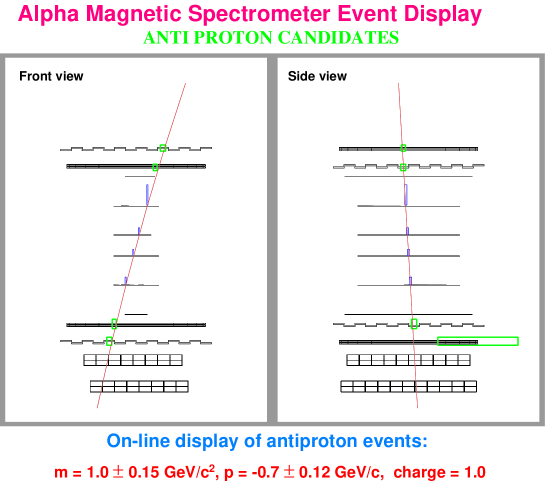
A candidate event, measured online, is also shown in Figure 8: one can note that the occupancy of the Silicon Tracker is very low, allowing unambiguous reconstruction of the particle trajectory in the magnetic field, meaning the sign of its charge and its momentum.
After landing, the full set of hard disks containing the data has been duplicated and the copy has been transported to CERN. During the month of august we determined the in flight calibration constants for the various detectors. The first mass production took place in the fall of 1999 using a cluster of Alpha stations located at CERN.
3 Antimatter Search
To search for nuclear antimatter, we search for particles with
-
•
negative rigidity;
-
•
module of the charge equal or greater than 2;
-
•
mass equal of greater than the He mass.
These quantities are obtained through repeated measurements of the velocity and its direction ( counters), the signed momentum by the Silicon Spectrometer, the absolute value of the charge from measurements of up to four layers and up to 6 Silicon Tracker layers.
We start with a preselection of particles and apply soft quality cuts to reject background particles with negative momentum ( and antinuclei with candidates). The effects of these cuts is studied on control samples containing M and K events.
-
•
To reject background due to single nuclear scattering in the Tracker we apply cuts on the particle rigidity . is measured by the Silicon Spectrometer, using tracks having 5 or 6 points. Since during the precursor flight the Tracker was only partially equipped, we inclued in this analysis also events containing a track detected only on 4 planes.
The particle rigidity is measured three times: the first two measurements and are obtained by using three consecutive points out of the total number of measured points , in the following way: 6 points patterns , , 5 points patterns , , 4 points patterns , , where the lower indices represent the consecutive planes partecipating to the track fit. The third measurement, , is obtained from a fit of all the points associated with one track. In order to take properly into account the presence of multiple scattering, we used the GEANE fitting procedure [11]. The three determination of the rigidity are compared requiring that they give the same sign of the charge and consistent measurements of the momentum components. In particular, the comparison of the relative rigidity error with the rigidity asymmetry allows the removal of about of the negative momentum particles while keeping of the control sample.
-
•
To reject background due to an interaction of the primary particle in the Tracker material we apply cuts on isolation of the clusters detected on the silicon planes. Events where too much energy is observed within of the track are rejected. This cut reject fifteen times more particle in the sample with negative momentum: the positive momentum control samples are basically unaffected ( of the events pass the cuts).
-
•
To separate between upward going and downward going particles we use the measurement.
-
•
The Identification of the absolute value of the particle charge is based on the repeated measurement of the on the Silicon Tracker and : we measure a contamination between and below the level.
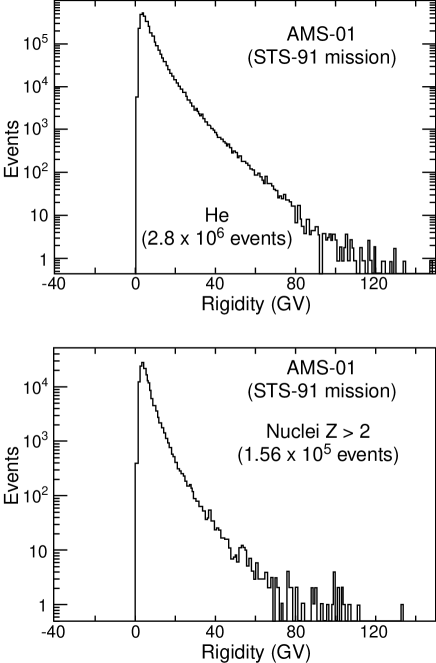
After the preselection we apply additional -cuts on the track and measurements and on an overall likelihood function describing the probability of an event to be compatible with , or heavier nucleus, kinematics, mass and velocity. Some of these cuts are stricter for events hitting only 4 planes. After these cuts all the candidates in the sample were removed while M events on the sample survived, giving a total efficiency of about . Similarly K events with survived the cuts, but none with negative momentum, with a corresponding cuts efficiency of about . The spectra of the positive charge samples after the cuts are shown in Figure 9: the spectra extends above 100 GV of rigidity for both samples.
The corresponding Tracker rigidity resolution is shown in Figure 10.
4 Antimatter Limits
To establish a preliminary antimatter upper limit we proceed as follows. The flux of incident nuclei in a rigidity bin as a function of the measured rigidity , , is related to the measured He flux, , by
| (1) |
where is the rigidity dependent selection efficiency of the cuts discussed in the previous section, simulated through a complete MC simulation using the GEANT [11] package. Trigger efficiency and the rigidity dependence of the anticounter veto as well as the corrections due to electronics dead time which was important on polar regions, was checked with events taken with an unbiased trigger. We also corrected for the difference in absorption cross sections [12].
Since we detected no candidate, the differential upper limit for the flux ratio at is given by:
| (2) |
Since no where found over all the measured rigidity range:
| (3) |
With the model dependent assumption that the rigidity spectrum coincide with the spectrum we obtain:
| (4) |
Similarly with data we obtain
| (5) |
We can also give a conservative upper limit which does not depend on the unknown energy spectrum [19]. We integrate the arguments in equation (2) between and taking the minimum value of the efficiency in this rigidity interval . We calculate
| (6) |
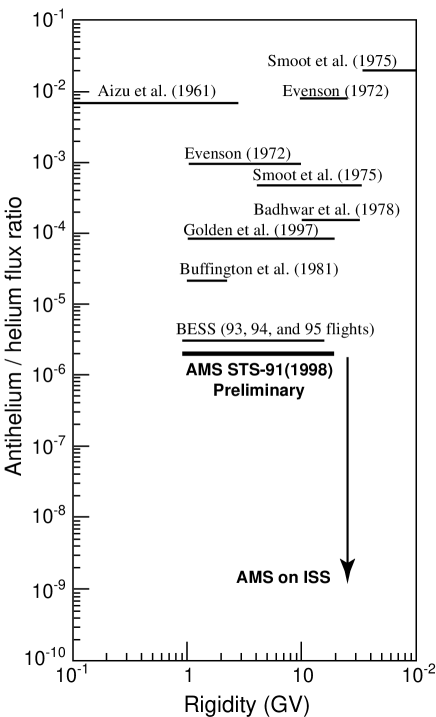
which for and gives a model independent limit on of at of while for the corresponding limit is . Figure 11 shows this preliminary result for compared with previous published results[13]-[19] and the expected AMS sensitivity on the ISS. Our result is better than the best limit published by BESS adding the data of the ’93, ’94, and ’95 flights at of latitude [19]. It also spans over a larger rigidity interval. For our results is about 5 times better than the previous published results[13],[20]. The large AMS acceptance made possible to set these stringent limits using only 4 days of exposition to deep space.
5 Conclusion
The AMS experiment has successfully completed the first precursor flight in June 1998 with an excellent performance of all subsystems, collecting about 100 millions primary CR during 152 orbits around the earth. AMS upper limits on the existence of antimatter improve the results of nearly 40 years of similar searches using stratospheric ballons.
There has never been a sensitive magnetic spectrometer in space covering the energy range up to hundreds of GeV. After its installation on the ISS in 2004, AMS will measure the CR rays composition with an accuracy orders of magnitude better than before. This instrument will open a new sensitivity window in the search for antimatter and for supersymmetric dark matter in the galactic halo.
References
- [1] A.D. Sakharov, JETP Lett 524 1967.
- [2] R.W. Brown and F. Stecker, Phys. Rev. Lett. 43, 315, 1979; K. Sato, PLB 99 66 1981; A.D. Dolgov, TAC-1996-010 and astro-ph/9605280; J.B. Rehm and K. Jedamzik astro-ph/9802255; K. Urbanowski WSP-IF 99-55 and astro-ph/9905279
- [3] K.M. Belotsky et al., MSU-INP 98-31/532 and astro-ph/9807027; K.M. Belotsky et al., astro-ph/9901402.
- [4] G. Steigmann, Ann. Rev. Astron. Astroph. 14 339 1976; E.W. Kolb and M.S. Turner, Ann. Rev. Nucl. Part. Sci. 33 645 1983; P.J.E. Peebles in: Principles of Physical Cosmology, (Princeton University Press, Princeton N.J. 1993).
- [5] F. Zwickly, Hel. Phys. Acta 6 110 1933.
- [6] Proceedings of DM97 P. Salucci Editor (Studio Editoriale Fiorentino, Firenze Italy 1997).
- [7] J. Ellis, J.S. Hagelin, D.V. Nanopulos, K. Olive and M. Srednicki, Nucl. Phys. B 238 453 1984; M.S. Turner and F. Wilzek Phys. Rev. D 42 1001 1990.
- [8] B. Chaboyer et al., Ap. J. 1 494 1998.
- [9] S.P. Ahlen et al., Nucl. Instrum. Methods A350 351 1994.
- [10] R. Battiston Nucl. Instrum. Methods (Proc. Suppl.) B 44 274 1995; M. Pauluzzi, Nucl. Instrum. Methods A383 35 1996.
- [11] See R. Brun et al., ”GEANT 3”, CERN DD/EE/84-1 (Revised), September 1987. The GHEISHA program (H. Fesefeldt, RWTH Aachen Report PITHA 85/02 (1985) is used to simulate hadronic interactions.
- [12] A.A. Moiseev and J.F. Ormes, Astropart. Phys. 6 379 1997.
- [13] G.F. Smoot et al., Phys. Rev. Lett. 35 258 1975.
- [14] G. Steigman et al., Ann. Rev. Astr. Ap. 14 339 1976.
- [15] G. Badhwar et al., Nature 274 137 1978.
- [16] A. Buffington et al., Ap. J. 248 1179 1981.
- [17] R.L. Golden et al., Ap. J. 479 992 1997.
- [18] J.F. Ormes et al., Ap. J. Letters 482 L187 1997.
- [19] T. Saeki et al., Phys. Lett. B422 319 1998.
- [20] N. Lund et al., Å 164 231 1986.