22institutetext: Osservatorio Astronomico di Bologna, via Ranzani 1, I-40127 Bologna, Italy
33institutetext: Max-Planck-Institute für extraterrestrische Physik, Giessenbach Str., D-85748 Garching, Germany
44institutetext: Dept. of Physics and Astronomy, Wilder Laboratory, Dartmouth College, Hanover N.H. 03755, USA
The Steep Spectrum Quasar PG1404226 with ASCA, HST and ROSAT
Abstract
We present and discuss our observations of the Narrow Line quasar PG1404226 ( = 0.098) with ASCA and HST, and a re-analysis of our earlier observations with ROSAT. The soft X-ray spectrum is very steep and displays an absorption feature (edge or line at 1.1 keV). We have applied a variety of models to the ASCA and ROSAT spectra without finding a completely satisfactory fit, and the identification of the edge remains uncertain. A satisfactory fit of the ASCA spectrum assuming that the edge is produced by highly ionized iron (using the code absori in XSPEC) is obtained with an overabundance of iron by a factor compared to solar, a suggestion supported by the extremely high equivalent width of the Fe K line at 6.4 keV. A warm absorber model ( based on Cloudy) fitting the absorption feature with NeVII-NeX edges and assuming a peculiar oxygen/neon abundance ratio is consistent with the ROSAT data but not the ASCA data. Finally, it is also possible that the observed edge is caused by a OVIII or OVII edge or line, blueshifted by = 0.2 to 0.5 depending on the specific identification, as has been suggested previously for 2 other Narrow Line quasars, but there are no other features in the UV and X-ray spectra in support of this suggestion.
Two systems of UV absorption lines, one nearly at rest in the source frame, the other blueshifted by km s-1 are identified in the HST/FOS spectra. Photoionization models indicate that the UV absorption and the keV absorption are probably caused by absorbers with different physical conditions. PG1404226 is one more case of AGN where both UV and X-ray absorption features are detected, thereby increasing further the significance of the previously noted statistical association of the two types of absorbers.
Key Words.:
galaxies: active – galaxies:Seyfert X rays: galaxies – UV: quasars – PG 1404+2261 Introduction
Narrow Line Active Galactic Nuclei form a distinct class of AGN on the basis of the properties of their optical/UV spectrum: full width at half maximum (FWHM) of the hydrogen lines and other lines in the range 500-2000 km s-1, intense high ionization lines, and intense FeII multiplets (Osterbrock & Pogge, osterbrock (1985); Shuder & Osterbrock, shuder (1981)). The weakest of these AGN, the Narrow Line Seyfert 1 (NLS1), and the somewhat brighter AGN with absolute optical luminosity above but close to the lowest limit for quasars of = -23.4 have been extensively studied in the X-ray range (e.g. Laor, Fiore, Elvis et al., 1994; Boller, Brandt & Fink, 1996; Laor et al., 1997). Among all AGN, the Narrow Lines AGN tend to have the steepest soft X-ray spectra (ROSAT), and some of them show fast, large amplitude soft X-ray variability with occasionally giant outbursts (e.g. Grupe 1996 and references therein; Boller et al 1996). In the harder 2-10 keV band a comparative study of a large sample of NLS1 and broad line Seyfert 1s revealed that the 2-10 keV ASCA spectral slopes of NLS1 are significantly steeper than those of broad line AGN (Brandt, Mathur & Elvis 1997).
Recent BeppoSAX observations of a selected sample of bright NLS1 (Comastri, Fiore, Guainazzi et al. 1998; Comastri, Brandt, Leighly et al. 1998) over the broad 0.1-10 keV range indicate that a two component model provides an adequate description of the X–ray continuum. The relative strengths and slopes of the two components are different from those of broad line Seyfert 1s. The NLS1 are characterized by a stronger soft excess and, in general, have a steeper medium energy X-ray power law with respect to normal Seyfert 1s, but in PG 1404+226 the medium energy spectral index is not very different from that of classical Seyfert 1s while its soft excess is strong, very steep and rapidly variable like in other NLS1. The spectral behaviour of NLS1 suggests that the soft X-ray flux cannot be due only to disk reprocessing unless there is highly anisotropic emission. In the framework of the thermal models for the X-ray emission in Seyfert 1s (Haardt & Maraschi 1993) a strong soft component could lead to a strong Compton cooling of the hot corona electrons and to a steep hard tail. This hypothesis is also supported by the similarities between NLS1 spectra and those of Galactic black hole candidates in their high states first suggested by Pounds, Done and Osborne (1995) and Czerny et al. (1996).
The high states of Galactic black hole candidates are thought to be triggered by increases in the accretion rate possibly reaching values close to the Eddington limit. In this case the disk surface is expected to be highly ionized, in good agreement with the observation of a H-like Fe edge in TonS180 (Comastri et al. 1998a). It should also be noted that a high ratio would also be consistent with the narrowness of the optical lines in NLS1 if the optical line producing region is virialized as suggested by Laor et al. (1997)
The quasar PG 1404+226 ( = 0.098, V = 15) is one of the brightest members
of the class of Narrow Line AGN.
The optical spectrum of PG 1404+226 displays the characteristics of NLS1 with
FWHM (H) 830 km s-1
and strong Fe II emission (Boroson & Green 1992).
The observations with the ROSAT PSPC ( 0.1–2.0 keV)
showed a very steep spectrum () with
rapid flux (a factor 2 in 10 hours) and spectral variability typical of
NLS1 in the X-ray range, and revealed a complex absorption feature
around 0.8-1.0 keV (Ulrich & Molendi 1996, thereafter UM96). Time
resolved spectral analysis showed the data to be consistent with
a shift of the absorption feature
to higher energy when the source brightens (UM96).
We have obtained a 40 ks ASCA observation of PG 1404+226 in order to investigate the X-ray spectrum over a larger energy range and at higher energy resolution than was possible with ROSAT. At the time of the ASCA observations the absorption feature was around 1 keV, at an energy definitely higher than that of the OVII and OVIII edges at 0.74 and 0.87 keV commonly seen in ASCA and ROSAT spectra of AGN (e.g. Reynolds 1997). Preliminary results can be found in Comastri, Molendi & Ulrich (1997, hereafter CMU97). The ASCA and ROSAT data have been fit separately since they have not been obtained at the same epoch. The challenge presented by PG 1404+226 is the identification of the absorption at keV. Brandt et al (1994) found a similar feature at 1.15 keV in Ark 564 and considered several interpretations: Neon edge, iron L edges, and outflowing material which would raise the energy edge of OVIII (0.870 keV) to the observed energy. They find none of them to be satisfactory: neon edge because there is only a narrow range of ionization parameter where it would be stronger than the OVIII edge; the iron L edges would produce absorption at other somewhat higher energy (1.358 keV); and the outflow seems unlikely because the source of its kinetic energy is unclear. Otani et al (1996) found a feature at keV in IRAS 13224-3809 for which they suggest an interpretation in terms of outflow, or alternatively and considering that the the X-ray flux of IRAS 13224-3809 varied by a factor 50 in two days “the ionization state of the medium is far from equilibrium due to the violent variability”. Krolik & Kriss (1995) drew attention to the fact that “because the ionization timescales of some ions may be as long as the variability timescales in AGNs, the ionic abundances indicated by the transmission spectra may not be well described by ionization equilibrium”. This point has recently been re-investigated by Nicastro et al. (1999a) who pointed out also that (i) Recombination times can be longer than photoionization times resulting in gaseous absorbers which are over-ionized with respect to the equilibrium ionization state and (ii) Collisional ionization could be of comparable importance to photoionization.
Hayashida (1997) found an edge near 1 keV in H0707-495 for which he also suggests an identification with a blushifted OVIII absorption edge. For PG 1404+226, CMU97 suggested an overabundance of iron, an interpretation which has the advantage to link the origin of the 1 keV absorption to the intense FeII lines present in the optical/UV of this quasar and also of IRAS 13224-3809 and Ark 564. The interpretation where the absorption near keV originates in hot gas outflowing at velocities in the range 0.2 - 0.5c has also been proposed by Leighly et al (1997).
This paper presents an analysis of the ASCA observations, a re-analysis of the ROSAT spectra with our warm absorber (WA) models calculated with CLOUDY (Ferland 1993), and an analysis of HST spectra which we have obtained in order to search for UV absorption/emission lines.
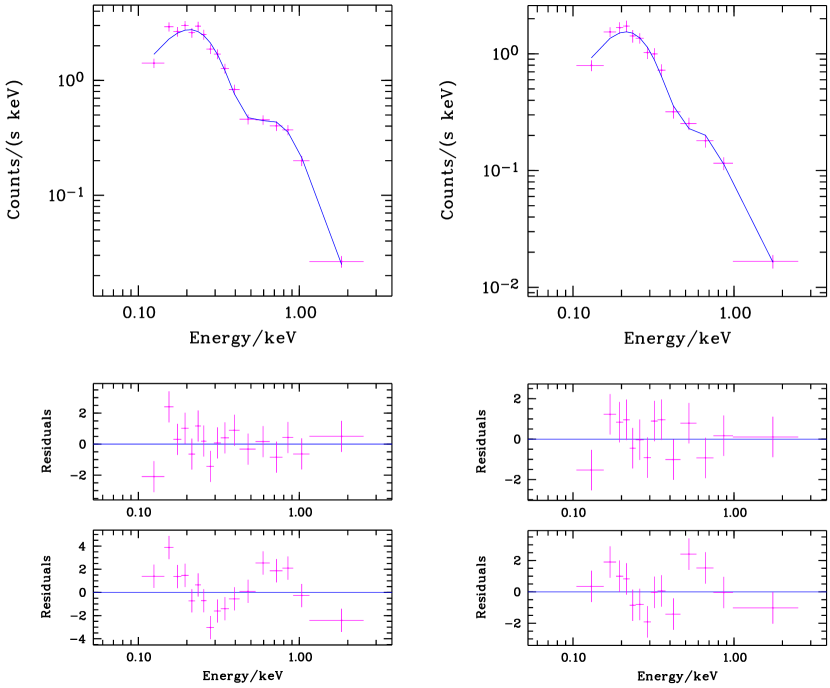
2 Re-analysis of the ROSAT data
The data reduction was carried out in a standard manner and like in UM96 the data were split into “high-state’ and “low-state’ depending on count rate. The analysis was performed with our warm absorber models based on CLOUDY.
| state | log | log | model | |
|---|---|---|---|---|
| HS/LS | 4.1/2.0 | single PL | ||
| HS/LS | 1.0/0.7 | 23.7/23.4 | 2.5/0.9 | standard warm absorber |
| HS/LS | 1.0/0.7 | 23.8/23.5 | 2.2/0.9 | emission+reflection added |
| HS/LS | 0.7/0.3 | 23.3/22.9 | 1.3/0.9 | Ne = 4solar abundance |
| HS/LS | 0.6/0.4 | 23.1/23.1(1) | 1.2/1.0 | additional 0.1 keV soft excess(2) |
(1) fixed to value derived for HS; (2) abundances reset to solar
The warm absorber is assumed to be of constant density, of solar abundances (if not mentioned otherwise), and to be illuminated by the continuum of the central point-like energy source. The spectral energy distribution from the radio to the gamma-ray region consists of piecewise powerlaws with, in particular, an energy index in the EUV, uv,x, of 1.4 and an X-ray photon index x of 1.9. A black-body-like soft excess is added in some models. The column density NWA of the warm material (i.e. the total column density in Hydrogen) and the ionization parameter U are determined from X-ray spectral fits (Table 1). U is a measure of the number rate of ionizing photons above the Lyman limit and is defined by
| (1) |
where is the number rate of incident photons above the Lyman limit, is the distance between central source and absorber, is the speed of light, and is the hydrogen density (fixed to 109.5 cm-3 unless noted otherwise). As detailed below, several models give acceptable fits to the low-state spectrum but none gives a really good fit to the high-state spectrum (which has a higher signal/noise ratio).
2.1 Results with a simple power law
A simple power law plus cold absorption gives a very poor fit. The cold absorbing column generally tends to slightly underpredict the Galactic value. This may reflect some low energy calibration uncertainties, or the presence of an additional spectral component in the form of a very soft excess. Adding a soft excess parameterized as a black body which contributes only at very low energies (e.g. in NGC4051, Komossa & Fink 1997; Ton S180, Fink et al. 1997) improves the fit which, however, remains unsatisfactory.
2.2 Results of the Spectral fits with Warm absorber models
We have examined a family of models (labelled a,b,..e; Table 1) which include a warm absorber plus a power law component with a photon index x fixed at 1.9.
2.2.1 Model a and b: solar abundances
Model a:
The inclusion of a ‘standard’ warm absorber model
clearly improves the fit but does not yield an
acceptable , with systematic residuals
remaining near 1 keV. The reason is that, even for very high
ionization parameters, the model has a strong oxygen absorption
at 0.87 keV, even
stronger than the neon absorptions (NeVII at 1.1 keV and
NeX at 1.36 keV). This is
exacerbated at high-state because
the high-state data require absorption around the location of
the neon edges to dominate. (The same results hold for a steeper
underlying powerlaw.)
Model b: The addition of the emission and reflection components
of the warm material, calculated for a covering
factor of 0.5 results in
a slightly improved fit, but the high-state data are still not
well matched.
2.2.2 Model c: non-solar abundances
One way to make the neon absorption dominate over the oxygen
absorption is to introduce deviations from solar abundances, with
overabundant neon, or underabundant oxygen.
Several deviation factors were studied between an oxygen abundance of
up to O = 0.2 x solar and a neon abundance of Ne = 4 x solar.
These models strongly improve the quality of the fit
and the values of reach acceptable values (for the ROSAT spectra).
The best fit has
an overabundance of neon of times the solar value.
We note that while
non solar abundances have been reported in a number of AGN/quasars
(e.g. Hamann & Ferland 1993, Netzer 1997) the ratio O/Ne is expected to remain
close to its solar value in all known astrophysical situations (On the
other hand, Netzer occasionally depletes oxygen only in his
photoionisation
models, e.g. Marshall et al. 1993).
In any event, the model with overabundance
of neon is not compatible with the ASCA data (Section 3.2.2).
2.2.3 Model d and e: additional soft excess (and solar abundances)
Model d:
Motivated by the ASCA evidence for the presence of a soft
excess, a sequence of models was calculated with an additional hot
BB component of kT = 0.1 keV. This component was included
in the ionizing spectral energy distribution that illuminates
the warm absorber, i.e. the change in
ionization structure of the warm material was self-consistently
calculated.
A successful description of both, high- and low-state data
is possible with solar abundances. Note that two-component models
without edge, specifically, power law + blackbody and
power law + bremstrahlung
were found to provide satisfactory fits of the ROSAT data at low
state. For the high state data the power law + blackbody model gives
= 67/20 (UM96).
Model e: U and NWA have above been treated as free parameters, and the fits tend to give slightly different column densities in low- and high-state data, whereas this quantity is not expected to vary within short time-scales (10 hours or less). We therefore have searched for the best fit model (model e) to the high- and low-state data in which the column density is identical in both states and only the ionization parameter U and the strength of the BB component are allowed to vary between states. We find a successful model with log(NWA) = 23.1, log(Uhigh) = 0.6, log(Ulow) = 0.4, and a contribution of the blackbody to the ionization parameter of log(UBB) = log(UPL) - 0.9 in the high-state data and log(UBB) = log(UPL) -1.5 in the low-state data (Fig. 1; UBB and UPL are the ionization parameters related to the blackbody component, and powerlaw component, respectively. U is a measure of the number rate of ionizing photons above the Lyman limit. See Eqn. (1) for the definition of U).
3 ASCA Observations and Spectral Analysis
3.1 Observations
PG 1404+226 was observed by ASCA (Tanaka, Inoue & Holt 1994) July 13-14, 1994 with the Gas Imaging Spectrometers (GIS2/GIS3) for a total effective exposure time of 35000 s, and with the Solid–state Imaging Spectrometers (SIS0/SIS1) for about 29000 s.
| Model | or (1) | (2) | / (3) | / (4) | /dof |
|---|---|---|---|---|---|
| PL | … | … | … | 438.3/146 | |
| PL+PL | … | … | 291.5/144 | ||
| BR+PL | … | … | 235.7/144 | ||
| BB+PL | 126 4 | … | … | 196.0/144 | |
| BB+PL+EDGE | 158.6/142 | ||||
| CUTBB+PL | 51 | 159.5/142 |
(1) Power law slope or thermal model temperature (in eV) for the
soft component;
(2) Power law photon index for the hard component;
(3) Edge energy / Exponential cutoff energy (in keV);
(4) Edge optical depth / e-folding energy of the exponential
cutoff in eV

The SIS was operating in 1-CCD mode and all the data were collected in Faint mode. Standard criteria for the good selection intervals have been applied (i.e. Cut-off rigidity 7 for GIS and 6 for SIS, minimum elevation angle from the earth 5 degrees and minimum bright earth angle 25 degrees for SIS) as well as DFE and echo corrections. The background subtracted count rates for PG 1404+226 are 0.049,0.038,0.014,0.017 c/s in S0, S1, S2, S3 respectively.
Large flux variations have been detected. In panels a and b of Fig. 2 we show the soft (0.5–2.0) and hard (2.0–10 keV) SIS0 light curves. The SIS0 light curve in the soft band (Fig. 2a ) shows a factor 4 of amplitude variability with a doubling timescale of 8000 s. The variability pattern in the two bands is well correlated suggesting that the hard and soft fluxes varied in the same way.
A detailed spectral resolved temporal analysis
is hampered by the low counting statistics especially at high ( 2 keV)
energies.
In order to have some indications on the spectral variability
we have performed a hardness ratio analysis for the high (first part of the
observation) and the low (second part of the observation)
state shown in Figure 2.
The hardness ratio (Fig. 2c)
has been defined as HR = (H-S)/(H+S) where H and S
are the counts in the 2–10 and 0.5–2 keV bands respectively. The results
for the high and low state are and
suggesting that the spectrum is rather soft
in both states. The 2–10 keV flux is rather
low and as a consequence both the 2-10 keV light curve and the hardness
ratio light curve are noisy with no clear evidence of
spectral variability in contrast
to the spectral change during the ROSAT observations.
The spectral analysis has thus been performed on the spectrum
accumulated over the entire duration of the ASCA observation.
The average luminosity is comparable with the ROSAT low state but the
absorption feature is at high energy as during the ROSAT high state.
3.2 Spectral Analysis
GIS and SIS spectra were binned with more than 20 counts/bin in the 0.7–10 keV and 0.5–10 keV energy ranges respectively. Since the spectral parameters obtained by fitting the four detectors separately were all consistent within the errors, the data were fitted simultaneously to the same model.
Given the very low Galactic column density toward PG 1404+226 ( cm-2; Elvis, Lockman & Wilkes 1989) and the low sensitivity of ASCA detectors for small column densities, all the spectral fits have been performed with . This choice is also corroborated by the ROSAT results (UM96).
A single power law model clearly does not provide an acceptable fit (Table 2) The power law fits reported in Table 2 suggest that at least two components are required to fit the overall spectrum. We note that the slope of the hard power law, which could not have been detected by ROSAT, is consistent with the average quasar slope (Comastri et al. 1992) while the slope below 2 keV is consistent with the UM96 findings.
In order to model the broad band (0.4–10 keV) spectrum we tried 4 types of double component fits (See Table 2 for details): a double power law, bremsstrahlung plus power law, blackbody plus power law, and cut-off blackbody plus power law (the cut-off is of the form exp for energies larger than the cutoff energy keV. The depth of the cut-off is related to , a small value correponding to a very steep decline of the intensity; here keV).
The first two models give unacceptable fits. The only two acceptable descriptions of the data are the cut-off blackbody plus power law (with a cut-off at 0.94 keV) and the blackbody plus power law plus absorption edge model around 1 keV . The addition of the absorption edge to the simple blackbody plus power law model produces an improvement in the fit which is significant at (F-test) and the residuals are featureless in agreement with the results of Leighly et al (1997).
3.2.1 Is iron overabundant?
As absorption edges are the signature of warm absorbing material, we fit the warm absorber model available in XSPEC 9.0 (the model is ‘absori’ and the iron abundance is a free parameter; it was developed by P. Magdziarz & A. Zdziarski following Done et al 1992 and Zdziarski, Ghisellini, George et al. 1990). Given the relatively large numbers of free parameters in this model we have fixed the temperature of the warm material at K (see for example Reynolds & Fabian 1995; the fits are not sensitive to the temperature, a change of logT from 4.5 to 6 would make no significant difference) and the iron abundance at the solar value. In addition we have considered only the 0.5–3.0 keV energy range in order to avoid contamination from the high energy component. We were not able to find any acceptable solution as can be judged from figure 3. Leaving the iron abundance free to vary the improvement is significant at % (F-test) and the residuals featureless (Fig 4). The resulting parameters are: erg cm s-1, cm-2, Iron abundance 25 solar and power law photon slope of . (All the quoted errors are at 90% confidence for one interesting parameter, + 2.7).


The shape of residuals around 6–7 keV are suggestive of iron line emission (Fig 5). With the addition of a narrow line the improvement in the fit is, however, significant only at the 2 level. The derived parameters are keV and EW = eV.
It is interesting to note that the huge equivalent width of the iron line is qualitatively consistent (see figure 3 in Reynolds, Fabian & Inoue, 1995) with the supersolar iron abundance found by fitting the data with the warm absorber model.
3.2.2 Non-solar abundances of Neon or Oxygen?
We have also attempted to fit some warm absorber models (cloudy based, and with blackbody + power law continuum) to the ASCA spectrum and have found no satisfactory fit - the reason being that the edge-like feature at 1 keV is too deep and too narrow for these models.
3.2.3 Resonant Absorption ?
It has been recently shown that the spectra emerging from ionized gas are strongly modified by resonant absorption if the dispersion velocity in the gas is of the order of 100 km s-1 or greater (Nicastro, Fiore, Matt 1999b). The X–ray warm absorber features are also strongly dependent from the shape of the ionizing continuum. For soft X–ray spectra as steep as the one observed for PG 1404+226 several resonance absorption lines from Fe L, Mg, Si and S are predicted between 1 and 2 keV. Such blend of lines would appear as negative residuals in low resolution ASCA spectra. The 1 keV absorption feature of PG 1404+226 could be, at least in part, accounted for by resonant absorption. Signatures of this process have been looked for in the HST UV spectrum (see below).
3.2.4 Is the keV absorption the blueshifted OVIII edge?
Finally, we have also considered the possibility that the absorption at 1.07 keV is the blueshifted OVIII edge whose rest frame energy is 0.87 keV.
We have calculated the optical depth expected for the Neon edges at rest energies 1.1 and 1.36 keV which would be blueshifted to 1.29 and 1.55 keV respectively . For the 1.1 keV line the instrumental upper limit on is 0.14 (90% confidence level) and is 0.27 for the 1.36 keV edge.
We note that with a ‘standard’ warm absorber in relativistic outflow the OVIII edge is never the “only” edge in the spectrum. If the absorber is lowly ionized, there is OVII co-existing and if it is very highly ionized, OVII becomes negligible, but one cannnot avoid having some Neon absorption. Although the exact ratios of the optical depths depend on the input parameters, we thought it would be useful to check whether we could detect any other edge, or check how strict the upper limits are. We take NGC 4051 as basis for comparison. In NGC 4051, the absorber is rather highly ionized, with OVIII being the strongest edge with = , then NeX with =. The OVII edge is weaker with =0.35; Komossa & Fink, 1997. Using the ratio OVIII/NeX as typical for the relative depths in a highly ionized absorber, we can conclude that our non-detection of edges other than the one near 1.1 keV in PG1404+226 is still consistent with a standard warm absorber i.e. our upper limits on are not strict enough to rule out a warm absorber in relativistic outflow.
4 HST and IUE Observations
4.1 Observations
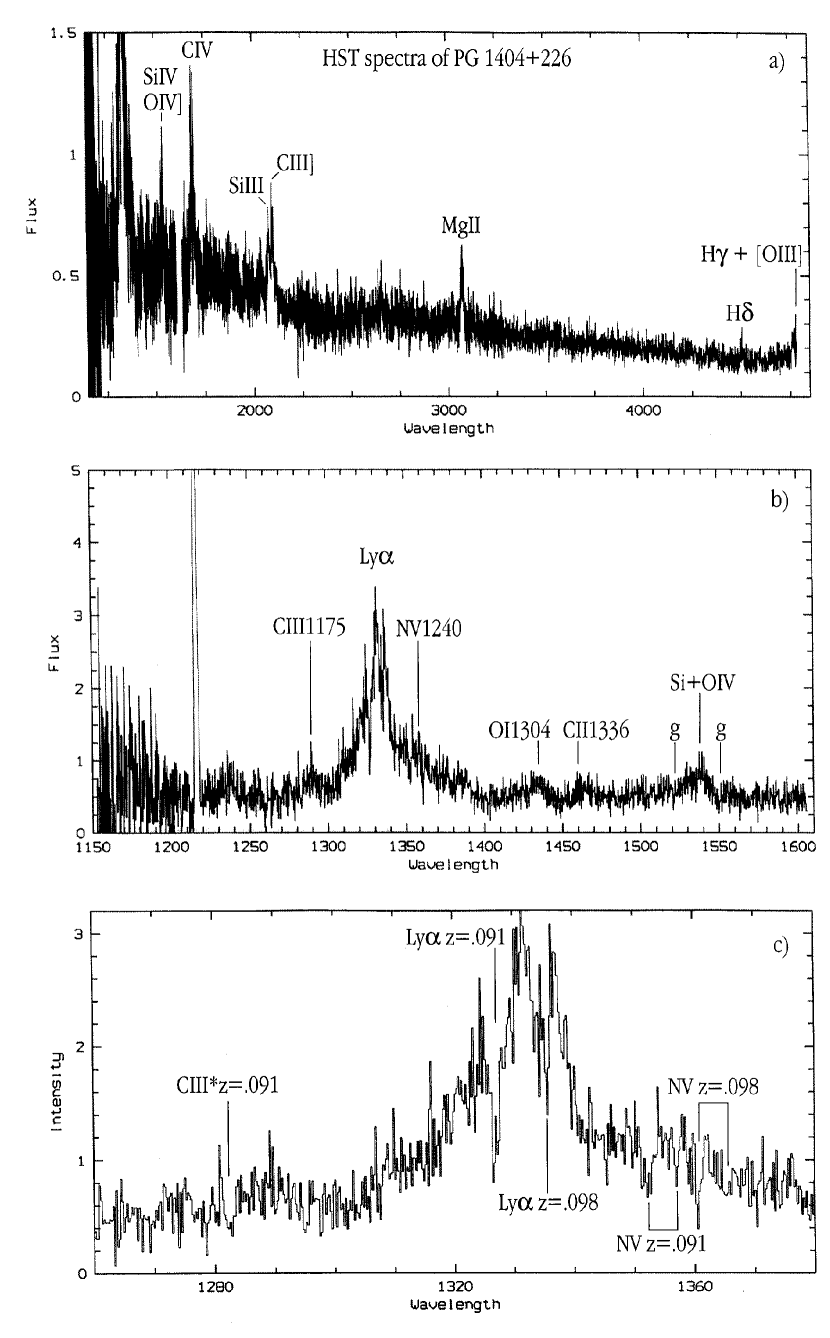
Four spectra were taken in February 1996 with HST/FOS and gratings G130, G190H, G270 and G400 with integration times 2300, 530, 120 and 120 seconds respectively. The total observed wavelength range covered is 1087 - 4773 Å with a nominal resolution of 1300 (Fig.6). The spectra were taken through the 0.86 arcsec diameter aperture. Standard reduction procedures were performed. The wavelength scale of the spectrum taken with G190H was shifted by +1.5 Å, to be consistent with the other spectra.
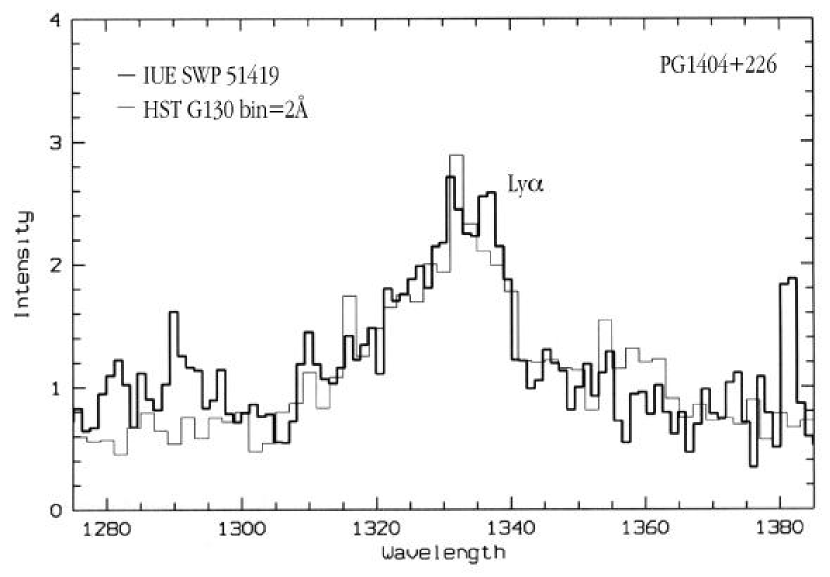
PG 1404+226 was observed with IUE on July 1994, 2 days after the ROSAT observations. The spectrum, SWP 51419, has a total integration time of 315 minutes (accumulated in 12 parts), and was taken through the large aperture and at low dispersion. Compared with the HST spectra taken 18 monthts later the continuum flux in July 1994 is 1.3 times brighter in the common observed wavelength range 1265 to 1400Å but the Ly line kept the same intensity. The modest S/N and spectral resolution of the IUE spectrum would prevent the detection of the absorption lines seen in the HST spectra. No change in the emission/absorption profile of Ly (Fig.7) can be detected by comparing the IUE spectrum and the FOS-G130 spectrum rebinned at 2Å.
4.2 Continuum and emission lines
Table 3 lists the emission line intensities (H0 = 50 km s-1 Mpc-1, q0 = 0, distance = 617 Mpc). We note the presence of some weak emission lines: (1) an unidentified line at 1175Å (rest wavelength 1070Å) noticed in a few other quasar spectra (Laor et al 1995; Hamann et al 1997) (2) a line at 1290 Å which we identifiy with CIII∗1175.7.
| Observed Flux | Intrinsic Flux | ||||
| in 10-14 | in 1041 | ||||
| Identification | ergs s-1 cm-2 | ergs s-1 | |||
| OVI 1033.83 | 1135.15 | t | t | ||
| HeII 1085.15 | 1191.5 | 1 | .2 | 5 | .4 |
| CIII 1175.70 | 1290.0 | 1 | .2 | 5 | .4 |
| Ly 1215.67 | 1334.8 | 54 | 245 | ||
| NV 1240.15 | 1361.7 | – | – | ||
| OI 1304.46 | 1432.25 | 2 | .5 | 11 | .3 |
| CII 1334.53 | 1465.0 | 1 | .2 | 5 | .4 |
| SiIV 1396.76 | 1533.6 | 3 | .5 | 15 | .9 |
| NIV] 1486.50 | 1632.2 | – | – | ||
| CIV 1549.05 | 1700.85 | 11 | .5 | 52 | .2 |
| HeII 1640.50 | 1801.3 | – | – | ||
| SiIII] 1892.03 | 2074.75 | SiIII]+ | CIII] 9.9 | 45 | .0 |
| CIII] 1908.73 | 2093.9 | ||||
| MgII 2795.53 | 3069.0 | 4 | .5 | 20 | .4 |
| MgII 2802.70 | 3078.1 | – | – | ||
| H | 4945.4 | 1 | .0 | 4 | .5 |
| H +[OIII] | – | 1 | .3 | 5 | .9 |
| Footnote: H0 = 50 km s-1 Mpc-1, q0 = 0 | |||||
This line is seen in HST spectra of IZw1 and Laor et al (1997) suggest that it is produced by resonance scattering of continuum photons by CIII∗ ions, a mechanism which requires large velocity gradients ( 1000 km s-1) within each emitting cloud of the BLR.
4.3 The two systems of absorption lines and their likely origin
We identify two absorption systems in the HST spectra which, in the source frame, are separated by km s-1. In the ‘blue’ system the absorption lines appear in the blue flank of the Ly and CIV emission lines at 800 km s-1 from the peak. In the ‘red’ system the absorption lines appear on the red flank of the emission lines at 1100 km s-1 from the peak. It is known that in radio quiet AGN/Quasars, the high ionization lines such as CIV are blueshifted with respect to the systemic velocity by a few hundred to a few thousand km s-1 (e.g. van Groningen 1987, Corbin 1995, Sulentic et al. 1995) this blueshift being generally interpreted as evidence for a wind outflowing from the face of the accretion disk turned towards us. On this basis, we argue that the red absorption system is close to zero velocity in the source frame while the blue system originates from material which has an outflow velocity of km s-1 (towards us with respect to the quasar).
| (Å) | Identification | meas. | EW (Å) |
| meas. | meas. | ||
| Galactic lines: | |||
| 1206.5 | SiIII 1206.50 | 0.6 | |
| 1259.8 | SiII 1260.42 | t (1) | |
| 2795.5 | MgII 2795.53 | 0.8 | |
| 2802.5 | MgII 2802.70 | 0.95 | |
| 2851.7 | MgI 2852.13 | t | |
| Abs. System at z=0.091 | |||
| 1282.5 | CIII*1175.70 | 0.09084 | 0.6 |
| 1327.0 | Ly 1215.57 | 0.091579 | 1.2 (2) |
| 1352.4 | NV 1238.81 | 0.091700 | 0.6 |
| 1356.3 | NV 1242.79 | 0.091330 | 0.2 |
| 1521.2 | SiIV 1393.76 | 0.09144 | 0.3 |
| SiIV 1402.77 | – (1) | ||
| 1688.5 | CIV 1548.19 | 0.090630 | 1.1 (2) |
| 1691.5 | CIV 1550.76 | 0.090750 | 0.8 |
| Abs. System at z=0.098 | |||
| 1334.60 | Ly 1215.57 | 0.097830 | 0.95 (3) |
| 1360.65 | NV 1238.81 | 0.098360 | 0.4 |
| 1365.45 | NV 1242.79 | 0.098690 | 0.25 |
| – | SiIV 1393.76 | – | |
| 1538.5 | SiIV 1402.77 | 0.0967 | t |
| 1699.1 | CIV 1548.19 | 0.097480 | 0.55 |
| – | CIV 1550.76 | – | |
| 2860.0 | FeII2599.4 ? | 0.10 | 0.7 |
Footnotes:
(1) t trace; - not detected
(2) EW of the lines of Ly and CIV are measured after reconstruction of the emission lines top.
(3) Galactic CII1334.5,1335.6 likely contributor to Ly at =0.098
Several factors hamper the measurement of the absorption lines: modest S/N, limited resolution of FOS and uncertainties affecting the profile of the emission lines. The absorption lines were measured assuming a plausible reconstruction of the top of the emission lines. Still it is not possible to obtain sufficiently accurate Ly absorption profile, and NV and CIV doublet ratios to ascertain whether these lines are optically thin or thick and to estimate the covering factor (some of the galactic lines do not reach zero either). Higher spectral resolution is needed to elucidate these important points. With this caveat, the measures are given in Table 4.
4.4 The CIII∗1175 absorption line
Particularly interesting is the absorption line at 1282.5 Å (FWHM of 2Å and EW of 0.7 Å), which could be CIII∗1175 in the = 0.091 system. The agreement in redshift is good. This line is present in the IUE and HUT spectra of NGC 4151 (Bromage et al 1985, Kriss et al 1992). Bromage et al (1985) argue that absorption by the excited metastable level of CIII∗1175 and its strength relative to CIV 1549 require this level to be collisionally populated in a high density medium with Ne = cm-3. In NGC 4151, the EW of CIII∗1175 is between 0.7 and 1.0 times the EW of CIV1548,1550 while in PG1404+226, it is between 0.35 and 0.5 the EW of CIV1548,1550. Note that an appealing alternative for the identification of this line is the CIV doublet blueshifted by 0.3 with respect to PG1404+226. The line width, only 2 Å, however, argues against this interpretation. There is no other candidate for highly blueshifted absorption lines in the spectrum.
4.5 Origin of the UV absorption systems
The = 0.098 system is consistent with being produced in the
halo of the host galaxy or of a nearby companion but could also
be intrinsic to the nucleus. As for the = 0.091 system
the probable presence (which needs verification) of
the CIII∗1176 line suggests that
the system is intrinsic to the quasar and forms in an outflowing wind
with a velocity of 1900 km s-1.
5 Do the UV and X-ray absorption lines come from the same absorber?
5.1 UV absorption lines from the Warm Absorber
(a) The EW of the UV absorption lines expected from the Warm Absorber have been calculated for the statistically acceptable models of the ROSAT data. They are given in Table 5, separately for low- and high-state as a measure of the uncertainty arising from the continuum variability (non simultaneous UV and X-observations, non- equilibrium of the gas, etc. see Section 1 and Nicastro et al. 1999a).
| state | log | log | model | ||||
|---|---|---|---|---|---|---|---|
| NeVIII | OVI | FeXXI | FeXIV | ||||
| HS/LS | 0.7/0.3 | 23.3/22.9 | 1.6 | 0.1 | 1.7 | - | (c): Ne = 4solar abundance |
| HS/LS | 0.7/0.5 | 23.5/23.4 | 1.3 | 0.2 | 2.5 | 0.01 | O = 0.4solar abundance |
| HS/LS | 0.6/0.4 | 23.1/23.1 | 0.1 | 0.05 | 1.2 | - | (e): additional 0.1 keV soft excess |
We find that the CIV1550 and NV 1240 absorption lines are weak at low state, and negligible at high state (because C and N are highly ionized). There is always some absorption by hydrogen due to the large column density in H.
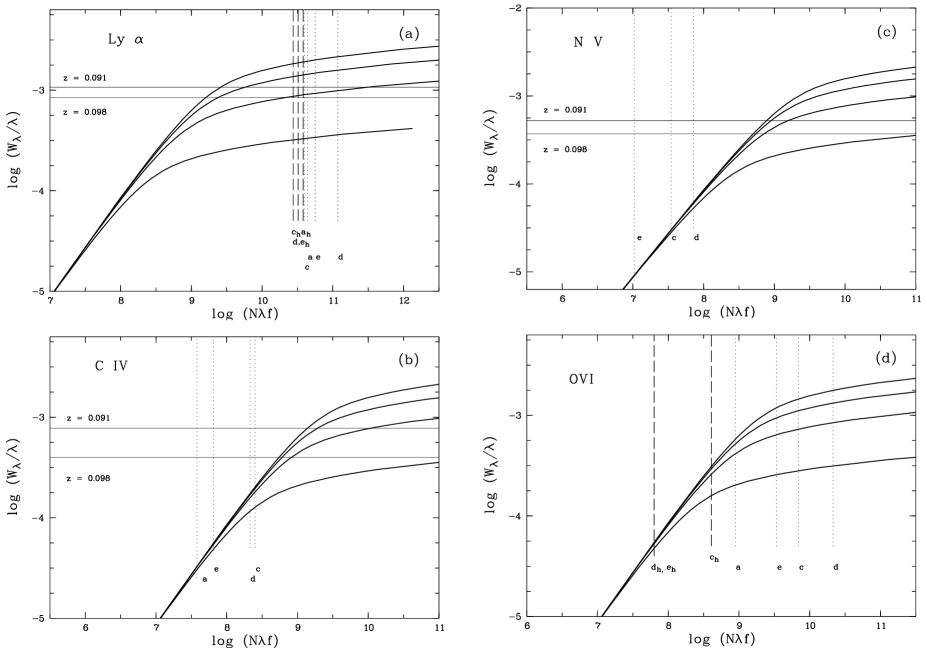
(b) Following Spitzer (1978), a standard curve of growth was calculated for velocity parameters b = 20,60,100,140 km s-1 (Figs. 8a-d). The predicted equivalent widths of Ly, CIV, NV, and (OVI) were then compared with those derived from the analysis of the HST spectrum.
We find that at the ROSAT low-state (which is close
to the state of the source
at the time of the ASCA observations), and
for b about 60 km s-1, there is a rough match between the
Ly and CIV absorption
lines produced by the warm absorber and the observed lines at = 0.098
and = 0.090 (models c-e). The NV absorption line from the warm absorber is,
however, always weaker than observed (N is too highly ionized in the models).
Including an additional EUV bump will further increase the level of
ionization, thus not changing the above conclusions.
The different models differ most strongly in OVI, so this may be the
most restrictive line, but it falls just outside the HST range.
In conclusion, we find no single-phase medium which can produce both
the UV and the X-ray absorption lines.
(c) In the case of the best fit to the ASCA data i.e. the model with Fe overabundant by a factor of 22 over solar, the degree of ionization is not known but it is likely to be too high for the production of the CIII∗ absorption line. Thus, in this case also, the UV and X-ray absorbers are very probably in different gaseous phases.
5.2 Emission lines from the Warm Absorber
Tab. 5 gives the intensity of the strongest lines emitted by the absorber within the wavelength range of the HST spectra and in the optical range. The calculations were performed with a density of log nWA = 9.5. The line NeVIII774 was added to the list because of recent reports of its detection in high- quasars (Hamann et al. 1997). Table 5 is meant to provide an order of magnitude estimate of which lines may be important/detectable in the future. The actual strength of the lines depends on the covering factor of the warm absorber; total coverage was assumed for the values in Table 5.
5.3 Relation between the X-ray and the UV absorber
In the recent years it has been realized that gas outflow is ubiquitous in AGN. It occurs under different gas phases: broad emission line gas (the most highly ionized lines are the most blueshifted) and UV/optical absorption lines (always observed at rest or blueshifted). It is likely that the X-ray absorption features also, originate in outflowing gas at velocities comparable with or higher than those of the UV emission/absorption gas - this cannot presently be ascertained because of the insufficient energy resolution of the X-ray instruments. [This is not counting here the extraordinary blueshift of the X-ray absorbing gas if the 1 keV features are blueshifted OVII or OVII edges].
The question as to whether UV absorption lines and X-ray absorption lines/edges tend to be present together or separately in AGN has been adressed by Ulrich (1988) and more recently by a number of authors (e.g. Schartel et al. 1997, Crenshaw 1997, Mathur 1997, Shields & Hamann 1997, Kriss et al 1996).
In some AGN, the data appear consistent with a single-phase, photoionized plasma producing the UV absorption and the OVII and OVIII edges (NGC 3783 Shields & Hamann 1997; 3C212, 3C351 and NGC 5548 Mathur 1997). In contrast, in other AGN, the properties of the UV and the X-ray absorbers imply the presence of multiphase media (NGC 3516 Kriss et al 1996; MCG-6-3-15 Otani et al 1996). The present analysis indicates that PG1404+226 is another such case of multiphase absorbing medium (but the non-simultaneity of the observations has to be kept in mind).
With the detection of X-ray and UV absorption in PG1404+226 the statistical association between the presence of UV absorption lines and X-ray absorption edges becomes stronger (Ulrich 1988, Mathur Wilkes & Elvis 1998). The two absorbers could be two different gaseous phases, partaking in the same outflow but differing by their physical conditions, velocity and radial distance to the central black hole.
6 Conclusions
The main results of our analysis can be summarized as follows:
1) The X-ray spectrum of PG 1404+226 is variable by a factor 4 in 104s and is characterized by a strong soft excess below 2 keV whose luminosity ( erg s-1 in the 0.4–2.0 keV energy range) is about a factor 3 greater than the 2–10 keV luminosity ().
The soft excess emission can be described with a high temperature optically thick blackbody ( eV). Optically thin models are ruled out combining the observed luminosity with the dimension of the region derived from the variability timescale.
2) The residuals around 1 keV can be best described by an absorption edge at keV, not consistent with being caused by highly ionized oxygen at rest in the quasar frame. A possible explanation could be either in terms of iron overabundance, as suggested by the warm absorber fits and the extremely high EW of the iron K line, or by resonant absorption in a turbulent gas. The interpretation of a blueshifted Oxygen edge in a relativistically outflowing gas is less likely and not supported by the optical–UV data. X–ray observations of NLS1 at high spectral resolution with XMM and Chandra will allow to clarify the origin of the 1 keV absorption detected in PG 1404+226 and 3 other NLS1.
3) Two systems of absorption lines separated by km s-1 are identified in the FOS/HST spectra in the lines of Ly, C iv and N v. One system is located to the red of the emission line peaks. Considering that in most radio quiet QSOs the highly ionized emission lines are blueshifted (as part of an outflow from the face of the accretion disk turned toward us) we argue that this absorption system is nearly at rest in the AGN frame. Its properties are consistent with this absorber being produced in the halo of the host galaxy or a companion. As for the system blueshifted by km s-1, the very probable detection of CIII∗1175 (which has been seen in absorption only in NGC 4151 - Bromage et al. 1985, Kriss et al. 1992 ) indicates that this system is intrinsic to the quasar.
4) With the detection of X-ray and UV absorption in PG1404+226 the statistical association between the presence of UV absorption lines and X-ray absorption edges first suggested by Ulrich (1988) is becoming clearer (Mathur Wilkes & Elvis 1998). We may be seeing two different absorbers with different physical conditions and locations but both being parts of a grand design outflow. The differences observed among absorption features in various AGN are likely to result from intrinsic differences in the properties of the gaseous outflows, from differences in the aspect angles and from the shape of the X–ray spectrum.
Acknowledgements.
We thank Gary Ferland for providing Cloudy. AC acknowledges partial support by the Italian Space Agency (ASI) under the contract ASI-ARS-96-70 and by the Italian Ministry for University and Research (MURST) under grant Cofin98-02-32. St. K. acknowledges support from the Verbundforschung under grant No. 50 OR 93065, and P.C. acknowledges support from NASA through contract NAS5-26670.References
- (1) Boller T., Brandt W.N., Fink H., 1996, A&A, 305, 53
- (2) Boroson T.A., Green R.F., 1992, ApJS, 80, 109
- (3) Brandt W.N., Fabian A.C., Nandra K., Reynolds C. S., Brinkmann W., 1994, MNRAS 271, 958
- (4) Brandt W.N., Mathur S., Elvis M., 1997, MNRAS 285, L25
- (5) Bromage G.E., Boksenberd A., Clavel J., et al. 1985, MNRAS, 215, 1
- (6) Comastri A., Setti G., Zamorani G., et al 1992, ApJ 384, 62
- (7) Comastri A., Molendi S., Ulrich M.-H., 1997, (CMU97) in X-Ray Imaging and Spectroscopy of Cosmic Hot Plasmas, F. Makino, K. Mitsuda (eds), 279
- (8) Comastri A., Fiore F., Guainazzi M., et al 1998, A & A 333, 31
- (9) Comastri A., Brandt, W. N., Leighly, K. M., et al. 1998, Proceedings of the Conference The Active X-Ray Sky, Results from BeppoSAX and RXTE, Scarsi L. et al eds Nuclear Physics B Suppl. 69/1 page 523
- (10) Corbin M.R., 1995, ApJ, 447, 496
- (11) Crenshaw D.M., 1997 in Mass Ejection from Active Galactic Nuclei, Arav N., Shlosman I., Weymann R.J., eds, ASP Conf. Series, Vol., 128, 121
- (12) Czerny B., Witt H. J., Zycki P. T., 1996 INTEGRAL Workshop, The Transparent Universe, St. Malo, September 1996
- (13) Done C., Mulchaey J. S., Mushotzky R. F., Arnaud K. A., 1992, ApJ 395, 275
- (14) Elvis M., Lockman F.J., Wilkes B.J., 1989, AJ, 97, 777
- (15) Ferland G.J. 1993, University of Kentucky, Physics Department, Internal Report
- (16) Fink H., Walter R., Schartel N., Engels D., 1997, A&A, 317, 25
- (17) Fiore F., Matt G., Cappi M., et al 1998, MNRAS, 298, 103
- (18) Grupe D., 1996, PhD Thesis (University of Göttingen)
- (19) Haardt F., Maraschi L., 1993, ApJ, 413,507
- (20) Hamann F. Ferland G.J. 1993, ApJ, 418, 11
- (21) Hamann F., Cohen R.D., Shields J.C., Burbidge E.M., Junkkarinen V., Crenshaw D.M., 1997, ApJ, 496, 761
- (22) Hayashida K., 1997 in Emission Lines in Active Galaxies: New Methods and Techniques Peterson B.M., Cheng F.-Z., Wilson A.S., eds, ASP Conference Series Vol. 113, 40 Vol. 113, 40
- (23) Komossa S., Fink H., 1997 A&A, 322, 719
- (24) Kriss G.A., Davidsen A. F., Blair W. P., et al., 1992, APJ, 392, 485
- (25) Kriss G.A., Espey B. R., Krolik J. H., et al 1996, ApJ, 467, 622
- (26) Krolik J.H., Kriss G.A., 1995, ApJ, 447, 512
- (27) Laor A., Fiore, F., Elvis, M., et al 1994, ApJ 435, 611
- (28) Laor A., Bahcall J. N., Jannuzi B. T., et al 1995, ApJS 99, 1
- (29) Laor A., Januzzi B.T., Green R.F., Boroson T.A., 1997 in Emission Lines in Active Galaxies: New Methods and Techniques Peterson B.M., Cheng F.-Z., Wilson A.S., eds, ASP Conference Series Vol. 113, 116
- (30) Leighly K.M., Mushotzky R.F., Nandra K., Forster K., 1997, ApJ, 489, L25
- (31) Marshall F. E., Netzer H., Arnaud K. A., 1993, ApJ, 405, 168
- (32) Mathur S., 1997 in Mass Ejection from Active Galactic Nuclei ASP Conf. Series, Vol., 128, 161 Arav N., Shlosman I., Weymann R.J., eds ASP Conf. Series, Vol., 128, 161
- (33) Mathur S., Wilkes B., Elvis M., 1998, ApJ, 503, L23
- (34) Netzer, H., Turner T. J., 1997 ApJ, 488, 694
- (35) Nicastro F., Fiore F., Perola G. C., Elvis M., 1999a, ApJ 512, 184
- (36) Nicastro F., Fiore F., Matt G., 1999b, ApJ 517, 108
- (37) Osterbrock D.E., Pogge R., 1985, ApJ., 297, 166
- (38) Otani C., Kii T., Miya K., 1996 in Intern. Conf. on X-Ray Astron. and Astrophys., MPE Report, 263 Zimmermann H.-U., Trümper J.E., Yorke H., eds., 491
- (39) Pounds K.A., Done C., Osborne J.P., 1995, MNRAS, 277, L5
- (40) Reynolds C.S., Fabian A.C., 1995, MNRAS, 273, 1167
- (41) Reynolds C.S., Fabian A.C., Inoue H., 1995, MNRAS, 276, 1311
- (42) Reynolds C.S., 1997, MNRAS 286, 513
- (43) Schartel N., Komossa S., Brinkmann W., Fink H.H., Trümper J., Wamsteker W., 1997, A&A 320, 421
- (44) Shields J.C., Hamann F., 1997, ApJ, 481, 752
- (45) Shuder J.M., Osterbrock D.E., 1981, ApJ., 250, 55
- (46) Spitzer L., 1978, Physical Processes in the Interstellar Medium. John Wiley Sons, New York
- (47) Sulentic J.W., Marziani P., Zwitter T., Calvani M., 1995, ApJ, 438, L1
- (48) Tanaka Y, Inoue H., Holt S.S., 1994, PASJ 46, L37
- (49) Ulrich M.-H., 1988, MNRAS, 230, 121
- (50) Ulrich M.-H., Molendi S., 1996, ApJ, 457, 77 (UM96)
- (51) Van Groningen E. 1987, A&A, 186, 103
- (52) Zdziarski A., Ghisellini, G., George, I.M. et al. 1990, ApJ, 363, L1