The “Outside–In” Outburst of HT Cassiopeiae.
Abstract
We present results from photometric observations of the dwarf nova system HT Cas during the eruption of November 1995. The data include the first two–colour observations of an eclipse on the rise to outburst. They show that during the rise to outburst the disc deviates significantly from steady state models, but the inclusion of an inner-disc truncation radius of about 4 and a “flared” disc of semi-opening angle of produces acceptable fits. The disc is found to have expanded at the start of the outburst to about , as compared to quiescent measurements. The accretion disc then gradually decreases in radius reaching during the last stages of the eruption. Quiescent eclipses were also observed prior to and after the eruption and a revised ephemeris is calculated.
keywords:
novae, cataclysmic variables - physical data and processes: accretion, accretion discs - binaries: close - binaries: eclipsing - stars: individual: HT Cas1 Introduction
For many years there have been theoretical predictions that accretion discs can undergo outbursts which start either close to their inner edge, or their outer edge (Meyer & Mayer–Hofmeister 1984; Mineshige & Osaki 1985; Ludwig & Meyer 1998). In this and the following paper we use the eclipsing dwarf novae to resolve spatially their outbursts, and prove that one outburst is “outside–in”, the other “inside–out” [Webb et al. 1999]. This is the first time an “inside–out” outburst has been resolved, and should be viewed as a major vindication of disc instability theories. In both cases we find that the discs have extensive vertical structure, which is shown to be the cause of problems of interpretation in the only other observation of an “outside–in” outburst (Vogt 1983; Rutten et al. 1992).
The dwarf nova observed in this paper is the SU UMa star HT Cas, whose orbital period is about 106 min. (Patterson 1981; Zhang, Robinson & Nather 1986; Wood, Horne & Vennes 1992)
2 Observations & Data Reduction
| Date | Eclipse | BDJD | Observatory | Filter | State | Cycle time | Depth | FWHM |
| 2450000+ | (s) | (mag) | (phase) | |||||
| 1995 Oct 27 | 85415 | 18.51448 | Keele | V | Q | 20 | ||
| 85416 | 18.58809 | Keele | V | Q | 20 | |||
| 1995 Nov 17 | 85700 | —- | Keele | V | O | 8 | -0.98 | 0.054 |
| 39.50388 | St.Andrews | R | O | 20 | -0.94 | 0.061 | ||
| 85701 | 39.57750 | St.Andrews | R | O | 25 | -0.95 | 0.054 | |
| 85702 | 39.65112 | St.Andrews | R | O | 20 | -0.91 | 0.059 | |
| 85703 | 39.72476 | St.Andrews | R | O | 20 | -0.91 | 0.058 | |
| —- | Keele | V | O | 8 | -1.01 | 0.056 | ||
| 1995 Nov 18 | 85711 | 40.38743 | St.Andrews | R | O | 20 | -1.21 | 0.048 |
| 85712 | 40.46079 | St.Andrews | R | O | 20 | -1.33 | 0.046 | |
| 85713 | 40.53421 | St.Andrews | R | O | 20 | -1.36 | 0.047 | |
| 85714 | 40.60761 | St.Andrews | V | O | 25 | -1.61 | 0.040 | |
| 1995 Nov 19 | 85724 | 41.27144 | Essex | O | 25 | -2.23 | 0.036 | |
| 85725 | 41.34501 | Essex | O | 25 | -2.42 | 0.035 | ||
| 85727 | 41.49239 | St.Andrews | R | O | 20 | -2.01 | 0.038 | |
| 85728 | 41.56605 | St.Andrews | R | O | 20 | -2.04 | 0.039 | |
| 85730 | 41.71326 | St.Andrews | V | O | 25 | -2.58 | 0.038 | |
| 1995 Nov 22 | 85769 | 44.58551 | Keele | R | Q | 25 | ||
| 1995 Nov 29 | 85863 | 51.50834 | Keele | V | Q | 35 | ||
| 1997 Jan 14 | 91454 | 463.26995 | Keele | Clear | Q | 15 | ||
| 91455 | 463.34345 | Keele | Clear | Q | 15 | |||
| 91456 | 463.49075 | Keele | Clear | Q | 15 | |||
| 1997 Mar 02 | 92093 | 510.33020 | Essex | V | O | 45 | -2.12 | 0.038 |
| 1997 Sep 05 | 94621 | 696.51040 | Keele | Clear | Q | 25 | ||
| 1997 Sep 10 | 94689 | 701.51845 | Keele | Clear | Q | 25 |
aThe unfiltered response for this CCD approximately resembles a broad V band
The observations of HT Cas, from the 1995 November eruption were carried out with the CCD system on the 0.95m James Gregory Telescope (JGT) at the University of St. Andrews (Bell, Hilditch & Edwin [Bell, Hilditch & Edwin 1993]), the 0.6-m Thornton Reflector at Keele Observatory [Somers et al. 1996b] and with a 0.3m Newtonian reflector in Essex. Table 1 lists all the observations. Timings are in Barycentric Dynamical Julian Date (BDJD).
The raw images where processed in the standard way for the instruments in question, as outlined in ?) and Bell et al. [Bell, Hilditch & Edwin 1993]. The data from Essex were dark subtracted and flat fielded in the standard way for CCD photometry. The data were extracted using an optimal extraction technique by Naylor [Naylor 1998]. The values for the visual magnitudes for the standard stars were adopted from ?).


3 The Light Curves
The overall outburst light curve is depicted on Fig. 1. The rise to outburst looks very steep with a linear decline. Our coverage of the outburst rise phase starts at a point where the system had reached a brightness level about 3 magnitudes above its normal quiescent value. A steep rise is observed of less than 30 hours between the last observed quiescent point (G. Poyner; priv. com.) and the peak of the outburst. The coverage of the decline phase was very good with the system being about one magnitude brighter than its quiescent value at the end of our coverage. The duration of this normal outburst is therefore estimated to be 3.5 to 4 days.
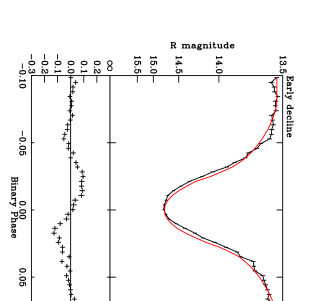
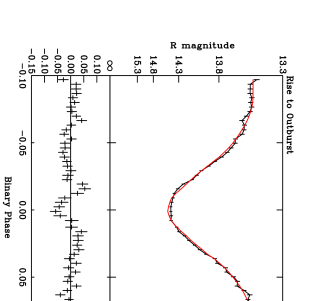
The outburst light curves show extremely symmetric eclipses. This suggests that the disc is emitting more radiation than the white dwarf, the bright spot, and the secondary star combined. Evidence of this outburst being of an “outside-in” type comes from examining the individual R-band and V-band outburst light curves in Fig. 2 and Fig. 3 respectively.
It can easily be seen that the rise to outburst eclipses are wider than the eclipses in the late stages of the outburst (see Fig. 2, Fig 3 and Fig. 6).Also, eclipse depths during the rise are much shallower than the eclipses during the decline, indicating that during mid eclipse there is more flux observed from either side of the secondary star during the rise phase than the decline phase of the outburst.
Since the outburst eclipses are extremely symmetric, we fitted them with a Gaussian to measure the duration and depth of each eclipse. The residuals from the Gaussian fit were at the 5% level. Table 1 lists the full width half minimum for each light curve along with the depth of each eclipse. It is evident from Table 1 that the outburst eclipses increase their depth and become narrower as the eruption progresses. It is a further indication that the outburst starts at the edge of the disc, whose luminous part is relatively large at the beginning of the outburst, and decreases in size as the outburst progresses.
?) observed dwarf nova oscillations (DNO) during an eruption of HT Cas in 1978. A power spectrum of our V and R out-of-eclipse data did not reveal any significant oscillations. Given that we have a relatively low temporal resolution and also that DNOs are usually found in shorter wavelength regions, this is not very surprising.

4 Eclipse Timings and Ephemeris
Table 1 shows the mid-eclipse timings obtained during the quiescent and outburst periods in 1995 and 1997. Previous data, that were explicitly tabulated, from ?), ?), and Horne et al. (1991). were converted from Heliocentric Julian Date to Barycentric Dynamical Julian Date and used in our calculations. Only the quiescent data were used in order to calculate the refined ephemeris presented here. The mid-eclipse positions were calculated by measuring the time of the white dwarf ingress and egress.
For the outburst data presented here we used a Gaussian curve fit to measure the time of minimum flux. The data for November 17th from Keele Observatory have a timing problem and they have been left out from all our calculations involving time and are not displayed on the O-C diagram.
Below is our calculated ephemeris in Barycentric Dynamical Julian Date with the uncertainties shown in brackets.
BDJD=2443727.93782(3)+0.073647211(5)E.
We used our derived period to project back to the quoted by ?). The residuals of our ephemeris calculations (O-C diagram) can be seen in Fig. 4. The unused outburst eclipse points are represented as circles. ?) speculated that HT Cas might have a non zero period derivative. However, due to the large scatter of the data points in Fig. 4 we could only fit the data with a linear ephemeris.
During the outburst an anomaly of the O-C points is observed, especially during the second night of observations when the system is at its early decline stages. (see Fig. 5) During the decline from outburst the points gradually drift to a maximum difference of 79 seconds from the calculated value. Observations of other objects on the same night show this is not a computer clock problem. The O-C points then return to their normal level the following night. We comment on this unusual behaviour in the discussion section of the paper.


5 Modelling the Eclipse Data
A model that takes into account the flux emitted by a white dwarf encircled by an optically thick accretion disc and a Roche-lobe filling secondary star, which is tidally locked in the frame of the binary, was modified and used for the investigation of the observed light curves during the HT Cas outburst. The model also accounts for the irradiation of the secondary’s surface by a heating source at the centre of the disc. We also incorporate approximate temperature dependent limb darkening coefficients taken from ?). Descriptions of previous versions of the code can be found in ?) and ?). The model does not include the physical size and shape of the white dwarf or the white dwarf’s shadow onto the accretion disc. Also, it takes no account of a bright spot or an accretion stream.
It is evident from the symmetric outburst eclipses of HT Cas that flux from the erupting accretion disc completely dominates the flux contributions from the bright spot and the white dwarf, thus we believe that the assumption in the modelling code of not considering flux from a bright spot is valid for this case.
The overall temperature distribution of a dwarf nova disc that undergoes outbursts is clearly not that of a steady state model. However, at any time during the outburst, models for example by ?), show that the luminous parts of the disc undergoing an eruption closely resemble steady state models, but with truncated inner and outer radii. Thus we employed the standard steady state disc equation in order to calculate the flux from the disc, where the dependence of temperature is proportional to . We searched for an exponent for that would reproduce the eclipse data better but we found that the preferred exponent was always very close – if not identical – to , indicating that the luminous part of the disc behaves in a quasi-steady state manner.
In our investigation of the eruption of HT Cas we were mostly concerned with the changes undergone by the accretion disc. Thus we fix those parameters given in Table 2. We apply a grid search for parameters that mainly concern the disc itself, for example the disc radius and the semi-opening angle.
| Parameter | Value | Reference |
| Mass ratio | 0.18 | ?) |
| Period (days) | 0.073647211 | This paper |
| Inclination | 80 | ?) |
| 0.91 | ?) | |
| 0.71 | ?) | |
| 0.08 | ?) | |
| Distance (pc) | 140 | Wood et al. (1992) |
| (K) | 14000 | Wood et al. (1992) |
| (K) | 2500 | ?) |
| ?) |
The parameters which concern the secondary star atmosphere have a very small, and often un-noticeable, effect on the overall light curve of the system. There is no indication of reprocessed radiation by the secondary star as the light curves do not show any orbital modulation that would be induced by irradiation from the white dwarf or a boundary layer.
| q=0.18 | Eclipse | Outer | Inner | Semi–opening | Ṁ | Reduced | fit | |
| Number | angle | # | ||||||
| Rise to Outburst | (85700) | 1.56 | 1 | |||||
| 0 (fixed) | 3.56 | 2 | ||||||
| 1 (fixed) | 20.96 | 3 | ||||||
| Peak of Outburst | (85703) | 0.74 | 4 | |||||
| Early Decline | (85711) | 0 | 8.89 | 5 | ||||
| Late Decline | (85728) | 0 | 7.34 | 6 |


5.1 The rise–to–outburst eclipses
All the fits presented here are models of the R-band data and are detailed in Table 3. We cannot match the rise to outburst eclipses with a steady state model, even if we include considerable disc opening angles (Fit 2 in Table 3). The eclipses that were generated by the model are always steeper than the data during ingress and egress. During eclipse minimum the steady state models could not reproduce the flatness shown by the data.
To match the slope and depth of the eclipse light curves we used the code to calculate the flux from a truncated disc and made the code search for an inner truncation radius that would best match the data for each given outer radius. The semi-opening angle search in this case was coarser than the full disc models and varied from to in steps.
The resulting models produced a much better fit to the data than the full disc models. The value returned by the model for the outer disc radius on the rise to outburst was and along with the value for the inner truncation radius of about 4 and a flare angle of produced a fit with a of 1.56 (Fit 1 in Table 3). We were still not able to reproduce exactly the flatness exhibited by the data at eclipse minimum, but ingress and egress are very well matched. Thus we conclude that in order to match the eclipses during the rising phase of the outburst, we need a truncated disc.
To prove that both the flare and truncation were required we ran a further set of models (Fit 3), where the disc was truncated but not flared. The model profile did not match the observed data. The contact phases of the eclipse wings, which denote the contact phases of the disc edges with the secondary star extend beyond phases and require a disc size of . The for this model is very large with a value of 20.96
The errors quoted for the semi-opening angle and the mass transfer rate in Table 3 are empirical errors derived by fitting the data with models that lie above and below the data points.
5.2 Eclipse colours on the rise–to–outburst
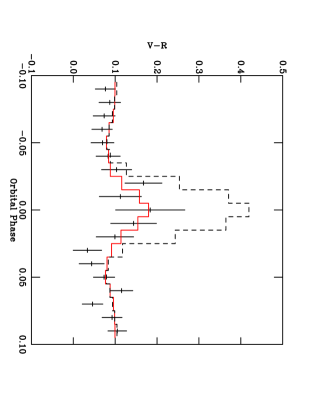
The outburst eclipses 85700 and 85703 were observed in two colours. V-band data were taken from Keele while the system was also observed in the R-band from St. Andrews. Since the R-band data from St. Andrews were of lower temporal resolution, we binned the V-band data from Keele to match the exact phases of the St. Andrews data. The resulting eclipse light curve for cycle 85700 can be seen in Fig 7. For clarity the data presented here were binned again into 0.01 phase bins starting from phase -0.1 to phase +0.1.
The histograms in Fig 7 are not model fits, but simply the calculated from the V and R synthetic light curves, created from the best fit parameters for the band data. With a of 0.81 the solid line histogram in Fig 7 is an adequate description to the data. A constant of value 0.083 produced a of 1.24. Non-flared truncated disc models produced a fit with a of 1.51, but these models gave inadequate fits for the individual V and R eclipses (see Table 3).
Thus we conclude that the system does not show any significant colour change during eclipse. To further emphasise the point that we cannot match the eclipses without a considerable flaring angle and without an inner truncation radius, we plot the values obtained from our best flat and non-truncated model disc. Clearly this model does not fit the data.
5.3 Peak of outburst
For the eclipse close to the peak of the outburst the model prefers a smaller disc of radius with a larger flare angle of and also with the smaller inner truncation radius of about 1 . The for this model is 0.74 (Fit 4).
With such a large flaring angle at the peak of outburst and given the inclination of this system, the inner parts on the far side of the accretion disc are hidden from view up to about 3 from the surface of the white dwarf. Thus we do not believe that the value of 1 for the inner truncation radius is physically meaningful. The contours for this eclipse (Fig. 8) confirm this showing that the model is insensitive to values for the inner truncation radius up to about 3 from the white dwarf’s surface.
The preference of the model to have a truncated disc on the rise to outburst suggests that either there is no material present in the inner most parts of the accretion disc (at least during the rising phase of the outburst) or that the hot transition front travelling from the outer parts of the disc towards the centre has not yet reached the inner parts of the accretion disc. In the second case, the inner disc is not void of material, but simply it does not emit significant amounts of flux because the hot transition front has not yet traversed the inner parts of the disc.

5.4 Decline from outburst
For the eclipses on the decline and late decline, the best models prefer a non–truncated disc, which show that the transition front, that originated at the outer parts of the disc and is traveling towards the centre has traversed the whole accretion disc, which has now started returning to its quiescent state (Fits 5 and 6).
At this stage the boundary layer around the white dwarf must have reached its highest optical flux levels of the outburst, and the white dwarf must be significantly hotter than during the rise. However, we do not observe any effects of irradiation from the inner parts of the disc, the boundary layer, or the white dwarf onto the secondary star during any stage of the outburst. This could be explained as the effect of a rim wall which prevents radiation from the innermost parts of the disc reaching the secondary star surface. Also, effects of the irradiated secondary could be completely swamped due to the high flux levels of the accretion disc.
During the decline from outburst there is a phase shift between the models and the actual data. The mid-eclipse in our models is always centered at phase zero, while the data seem to shift during the outburst, especially during the second night of observations. Regardless of the drift the eclipse profiles retain their high level of symmetry. Despite this peculiarity the model is able to reproduce the overall eclipse profile quite accurately. Undoubtedly, though, these models constitute only an upper limit on the disc radius and flare because the model uses a symmetric accretion disc and therefore any change of the eclipse ingress profile will similarly affect the egress profile. Indeed, when we manually shift the data to our calculated phase zero, the model eclipse profiles are in very good agreement with the observed data. The of the fits drops by a factor of 4 for the case of the early decline and also goes down by a factor of 2 for the modeled eclipse during the late stages of the decline.
Although the values derived here for the semi-opening angle and the disc radius only constitute upper limits, they do show that the accretion disc is decreasing in size during the late stages of the decline.
6 Discussion
Investigation of the results presented in section 5 show clearly that the November 1995 outburst of HT Cas was of the “outside - in” type. We believe that the models show a relatively large luminous disc during the rise to outburst, which then shrinks to in the later stages of the decline. It might be that the disc was smaller than at the early stages of the rise but unfortunately our coverage does not include observations at these outburst phases.
Although our results seem to be in general agreement with the predictions of the models of ?), a discrepancy is noted. The quiescent disc radius for HT Cas was measured by Horne et al. (1991) and was found to be where a is the binary separation. This translates to using a mass ratio of q=0.15. This value for is considerably less than our value of during the rise of the outburst. Also, investigation of the SU UMa system Z Cha by ?) shows that there is a decrease in radius of the accretion disc in the time between outbursts. Assuming that HT Cas behaves in a similar manner this would mean that the pre-outburst disc was even smaller than that quoted by Horne et al. (1991). Thus the luminous radius of the disc on the rise to outburst is larger than the physical radius in quiescence.
This contrasts with the predictions of the models by ?). They show that a heating wave is initiated by a disc instability in the outer parts of the disc which travels inwards, with the luminous part never reaching the quiescent radius. This would suggest that during an outburst the disc would have a luminous size roughly the same as that of the quiescent disc, with cool material on the outward side of the hot front expanding slightly in order to preserve angular momentum.
The disc never reaches the tidal radius, which for this system is at . Thus, no superhump is observed during the eruption. Effects in the diagram though are difficult to explain. During eruption, and in particular during the second night of observations the values begin to drift and reach up to a maximum delay of 79 seconds. The difficulty in explaining this feature as a simple dislocation of the flux centre comes from the fact that the eclipses retain their symmetry. Thus any dislocation of the flux centre must be accompanied by another effect, such as disc asymmetry, in order to counteract the change of flux centre and keep the overall eclipse shape symmetric.
The mass transfer rate through the disc, which is dependent on the distance, is found to be relatively high during the rise (Ṁ=). At the peak of the outburst the model results show a lower value of Ṁ=. This is surprising but it can be explained if we consider that when the system is at the peak of outburst the inner disc, unlike before, is now very hot and luminous. Therefore in order to match the flux level of the system we do not need high mass transfer rates.
The Ṁ value quoted by ?) for the January 1985 superoutburst is . This is about a factor of 2.5 times lower than our Ṁ estimate for the rise to outburst. Our slightly higher Ṁ values are easily explained by the fact that our disc models include an outer disc rim wall of semi-opening angle of , which covers part of the disc and thus increasing the observed mass transfer rate necessary to match the flux level of the system.
During the decline, we believe that a cooling front, as described in ?), moves inward reducing the disc temperature and at least for the duration of the eclipses the disc behaves in a steady state manner. Also, ?) showed that for the case of Z Cha, for the disc temperature to decrease with time it is necessary for the disc to behave like, or at least be very close to, steady state. Conversely, models by ?) on the decline of the optical fluxes during outbursts of dwarf novae require the accretion disc to be departing from steady state models. Clearly this is not the case that we observe, since our steady state models for the eclipses during the late decline are in good agreement with the observed data.
Comparing the results from the eruption of HT Cas with other outbursts of SU UMa systems we see many similarities. In the case of OY Car, eclipse light curves observed by ?) and later re–examined by ?) show the same kind of behavior as the outburst eclipses of HT Cas. Both systems are slowly departing from their quiescent eclipse shape, moving towards a more symmetric shape with a distinct flat eclipse bottom during the early rise. These results are also in extreme contrast with the results of ?) for the “inside–out” outburst of the U Gem system IP Peg.
6.1 The inner disc “truncation”
A hot transition front of material, which is moving towards the centre of the disc, is suggested by the preference of the modelling code to place a hole (or non-luminous material) with a radius of about from the centre of the accretion disc during the rising phase of the outburst. It is unclear as to whether the disc is truncated or not when at the peak of the outburst, as the flare angle of the disc grows to and so the innermost parts of the disc are hidden from view. During the decline from outburst the truncation radius is zero.
Several theories have been put forward in order to explain the delay in the rise of the ultraviolet flux as opposed to the optical. For example, ?) proposed that the inner parts of the disc remain void of material during quiescence due to irradiation from the white dwarf. Similarly ?) employed a weak magnetic field to truncate the disc, in the same manner as in intermediate polar systems. Also, ?) suggested that a “siphon” coronal mass flow was responsible for emptying the inner parts of the accretion disc. Irradiation of the inner parts of the accretion disc by a hot corona that lies above the cool quiescent disc, leads to the evaporation of material in those inner disc regions. Material from the disc joins the hot corona above and then is accreted onto the white dwarf leaving the inner parts of the accretion disc relatively empty. However, the fact that HT Cas shows X-ray eclipses (Wood et al. 1995; Mukai et al. 1997) does not support the theory of a hot X-ray producing corona, but instead suggests that the X-ray emitting regions in HT Cas are very close to the white dwarf.
There has been previous observational evidence for the truncation of accretion discs in non-magnetic dwarf nova systems. ?) found evidence of truncated accretion discs for at least four different systems. They compared the ratio of UV fluxes produced by white dwarfs and accretion discs as predicted by the evaporation theory of Meyer and Meyer–Hofmeister [Meyer & Meyer–Hofmeister 1989] and ?).
In all three scenarios outlined above, the delay of the UV flux arises because of the time it takes for the inner parts of the disc to be filled by material in outburst that is moving inwards. Unfortunately we do not possess any UV data for this outburst in order to confirm that our model results are compatible with the above theories. However, ?) and ?) speculate that the delay in the UV flux observed in the VW Hyi system, which was observed simultaneously in the X-ray, UV and optical parts of the spectrum during an eruption, could be explained by such a mechanism. Our data appear to show such a gap being filled.
6.2 A vertically extended disc
There is substantial evidence that the disc is highly flared throughout the outburst, especially near the peak of the eruption.
The semi-opening angle of the disc is seen to expand from during the rise to at the peak and then starts to decrease again during the decline. This could possibly be explained by the “avalanche” effect that ?) see in their model calculations. As the hot front travels towards the inner parts of the disc, it causes the viscosity of the material that has just gone through the heating front to rise sharply. Therefore as the front moves inwards, material that is now in outburst, is piled up behind the hot front perhaps thickening the disc. As the outburst declines, a cooling front that moves inwards makes the material at the outer parts of the disc return to their quiescent cold state. Again, as the cooling front travels inwards the disc is seen to decrease in size both radially and vertically.
Evidence that accretion discs thicken during outburst has been observed by others. In particular, in the case of another two SU UMa systems, OY Car and Z Cha. For the case of OY Car ?) were confronted with a similar problem of not being able to fit the outburst eclipses with a steady state model and they speculate that this could be due to a rim wall shadowing the inner parts of the disc. Also, ?) found evidence of a rim wall for OY Car by studying the UV and X–ray flux of the 1985 May superoutburst of OY Car. They suggest that the lack of an X–ray eclipse during the superoutburst, the existence of an orbital modulation of the UV flux and the observation that the UV spectra show emission lines which become narrower during eclipse, could be attributed to the fact that the processes taking place in the inner disc are partially hidden from view by a “disc that has an extensive vertical structure”. In addition, ?) found that by using the Maximum Entropy Mapping (MEM) method, in order to map the normal outburst eclipses of OY Car, they had to introduce an extra constant light source, which amounted to 15% of the observed flux from the system. They speculated that this inconsistency could be attributed to the assumption of their model that the accretion disc height was negligible.
One of the best pieces of observational evidence of flared accretion discs in SU UMa systems during outburst, came from the investigation of the Z Cha system by ?). They observed in the ultraviolet using the Hubble Space Telescope and were able to follow the system during two eruption cycles. MEM models with negligible thickness produced an asymmetry creating a spurious ring in their disc maps due to extra flux that the MEM models could not account for. They found that in order to explain the extra flux observed they had to include a disc flare of into their MEM models. Blackbody curves were used to estimate the effective temperatures of the disc. This produces a temperature profile which was very flat and deviated significantly from profiles predicted by steady state models. They have recently [Robinson, Wood & Wade 1999] improved their models using realistic model atmospheres in order to convert their surface brightnesses to effective temperatures, and also included the effect of limb darkening for accretion discs. They re-analysed their data for the Z Cha system and found that their temperature profile became steeper than their previous results, but it still did not match the steady state models. Their semi-opening angle for the accretion disc rim wall decreased but still remained considerable with a value of .
7 Conclusions
Given the comprehensive coverage of the November 1995 outburst of HT Cas, spanning rise, maximum, and late decline, we were able to follow the changes induced to the light curve of HT Cas due to the erupting accretion disc. The four significant results of this project are listed below.
(i)We have found that the outburst is initiated at the outer edges of the disc at a radius of and that the disc also expands vertically as the outburst evolves reaching a maximum of about when at the peak of the outburst. These values of the disc flaring might not necessarily mean that the accretion disc is flared to that extent, but they do emphasise that in order to match the observed flux we really do need luminous material that extends considerably above the orbital plane.
(ii)The models require disc semi-opening angles of the order of during the rise to outburst and close to the peak of outburst. It is not possible to model the system during the rise or at the peak of outburst simply by using conventional steady state models, or just flared disc models. In fact we have modified the model to search for an inner truncation radius for the disc and the results show that there might exist a heating front during the rise to outburst which moves towards the center of the disc. The size of the inner truncation radius seems to be about 4 during the rise to outburst.
(iii)Using steady state models we do observe the mass transfer rate through the disc to fluctuate by about a factor of 7 from the rise to outburst to late decline.
(iv)On the decline, steady state models, do seem to agree with observational data, although we detect a rather large deviation of the O-C points with the eclipse shape retaining the high level of symmetry during these shifts.
8 Acknowledgements
We would like to thank Dr. Yvonne Unruh for acquiring the JGT data as well as Prof. John Stull and amateur astronomer Mr. David Strange for supplementary data and also Mr. Gary Poyner who contributed useful information concerning the duration of the HT Cas 1995 outburst. Many thanks to the amateurs of Keele Astronomical Society for supporting and maintaining the Keele Observatory telescopes. Also, Dr. Janet Wood for useful comments and thoughts concerning this work. TN was supported by a PPARC advanced fellowship for part of this work. The data were reduced on the Keele STARLINK node using the ARK software.
References
- [Al-Naimiy 1978] Al-Naimiy H.M. 1978, Ap.&SS, 53, 181
- [Baraffe & Chabrier 1996] Baraffe I., Chabrier G., 1996, ApJ, 461, L51
- [Bell, Hilditch & Edwin 1993] Bell S.A., Hilditch R.W., Edwin R.P., 1993, MNRAS, 260, 478
- [Berriman, Kenyon & Boyle 1987] Berriman G., Kenyon S., Boyle C., 1987, AJ, 94, 1291
- [Catalán 1995] Catalán M.S., 1995, Ph.D. Thesis, University of Sussex
- [Cannizzo 1994] Cannizzo J.K., 1994, ApJ, 435, 389
- [Harlaftis 1992] Harlaftis E.T., Naylor T., Hassall B.J.M., Charles P.A., Sonneborn G., Bailey J., 1992, MNRAS, 259, 593
- [Horne 1985] Horne K., 1985, MNRAS, 213, 129
- [Horne & Cook 1985] Horne K., Cook,M.C., 1985, MNRAS, 214, 307
- [Horne, Wood & Stiening 1991] Horne K., Wood J.H., Stiening R.F., 1991, ApJ, 378, 271
- [King 1997] King A.R., 1997, MNRAS, 288, L16
- [La Dous et al. 1995] La Dous C., Meyer F., Meyer–Hofmeister E., 1995, in Cataclysmic variables and related objects, IAU Coll. 158, Keele, eds. A. Evans and J.H. Wood, Kluwer Astroph. and Space Science Library, p.81
- [La Dous, Meyer & Meyer–Hofmeister 1996] La Dous C., Meyer F., Meyer–Hofmeister E., 1996, A&A, 321, 213
- [Livio & Pringle 1992] Livio M., Pringle J.E., 1992, MNRAS, 259, 23
- [Ludwig & Meyer 1998] Ludwig K., Meyer F., 1998, A&A, 329, 559
- [Marsh 1990] Marsh T.R., 1990, ApJ, 357, 621
- [Meyer 1990] Meyer F., 1990, Rev. Mod. Aston., 3, 1
- [Meyer & Meyer–Hofmeister 1984] Meyer F., Meyer–Hofmeister E., 1984, A&A, 132, 143
- [Meyer & Meyer–Hofmeister 1989] Meyer F., Meyer–Hofmeister E., 1989, A&A, 221, 36
- [Mineshige & Osaki 1985] Mineshige S., Osaki Y., 1985, Publs astr.Soc.Japan, 37, 1
- [Mineshige 1991] Mineshige S., 1991, MNRAS, 250, 253
- [Misselt 1996] Misselt K.A., 1996, PASP, 108, 146
- [Mukai et al. 1997] Mukai K., Wood J.H., Naylor T., Schlegel E.M., Swank J.H., 1997, ApJ, 475, 812
- [Naylor et al. 1987] Naylor T., Charles P.A., Hassall B.J.M., Bath G.T., Berriman G., Warner B., Bailey J., Reinsch K., 1987, MNRAS, 229, 183
- [Naylor et al. 1988] Naylor T., Bath G.T., Charles P.A., Hassall B.J.M., Sonneborn G., van der Woerd H., van Paradijs J., 1988, MNRAS, 231, 237
- [Naylor 1997] Naylor T., 1997, Ultraviolet Astrophysics Beyond The IUE Final Archive, Sevilla, Spain, p.641
- [Naylor 1998] Naylor T., 1998, MNRAS, 296, 339
- [O’Donoghue 1986] O’Donoghue D., 1986, MNRAS, 220, 23
- [Osaki 1998] Osaki Y., 1996, PASP, 108, 39
- [Patterson 1981] Patterson J., 1981, ApJS., 45, 517
- [Pringle, Verbunt & Wade 1986] Pringle J.E., Verbunt F., Wade R.A., 1986, MNRAS, 221, 169
- [Ritter et al. 1998] Ritter H., Kolb U., 1998, A&AS, 129, 83
- [Robinson et al. 1995] Robinson E.L., Wood J.H., Bless R.C., Clemens J.C., Dolan J.F., Elliot J.L., Nelson M.J., Percival J.W., Taylor M.J., Van Citters G.W., Zhang E., 1995, ApJ, 443, 295
- [Robinson, Wood & Wade 1999] Robinson E.L., Wood J.H., Wade R.A, 1999, ApJ, in press
- [Rutten et al. 1992] Rutten R.G.M., Kuulkers E., Vogt N.,van Paradijs J., 1992, A&A, 265, 159
- [Sarna 1989] Sarna M.J., 1989, A&A, 224, 98
- [Shahbaz, Naylor & Charles 1993] Shahbaz T., Naylor T., Charles P.A., 1993, MNRAS, 265, 655
- [Shahbaz 1994] Shahbaz T., 1994, Ph.D. Thesis, University of Keele
- [Smak 1983] Smak J., 1983, ApJ, 272, 234
- [Somers, Mukai & Naylor 1996a] Somers M.W., Mukai K., Naylor T., 1996a, MNRAS, 278, 845
- [Somers et al. 1996b] Somers M.W., Lockley J.J., Naylor T., Wood J.H., 1996b, MNRAS, 280, 1277
- [Vogt 1983] Vogt N., 1983, A&A, 128, 29
- [Wade 1984] Wade R.A., 1984, MNRAS, 208, 381
- [Warner 1995] Warner B., 1995, Cataclysmic variable stars, Cambridge University Press.
- [Webb et al. 1999] Webb N.A., Naylor T., Ioannou Z., Worraker W.J., Stull J., Allan A., Fried R., James N.D, Strange D., 1999, in preparation
- [Wheatley et al. 1996] Wheatley P.J., Verbunt F., Belloni T., Watson M.G., Naylor T., Ishida M., Duck S.R., Pfeffermann E., 1996, A&A, 307, 137
- [Wlodarczyk 1986] Wlodarczyk K., 1986, Acta Astr., 36, 395
- [Wood, Horne & Vennes 1992] Wood J.H., Horne K., Vennes S., 1992, ApJ, 385, 294
- [Wood et al. 1995] Wood J.H., Naylor T., Hassall B.J.M., Ramseyer T.F., 1995, MNRAS, 273, 772
- [Young, Schneider & Shectman 1981] Young P., Schneider D.P., Shectman S.A., 1981, ApJ, 245, 1035
- [Zhang, Robinson & Nather 1986] Zhang E.H., Robinson E.L., Nather R.E., 1986, ApJ, 305, 740