Dark Matter in the Dwarf Galaxy NGC 247
Abstract
Dwarf galaxies are dominated by dark matter even in the innermost regions and, therefore, provide excellent probes for the investigation of dark halos. To that purpose, we analyse ROSAT PSPC-data of the dwarf galaxy NGC 247. We focus in particular on the diffuse X-ray emission in the keV band. Assuming an isothermal density profile, we find that the mass of the hot emitting gas is about , corresponding to of the total dynamical mass of the galaxy. The total mass of NGC 247, as derived from the X-ray data agrees quite well with the value obtained from the measured rotation curve (Burlak burlak (1996)).
The X-ray profile in the keV and keV band shows an excess at a radial distance of about arcmin from the center. Such a “hump” in the radial X-ray profile can be explained by the presence of a cluster of young low mass stars or brown dwarfs. Therefore, NGC 247 offers the possibility to observe the formation of a halo of MACHOs.
Key Words.:
Galaxies: dwarf – Galaxies: individual: NGC 247 – dark matter – X-rays: galaxies1 Introduction
Dwarf galaxies (hereafter DGs) differ from normal spiral galaxies in many of their properties. While the rotation curves of spirals tend to be flat after the central rising, rotation curves of DGs continue to rise out to the last measured point, although, recently in DDO 154 it has been observed that the rotation curve is declining in the outer parts (Carignan & Purton cap (1998)). Moreover, DGs tend to have a disk gas content (measured through the cm line) higher with respect to that of spirals. In fact, within the radius , defined to be the radius at which the surface brightness reaches arcsec-2, the ratio between the mass of the gas and the mass of the visible stars is and tends to increase to at the radius of the last HI profile point (Burlak burlak (1996)). The contribution of the dark matter in DGs within ( being the scale height of the stellar disk as obtained from surface photometry) is on average of the total mass , which is nearly a factor two greater than for normal spiral galaxies. It is interesting to note that among the 13 DGs analysed by Burlak (burlak (1996)), the 8 DGs dimmer than have on average and while the 5 DGs with absolute magnitude in the range have and . For comparison, we note that in the case of normal spiral galaxies and .
Although observations of dwarf galaxies are rather difficult, we can learn a lot from them. Dwarf galaxies are the most preferred objects for studies of the distribution of the dark matter, since the dynamical contribution of their dark halos dominates even in their central regions.
DGs have been already precious objects, since they allowed to show that their dark matter constituent cannot be hot dark matter (neutrinos) (Tremaine & Gunn trg (1979), Faber & Lin fablin (1983), Gerhard & Spergel gersp (1992)). DGs put also constraints on cold dark matter candidates (WIMPs). Recent studies seem to point out that there is a discrepancy between the computed (through N-body simulations) rotation curves for dwarf galaxies assuming an halo of cold dark matter and the measured curves (Moore moore (1994), Navarro et al. navarro (1996), Burkert & Silk burkert (1997)). Since DGs are completely dominated by dark matter on scales larger than a few kiloparsecs (Carignan & Freeman cf (1988)), one can use them to investigate the inner structure of DG dark halos with very little ambiguity about the contribution from the luminous matter and the resulting uncertainties in the disk mass/luminosity ratio (M/L). Only about a dozen rotation curves of dwarf galaxies have been measured, nevertheless a trend clearly emerges: the rotational velocities rise over most of the observed region, which spans several times the optical scale lengths, but still lies within the core radius of the mass distribution. Rotation curves of dwarf galaxies are, therefore, well described by an isothermal density law.
The diffuse X-ray emission has not yet been analysed for many DGs. Such observations yield important information about the dynamical mass distribution in elliptical galaxies. It is, therefore, natural to investigate if also DGs have a diffuse X-ray emission and if it can give us useful informations about their total mass. Of course, we are aware that this is a difficult task. Beside a proper treatment of the observational background, we must be able to disentangle the X-ray emission due to the hot halo gas from the contribution of point sources like low mass X-ray binaries or supernova remnants, which is demanding even for high mass ellipticals. In DGs the problem is even more severe, since we expect a weaker diffuse X-ray emission due to the less deep gravitational potential as compared to that of elliptical galaxies. This implies a lower diffuse gas temperature and, therefore, less emission in the X-ray band.
Five DGs have been observed in the keV band with the ROSAT PSPC. Among them, we analysed the three members of the Sculptor group NGC 247, NGC 300 and NGC 55. In this paper we present our results for NGC 247, for which we have the best data.
Unfortunately NGC 247 is not the best example of a dwarf galaxy. It has a huge gaseous disk and the dark matter begins to dominate over the stellar and gaseous disk only beyond 8 kpc (see Fig. 1 in Burlak burlak (1996)). However, its halo parameters seem to be typical for the whole class (Burlak burlak (1996)). In particular, the ratio between the halo mass and the total mass within the last measured HI profile point could be as high as , which is significantly above the value for spiral galaxies.
The paper is organised as follows: In Sects. 2 and 3 we discuss the data analysis procedure and the model assumptions. In Sect. 4 the results of the spectral analysis are shown, while in Sect. 5 we determine the mass of the X-ray emitting gas and the dynamical mass of NGC 247. We close the paper with our conclusions in Sect. 6.
2 Data Analysis
The data analysis is based upon the standard model for DGs of Burlak (burlak (1996)), which includes three components: a stellar disk, a gaseous disk and a dark halo. In addition, we consider a fourth component, the hot diffuse gas, which turns out to be not very important with respect to the total mass, but is relevant in our analysis, since it is the source of the diffuse X-ray emission. This component is assumed to form a halo around the galactic center, which can be described by a -model (Canizares et al. canizares (1987)) with central density and core radius different from the corresponding values of the dark halo hence,
| (1) |
The X-ray analysis does only depend on the model of the hot emitting gas. We will, therefore, not make any further assumptions about the remaining components. The hot, diffuse gas component is taken to be in hydrostatic equilibrium. For spherical symmetry the dynamical mass within is then given by
| (2) |
where denotes the hot gas temperature, its density, the proton mass and the mean atomic weight.
For the data analysis and reduction we follow the method proposed by Snowden & Pietsch (snowden (1995)) using Snowden’s software package especially written for the analysis of ROSAT PSPC data of extended objects and the diffuse X-ray background (Snowden & Pietsch snowden (1995), Snowden et al. contamination (1994)). The package includes routines to exposure and vignetting correct images, as well as to model and subtract to the greatest possible extent the non-cosmic background components.
For extended sources, the background can vary significantly over the region of interest, requiring an independent assessment of its distribution over the detector. Since the non-cosmic background is distributed differently across the detector than the cosmic background, the first has to be subtracted separately. Five different contamination components have been identified in the non-cosmic background of PSPC observations. For a detailed discussion we refer to Snowden et al. (contamination (1994)).
3 Observations of NGC 247
The dwarf galaxy NGC 247 is the one for which we have the best data. The ROSAT data archive contains two observations of NGC 247. The first observation was done from December , 1991 to January , 1992 with an observation time of 18240 s and the second from June to , 1992 with an observation time of 13970 s. After exclusion of the bad time intervals ( of the observation time), the non-cosmic background was subtracted following Snowden et al. (contamination (1994)). The cleaned data sets were then merged into a single one in order to increase photon count statistics. The data were then binned into concentric rings such that four rings lie within . Therefore, the thickness of each ring corresponds to arcmin. Obviously, the binning is a compromise between radial resolution and statistical errors.
| Parameter | Value |
|---|---|
| Distance | 2.53 Mpc |
| 11.2 kpc | |
| 7.87 kpc (10.69 arcmin) | |
| Column density |
3.1 Point source Detection
Since we are interested in the diffuse X-ray emission, we must eliminate all contributions due to foreground Galactic X-ray sources, and from discrete X-ray sources associated with NGC 247. We follow again the procedure outlined by Snowden & Pietsch (snowden (1995)) to remove the point sources to the faintest possible flux limit to minimize the excess fluctuations caused by them. The threshold limit we used is given in Table 2 . We carried out the point source detection separately for the 1/4 keV band and for the 0.5-2 keV band. The threshold limit guarantees that less than one spurious source will remain within the inner part of the field of view (25 arcmin) at a confidence level of about .
| Band | Threshold | Excluded Area | |
|---|---|---|---|
| 1/4 keV | 0.005 | 13.41% | 2.93 |
| 0.5-2 keV | 0.0035 | 12.92% | 2.95 |
3.2 The cleaned X-ray images
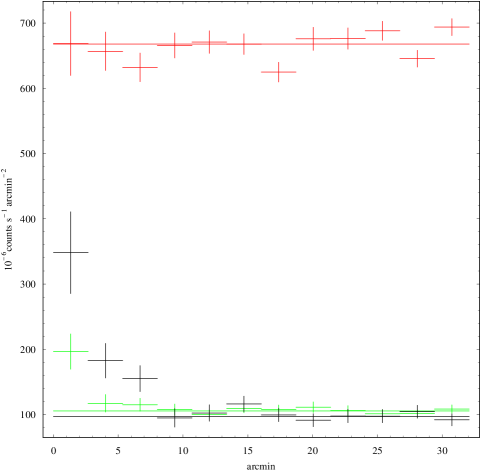
Figure 1 shows the X-ray brightness radial profiles of NGC 247 after point source removal for the 1/4 keV, 3/4 keV and the 1.5 keV band. The horizontal lines, defined by the average X-ray surface brightness between the and the ring, represent the sum of foreground and (cosmic) background diffuse X-ray emission. The X-ray image in the 1.5 keV band shows clearly that the emission originates from the disk of NGC 247, which extends to about 11 arcmin. We used elliptical rings for the 1.5 keV band, with an inclination angle of and a position angle of as derived in Carignan & Puche (Car (1990)). The distribution of the X-ray emission in the 3/4 keV band is less clearly associated with the disk. The radial profile of the 1/4 keV band is flat from the centre up to 30 arcmin. The count-rate fluctuations are partly due to the brightest undetected point sources.
Since there exists an unresolved flux originating beyond NGC 247 and the HI column density of NGC 247 is sufficiently high over most of its inner region to absorb a significant fraction of this flux, any emission from NGC 247 must at least ‘fill’ the deficit caused by the absorbed flux in order to be observed as an enhancement. Thus, even the flat distribution of the X-ray brightness profile of NGC 247 is already a clear indication for an emission from the galaxy. Hence, we must correct the surface brightness of the image for the absorption of the extragalactic flux.
Moreover, the increasing size of the HI column density towards the centre reduces the point-source detection sensitivity, and thus more undetected X-ray sources contribute to the background.
The contribution of undetected sources of the extragalactic background can be calculated using the relation
| (3) |
as derived from a deep ROSAT survey by Hasinger et al. (Has (1993)). S denotes the flux in units of . The energy spectrum of sources with fluxes in the range is given by
| (4) |
where is the energy in keV. Since the absolute normalization for the relation is still uncertain, we will use it in a way such that only the ratio is relevant.
The remaining count-rate of extragalactic sources, due to sources having fluxes below the flux detection limit (see below) is given by
| (5) |
where is the observed extragalactic count-rate in the ring of sources with a flux in the range . in units of is given by
| (6) |
with the surface of the ring and
is the observed extragalactic count-rate at position in the band, where labels the keV, keV and keV band, respectively. The column density includes both the column density of the Milky Way ( (Fabbiano et al. Fab (1992))) and the column density of NGC 247 at position , as calculated from Carignan & Puche (Car (1990)). The source detection limit of our analysis (see Table 2) is then given via the relation
| (8) |
in units of . The flux detection limit in keV is
| (9) |
Hence, using Eqs. (8) and (9) we get
in units of . The extragalactic background and Milky Way corrected count-rate in the ring is now given by
| (11) |
where the base values, defined by the outermost rings (), are treated correspondingly. is the band averaged absorption coefficient of our own Galaxy computed using a Raymond-Smith emission model (Raymond & Smith Ray (1977)) and a column density of . We assume that the halo emission is not absorbed by the disk material of NGC 247.
A detailed error calculation should include the uncertainties of the foreground column density, the column density of NGC 247, the relation, the extragalactic source spectrum, the Raymond-Smith model, including the uncertainty in the temperature and the response matrix. Since this calculation is in principle possible but sophisticated, we adopt the formal error to be two times the count-rate uncertainty hence, .
| annulus i | (1/4) | (3/4) | (1.5) |
|---|---|---|---|
| 1 | |||
| 2 | |||
| 3 | |||
| 4 | |||
| 5 | |||
| 6 |
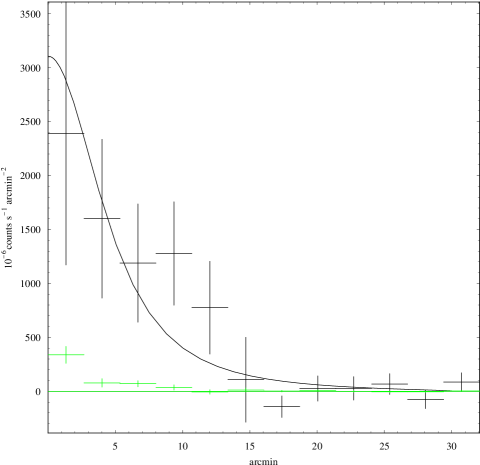
The corresponding radial profiles for the 1/4 keV and the 3/4 keV band are shown in Fig. 2 and the values are given in Table 3. For the 1.5 keV band the absorption due to gas associated with NGC 247 is negligible. Adopting the values given in Table 1 the X-ray luminosity corresponding to the observed count rates in the different bands amounts to , and in the keV, keV and keV band, respectively.
4 Spectral Analysis
The ratio of the count rates in the different energy bands contains information about the temperature of the emitting gas. Assuming a Raymond-Smith spectral model (Raymond & Smith Ray (1977)) with cosmic abundances (Allen allen (1973)), the observed ratio as derived from the count rates (Eq. (11)) must equal the theoretical count rate ratio given by:
| (12) |
For the emission below keV we obtain . The higher energy band is not included in the fit since its emission is dominated by the contribution from the disk.
The temperature obtained from the X-ray data tends to be too large due to the flux from the hotter plasma associated with the disk. The formal error is expected to be too small since at a temperature of most of the emission lies outside the ROSAT bands hence, the spectral fit has to be done using only the tail of the emission function.
Alternatively, we can use the rotation curve of NGC 247 (Burlak burlak (1996)) to obtain the temperature at the last measured HI profile point (kpc). Doing this we obtain , which is in reasonable agreement with the above value deduced from X-ray data. Both values have their own merits. Using the higher value allows to determine –within the model– the total mass and the mass of the hot gas using only X-ray data, thereby we independently check the total mass as obtained from the rotation curve. However, the error of the result is quite large. Using the lower value , obtained from the measured rotation curve, we mix the two methods and thus we can no longer compare with the HI-measurements, but the error is possibly smaller. We will give in the following all results for both temperatures and, in brackets, .
5 Mass Determination
5.1 The Hot Emitting Gas
Most of the flux originating from NGC 247 is observed in the keV band. We determine the mass of the emitting hot gas making the following assumptions: the gas temperature is about (); the spectral emissivity is given by a Raymond-Smith model and the density profile is described by a -model (see Sect. 2) with central gas density and core radius . Due to the small amount of data, we reduce the degrees of freedom by fixing . The measured radial profile in the keV band can then be used to determine the remaining two parameters and . With these values we determine the integrated gas mass within the last measured HI profile point (kpc). The results for three different values of are given in Table 4.
Read et al. (read (1997)) have analysed a sample of 17 nearby galaxies among them NGC 247. They found a hot gas mass in NGC 247 of only with the filling factor, which is nearly two order of magnitudes below the average value of their sample. Beside the different analysis technique, we believe that the main reason for the large discrepancy between their and our result is due to the different treatement of the internal absorption in NGC 247.
5.2 The Gravitating Mass
The observed photons originate from a hot gas at a temperature of K as it cools due to Bremsstrahlung, and especially in the lower temperature range more important, due to line cooling. The amount of hot gas in a DG is not large enough to have a cooling time comparable with a Hubble time, in fact for NGC 247 we expect a cooling time of about years (Read et al. read (1997)). Therefore, the gas must have been reheated either by heat sources, or e.g. by adiabatic compression as the result of a flow through the galaxy’s potential. Obviously, both effects can combine. The main heat sources for the gas are supernovae. However, the heating and cooling rates for the gas do not balance at every radius. Since the cooling rate per ion is proportional to the local electron density, cooling will generally dominate over heating at small radii, where the density is high. Thus, the gas in the central regions will steadily cool and flow into the centre of the galaxy, where it presumably forms gas clouds and stars. However, the flow velocity is usually much less than the sound speed, such that approximately hydrostatic equilibrium is maintained in the gas (Binney & Tremaine Bin (1987)).

Assuming an ideal gas in hydrostatic equilibrium, the total mass within the radius is given by Eq. (2). Using the values for the parameters and from Table 4, we can calculate the total mass of NGC 247 within kpc. The results are given in Table 4. Figure 3 shows the profile of the integrated total mass for (full lines). The dotted lines give the variation due to a error in . The three points are the values taken from Table 3 of Burlak (burlak (1996)). At kpc he finds , where we refer to his dark halo model. We see, that given the uncertainties in the data, the agreement is still reasonable within a factor of two.
6 Discussion and conclusions
We determined the mass of the hot emitting gas and the total mass of the dwarf galaxy NGC 247 using ROSAT PSPC data. From the X-ray data we obtain for the hot gas mass and for the total mass adopting , which seems to be favoured by the measured rotation curve. Unlike, as suggested by the results published so far, NGC 247 is not an exceptional object with a hot gas content about two orders of magnitude below the group average. The result obtained in this analysis agrees well with what is found for other Sculptor members. Although the quality of the X-ray data is less good as compared to e.g. elliptical galaxies, the mass determination agrees well with the value found by independent methods. The relative amount of hot gas is comparable to what one finds in more massive galaxies (DePaolis et al. strafa (1995)). For the mass to luminosity ratio as derived from the X-ray data, we obtain which agrees well with values found for other Sculptor members (Read & Pietsch rpi (1998), Schlegel et al. schl (1997)).
The hot emitting gas seems to form a halo around the galactic center which is more concentrated towards the center than the dark halo. In fact, we find a core radius of kpc for the hot gas, whereas Puche & Carignan (puche (1991)) favour an extended dark halo with a core radius of kpc. Burlak’s dark halo model (Burlak burlak (1996)) assumes a core radius of kpc. The smaller core radius of the hot gas found by the X-ray analysis could indeed indicate a flow of gas towards the center.
As one can see in Fig. 1, the brightness profile of NGC 247 in the keV and keV band shows the presence of a “hump” about arcmin from the center. Similar observations are known from M 101 and M 83. If MACHOs are low-mass stars or even brown dwarfs, we expect them to be X-ray active (De Paolis et al., dijr98 (1998)) with an X-ray luminosity of about erg/s particularly during their early stages (Neuhäuser & Comern, neuhauser (1998)). Using similar arguments as in De Paolis et al. (dijr98 (1998)), it can be shown that this “hump” could be explained by the X-ray emission of dark clusters of MACHOs, which could make up to half of the dark matter in NGC 247. Therefore, NGC 247 might offer the unique possibility to observe how a halo of MACHOs actually forms.
Acknowledgements.
The authors acknowledge helpful discussions with Alexis Finoguenov, Christine Jones, and Steve Snowden. Special thanks go to Claude Carignan for providing the NGC 247 HI-map in digital form, and to Steve Snowden for providing the detector on-axis response curves. We would like to thank the referee for his helpful and clarifying comments. This work is partially supported by the Swiss National Science Foundation.References
- (1) Allen C.W., Astrophysical Quantities, (University of London Athlone Press, 1973)
- (2) Binney J., Tremaine S., Galactic Dynamics, (Princeton University Press, 1987)
- (3) Burkert A., Silk J., 1997, ApJ 488, L55
- (4) Burlak A.N., 1996, Astronomy Reports 40, 621 (translated from Astrnomicheskii Zhurnal 73, 683)
- (5) Canizares C.R., Fabbiano C., Trinchieri C., 1987, ApJ 312, 503
- (6) Carignan C., Freeman K.C., 1988, ApJ 332, L33
- (7) Carignan C., Puche D., 1990, AJ, 100, 641
- (8) Carignan C., Purton Ch., 1998, ApJ 506, 125
- (9) De Paolis F., Ingrosso G., Strafella F., 1995, ApJ 438, 83
- (10) De Paolis F., Ingrosso G., Jetzer Ph., Roncadelli M., 1998, A&A 329, 74.
- (11) Hasinger G., Burg R., Giacconi R. et al., 1993, A&A 275, 1
- (12) Fabbiano C., Kim D.W., Trinchieri C., 1992, ApJS 80, 531
- (13) Faber S.M., Lin D.C., 1983, ApJ 266, L21
- (14) Gerhard O., Spergel D., 1992, ApJ 389, L9
- (15) Moore B., 1994, Nat 370, 629
- (16) Navarro J.F., Frenk C.S., White S.D., 1996, ApJ 462, 563
- (17) Neuhäuser R., Comern F., 1998, Sci 282, 83 (NC98)
- (18) Puche D., Carignan C., 1991, ApJ 378, 487
- (19) Raymond J.C., Smith B.W., 1977, ApJS 35, 419
- (20) Read A.M., Pietsch W., 1998, A&A 341, 8
- (21) Read A.M., Ponman T.J., Strickland D.K., 1997, MNRAS 286, 626
- (22) Schlegel E.M., Barret P., Singh K.P., 1997, AJ 113, 1296
- (23) Snowden S.L., Pietsch W., 1995, ApJ 452, 627.
- (24) Snowden S.L., McCammon D., Burrows D.N., Mendenhall J.A., 1994, ApJ 424, 715
- (25) Tremaine S., Gunn J.E., 1979, Phys Rev Lett 42, 407