11 (11.09.1 HDF 850.1, 11.09.4, 11.11.1, 11.19.6) 11institutetext: Institut de Radio Astronomie Millimétrique, Domaine Universitaire, F-38406 St. Martin d’Hères, France 22institutetext: DEMIRM, Observatoire de Paris, 61 av. de l’Observatoire, F-75014 Paris, France, and UMR 8540 du CNRS 33institutetext: Institute for Astronomy, University of Edinburgh, Royal Observatory, Blackford Hill, Edinburgh, EH9 3HJ, UK 44institutetext: Instituto Nacional de Astrofisica, Optica y Electronica (INAOE), Apartado Postal 51 y 216, 72000 Puebla, Pue., Mexico 55institutetext: Max-Planck-Institut für extraterrestrische Physik, D-85748 Garching-bei-München, Germany 66institutetext: Max-Planck-Institut für Radioastronomie, Auf dem Hügel 69, D-53121 Bonn, Germany 77institutetext: Center for Astrophysics, 60 Garden St., Cambridge, MA 02138, USA 88institutetext: Dipartimento di Astronomia, Università di Padova, vicolo dell’Osservatorio 5, I-35122 Padova, Italy 99institutetext: National Radio Astronomy Observatory, P.O. Box O, Socorro, N.M., 87801, USA 1010institutetext: Dept. of Physics and Astronomy, University College London, Gower Street, London, WC1E 6BT, UK 1111institutetext: Astrophysics Group, Imperial College London, Blackett Laboratory, Prince Consort Road, London SW7 2BZ, UK 1212institutetext: Institut d’Astrophysique, 98bis, Bd Arago, 75014, Paris, France 1313institutetext: Radio Astronomy Laboratory, University of California, Berkeley, CA94720, USA
D. Downes
Proposed identification of Hubble Deep Field submillimeter source HDF 850.1
)
Abstract
The IRAM Interferometer has been used to detect the submillimeter source HDF 850.1 found by Hughes et al. (1998) in the Hubble Deep Field. The flux density measured at 1.3 mm (236 GHz) is 2.2 mJy, in agreement with the flux density measured at the JCMT. The flux densities and upper limits measured at 3.4, 2.8, 1.3, 0.85, and 0.45 mm show that the emission comes from dust. We suggest that the 1.3 mm dust source is associated with the optical arc-like feature, 3-593.0, that has a photometric redshift . If the HDF 850.1 is at this redshift and unlensed, its spectral energy distribution, combined with that of 3-593.0, matches closely that of the ultraluminous galaxy VII Zw 31. Another possibility is that the dust source may be gravitationally lensed by the elliptical galaxy 3-586.0 at .
The position of the dust source agrees within the errors with that of the tentative VLA radio source 3651+1226.
keywords:
galaxies: structure – galaxies: individual (HDF-850.1) – cosmology – galaxies: ISM1 Introduction
Hughes et al. (1998) observed the Hubble Deep Field with the SCUBA multi-beam bolometer array at the James Clerk Maxwell Telescope (JCMT) at 850 and 450 m. Apart from HDF 850.4 (and possibly HDF 850.3) the SCUBA survey did not detect the mid-IR sources found in the Hubble Deep Field with the ISO satellite (Rowan-Robinson et al. 1997; Mann et al. 1997; Aussel et al. 1999). In general these ISOCAM detections are associated with galaxies, while the submillimeter survey appears to have revealed a higher-redshift population of dust enshrouded starburst galaxies. Further SCUBA surveys of other fields (e.g., Barger et al. 1999a,b; Eales et al. 1999; Lilly et al. 1999) indicate however that many of the sub-mm sources have redshifts smaller than 1, and that much of the star-forming activity in galaxies has occurred relatively recently, at .
| R.A. | Dec. | from | Redshift | Remark | Refs. | |
| Source | (J2000) | (J2000) | HDF850.1 | |||
| Proposed identification: | ||||||
| HDF-850.1 | 12h36m51.98 | 62 | — | — | 1.3 mm dust source | 1 |
| 3-593.0 | 12h36m51.86 | 62 | 1.73 to 1.76 | “arc 1” | 2, 6, 7 | |
| 3-593.2 | 12h36m51.94 | 62 | 1.82 | “arc 2” | 2, 6 | |
| 3651+1226 | 12h36m51.96 | 62 | — | VLA (3 cm) ? | 3 | |
| Other nearby optical sources within 3′′: | ||||||
| 3-586.0 | 12h36m52.10 | 62 | 1.0 to 1.2 | elliptical | 2, 6, 7 | |
| 3-577.0 | 12h36m52.26 | 62 | 2.88, 2.89, 3.36 ? | “counterimage” | 6, 7, 8 | |
| 3-613.0 | 12h36m52.37 | 62 | 1.64 | blue irregular | 2, 6, 7 | |
| Other nearby sources within 6′′: | ||||||
| 3-550.2 | 12h36m51.34 | 62 | 1.72 | blue irregular | 2, 6, 7 | |
| 3-633.1 | 12h36m51.60 | 62 | 1.72 | irregular ? | 2, 6, 7 | |
| 3-659.1 | 12h36m51.72 | 62 | 0.299 | Sb spiral (Cowie 1999) | 2, 6 | |
| 3651+1221 | 12h36m51.65 | 62 | — | VLA (20 cm, 3 cm) | 3 | |
| PM3_29 | 12h36m51.9 | 62 | — | ISOCAM (15 m) | 4 | |
| tentative? | 12h36m51.58 | 62 | — | 3 contour at 1.3 mm | 1 | |
| Adopted positions for phase calibrators: | Flux: | 1.3 mm 3.4 mm | ||||
| 1044+719 | 10h48m27.620 | 71 | — | 0.39 Jy 0.68 Jy | 5 | |
| 1125+596 | 11h28m13.342 | 59 | — | 0.12 Jy 0.20 Jy | 5 | |
| 1300+580 | 13h02m52.465 | 57 | — | 0.13 Jy 0.20 Jy | 5 | |
| Position refs.: (1) This paper; (2) Williams et al. (1996); (3) Richards et al. (1998); (4) Aussel et al. (1999); | ||||||
| (5) Patnaik et al. (1992). Redshift refs.: (6) Rowan-Robinson (1999); (7) Fernández-Soto et al. (1999); (8) Zepf et al. (1997) | ||||||
Richards (1999) argued against high redshifts () for the HDF sub-mm sources, from plausible associations of the SCUBA sources with nearby radio sources detected in his VLA survey at 20 cm (1.4 GHz) and the identification of some of these non-thermal radio continuum sources with optical galaxies in the Hubble Deep Field. From the radio luminosity function of starburst galaxies, Richards argued that if the submm dust sources had cm-radio detections, then they must be either star-forming galaxies or, if at higher redshift, heated by active galactic nuclei (AGN). To clarify these issues, it is important to obtain good positions for the dust sources by millimeter interferometry to examine possible coincidences with the Hubble Deep Field optical galaxies and VLA radio sources.
The strongest object in the SCUBA survey is the source HDF 850.1, which has a flux density of 7.0 mJy at 850 m. Follow-up photometry of HDF 850.1 by Hughes et al. (1998) yielded a flux density of mJy at a wavelength of 1.35 mm, confirming that the continuum is optically thin emission by dust. At longer millimeter wavelengths, the Hubble Deep Field is known to be empty of sources. With the BIMA interferometer, Wilner & Wright (1997) found no sources at 2.8 mm, to a 5-limit of 3.5 mJy. Because the 1.3 mm flux density of HDF 850.1 is close to the minimum detectable level in a 10-hr integration at this wavelength, this strongest source in the SCUBA survey may be the only source in the Hubble Deep Field that can be detected at present in reasonable observing times with millimeter interferometers. To measure more accurately the position of this source, we observed it at 1.3 mm and 3 mm with the IRAM Interferometer on Plateau de Bure, France.
2 Observations
The observations were made at 1.3 mm and 3 mm simultaneously, in the interferometer’s compact configuration D on November 17 and 22, 1998, and in the more extended configuration C2 on December 15, 16, and 17, 1998. The total integration time was about 40 hours, in excellent weather, with precipitable water vapor content 1.5 mm, and r.m.s. phase errors at 1.3 mm of . The five 15 m dishes give 10 interferometer baselines from 24 m to 80 m in configuration D, and 24 to 183 m in configuration C2. At 1.3 mm, the observing frequency was 236.3 GHz, and data were taken in upper and lower sidebands separated by 3 GHz. At 3 mm, data were taken in lower sideband only, at 2.8 mm (105.7 GHz) on November 17, and at 3.4 mm (88.7 GHz) on all the other dates. The SIS receivers had equivalent system temperatures outside the atmosphere of 150 K SSB at 3 mm, and 250 to 400 K SSB at 1.3 mm. The spectral correlators covered 954 km s-1 at 3.4 mm and 670 km s-1 at 1.3 mm, with resolutions of 8 and 4 km s-1, respectively. Flux densities were calibrated with 3C273 and MWC349, for which we adopted the following values: for 3C273, 11 Jy at 1.3 mm and 18 Jy at 3.4 mm; for MWC349, 1.7 Jy at 1.3 mm and 0.9 Jy at 3.4 mm. The systematic uncertainties in the flux scales are estimated to be % at 3.4 mm and % at 1.3 mm.
Phases were calibrated with the radio sources 1044+719, 1125+596, and 1300+580, for which we adopted the positions listed in Table 1. All three phase calibrators were observed every 20 min, at 1.3 mm and 3 mm simultaneously, and the data were phase calibrated with a weighting by the square of their signal-to-noise ratios and by the inverse square of the system temperature. To correct the amplitudes and the phases at both 3 mm and 1.3 mm for atmospheric seeing, we used the 1.3 mm continuum total power measurements to compute the changes in electrical path length due to short-term fluctuations in the atmospheric water vapour content. For the 1.3 mm data, we then adopted the phase vs. time calibration curve at 3 mm (scaled to 1.3 mm) and on top of this, solved for a second-order phase calibration curve to fit the phase residuals at 1.3 mm.

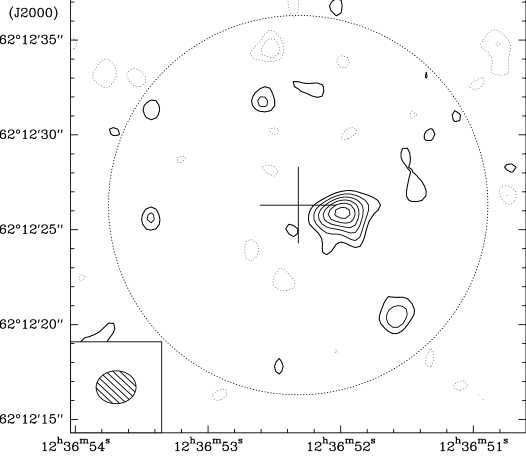
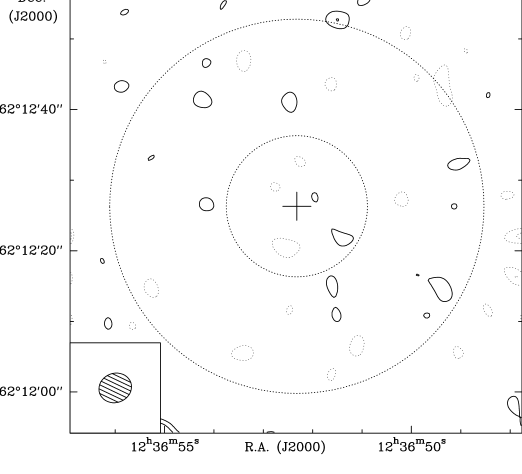
We used both uniform and natural weighting of the plane data to make maps. There is not much difference in the final result, and the maps shown here (Figs. 1 & 2) are the ones made with natural weighting. The 1.3 mm map in Fig. 1 includes all the data, in both sidebands and in the compact and extended configurations, and has been deconvolved with the CLEAN algorithm by Clark (1980), with 100 iterations.
3 Results
3.1 Detection at 1.3 mm
A continuum source was well detected at 1.3 mm (236.3 GHz), in the D configuration on November 17 and November 22 in the double sideband data, and in the upper and lower sidebands separately. All of these data subsets agree in the source position and flux density, within the errors. On the map that results from adding all the data together (Fig. 1), the flux density is mJy. This result agrees with the single-dish value of mJy measured by Hughes et al. (1998) at 1.35 mm.
The 1.3 mm source is at a position west and 0.7′′ south of the SCUBA position of the submm source HDF 850.1 found by Hughes et al. (1998). The SCUBA detection was made with the 15 m JCMT single dish, with a 14.7′′ beam at 850 m. Hughes et al. quoted r.m.s. positional uncertainties of 0.7′′ in each coordinate. The interferometer position differs from the SCUBA position at the 3.6 level, indicating that there may have been an unsuspected systematic error in the SCUBA positions, which in turn may affect some of the other submm/optical associations suggested by Hughes et al. (1998).
3.2 Size of the 1.3 mm source
The source is too weak to measure an angular size. In the maps from the longer-baseline C2 configuration alone, the flux at the source position is mJy, so the source may be partially resolved. Our fits to the data in the -plane yield a “best fit” FWHP diameter of . At the 2 level, the visibility data (Fig. 3) agree with sizes ranging from 1.7′′ to a point source. What size should we expect? Since we observe mm/submm dust radiation, the source cannot be very hot. For example, a circular source at (see below) 111We use km s-1 Mpc-1 and in this paper. with a dust temperature of 35 K, which has a dust opacity of unity at an emitted wavelength of 100m, would yield a flux of 2.2 mJy at an observed wavelength of 1.3 mm if its diameter were 0.3′′. A less opaque source would be even larger.
3.3 No detection of 3 mm continuum
No source was detected at either 2.8 mm (105.7 GHz) or at 3.4 mm (88.7 GHz), to limits of 0.5 mJy and 0.4 mJy respectively (Fig. 2). This is consistent with the 1.3 mm continuum being optically thin emission by dust. For a typical dust continuum spectral index of 3.5, the expected fluxes of HDF 850.1 would be only 0.13 mJy at 2.8 mm and 0.07 mJy at 3.4 mm.
3.4 No spectral lines detected
Although our main goal was the detection of dust emission at 1.3 mm, we chose the frequency in the upper sideband, 237.824 GHz, to coincide with the CO(9–8) line at = 3.36, the tentative redshift assigned by Zepf, Moustakas, & Davis (1997) to the optical source 3-577.0 located 1.4′′ east of the elliptical galaxy 3-586.0. No line was detected in the upper sideband, to a limit of 6 mJy beam-1 in channels 32 km s-1 wide in the velocity range 300 to +367 km s-1 relative to the frequency of the CO(9–8) line at this redshift. We also detected no line in the lower sideband, 3 GHz lower in frequency.
At 3 mm, we initially chose 105.7 GHz to search for the CO(4–3) line at = 3.36. At this frequency, no line was seen, to a limit of 2 mJy beam-1 in channels 30 km s-1 wide, in the velocity range km s-1 around the frequency of the CO(4–3) line at this redshift. Later on, we tuned the 3 mm receivers to 88.738 GHz to search for the CO(1–0) line at = 0.299, the redshift of the bright disk galaxy, 3-659.1, located 10′′ to the southwest of HDF 850.1. In velocity channels 34 km s-1 wide, no line was seen to a limit of 2 mJy beam-1, anywhere in our 53′′ primary beam, in the velocity range 450 to +460 km s-1 centered on 88.738 GHz. For a galaxy with lines km s-1 wide, this corresponds to a limit of 0.4 Jy km s-1 for the CO(1–0) line flux. For comparison, the Milky Way has a CO(1–0) line luminosity of K km s-1 pc2 inside the solar circle (Rivolo & Solomon 1988), so at , the Milky Way would have a CO(1–0) line flux of 0.05 Jy km s-1.
4 Astrometry
We estimate the r.m.s. positional uncertainty to be 0.3′′ for the centroid of the 1.3 mm dust source. This limit is set by the baseline accuracy of the interferometer, the availability of phase calibrators in this part of the sky, the signal to noise ratio, and the seeing. Thus far, the best astrometry done with the interferometer was for the source W3(OH), with phases calibrated on the quasar 0224+671, located 5∘ away. In those projects (Wink et al. 1994; Wyrowski et al. 1997; 1999), the global statistical positional repeatability was 0.05′′ r.m.s., including the systematic errors in the baseline geometry. To this must be added the uncertainty in the Jodrell Bank–VLA position of the calibrator source. For the current Hubble Deep Field project, our strongest calibrator is 14∘ away (Table 1), so the r.m.s. error in position would be three times worse, namely , also with Jodrell Bank-VLA calibrator uncertainties of 0.01′′ (Patnaik et al. 1992).
To reduce errors, we chose the three phase calibrators at earlier and later right ascensions, and lower and higher declinations than the Hubble Deep Field (Table 1). This should formally reduce the noise in the baseline errors and in our weighted average of calibrators by a factor to . To check internal consistency of the reduction software, we made maps of the calibrator sources, and on the maps, the position errors were . The uncertainties in their measured cm-radio positions from the Jodrell-VLA survey are ten times lower (Table 1). Two of the calibrators are weak, Jy at 1.3 mm, but their signal-to-noise ratio is quite satisfactory at 3 mm. Because we subtract the scaled 3 mm phase fluctuations from those at 1.3 mm, we can improve the fit of the phase solution at 1.3 mm, but there remains a residual instrumental phase error, which brings the astrometric part of the position error to 0.2′′ r.m.s.
In addition to the astrometric error, there is a statistical error related to the signal-to-noise ratio. For a point source, this position error due to noise is
| (1) |
where is the synthesized beam, and is the signal-to-noise ratio. For our map in configurations D + C2, the beam is , and the signal-to-noise ratio is = 7, so the position error due to noise is r.m.s. The convolution of the astrometric error (0.2′′), and the noise error (0.2′′) then gives a root sum square error of 0.3′′.
5 Source Identification
The identification of the 1.3 mm dust source with an optical galaxy or a cm-radio source in the Hubble Deep Field depends strongly on the accuracy of the measured positions. The radio-optical registration of the Hubble Deep Field is described by Williams et al. (1996). Their estimated accuracy of this absolute registration is 0.4′′. The estimated accuracy of the 1.3 mm IRAM position is 0.3′′.
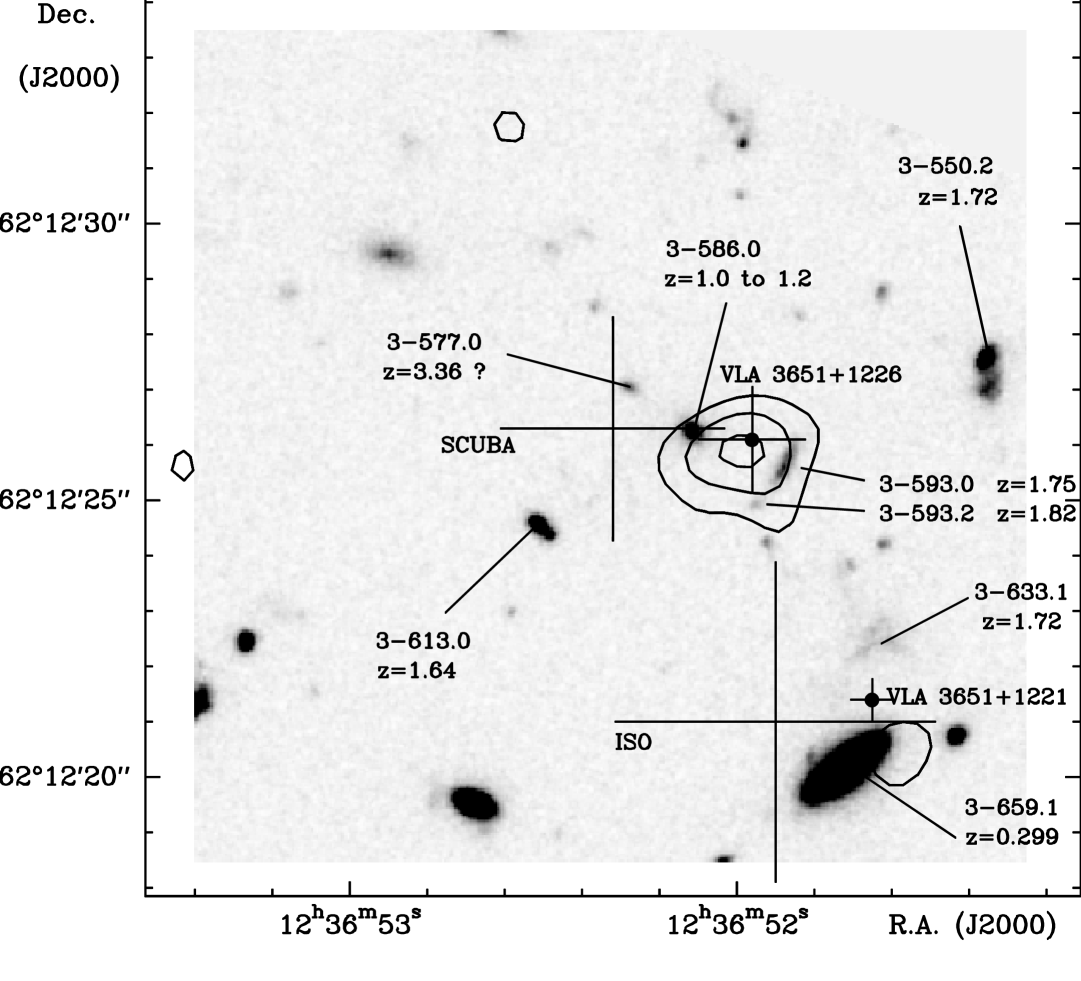
Radio: The new 1.3 mm position clearly rules out the identification with the optical source 3-577.0 proposed by Hughes et al. (1998) from the SCUBA data. It also rules out the identification, suggested by Richards (1999), of the 1.3 mm dust source with the VLA source, 3651+1221, located 4.9 to the southwest (see further discussion of this source in the Appendix). The 1.3 mm dust source coincides with the tentative VLA source 3651+1226, which is a detection at 3 cm (Richards et al. 1998).
Optical: On the Hubble Deep Field image (Fig. 4), the closest object to the 1.3 mm dust source is the arc-like feature comprising the optical sources 3-593.0 and 3-593.2. From the optical coordinates published by Williams et al. (1996), this arc-like feature is 0.8 southwest of the 1.3 mm dust source, where the error is the sum of the optical and 1.3 mm position errors (Table 1). We must take the sum of the errors rather than the root sum square because the radio-optical registration uncertainty is a systematic error rather than a random error.

The Elliptical: The next nearest optical object is the source 3-586.0, located 1.0 east of the 1.3 mm dust source. The optical source 3-586.0 is an elliptical galaxy at a photometric redshift of (Hogg et al. 1996; Lanzetta et al. 1996 (their source number 3-306); Mobasher et al. 1996; Gwyn & Hartwick 1996; Sawicki et al. 1997; Wang et al. 1998; Fernández-Soto et al. 1999 — their source 303). The optical photometry of this elliptical galaxy is tabulated by Fasano et al. (1998), and its spectral energy distribution (SED) is given by Cowie (1999). The spectrum rises from the optical regime to a maximum near 2 m, where it flattens out at a level of Jy, consistent with the non-detection at a level of 23 Jy at 15 m (Oliver et al, in prep., reported by Hughes et al. 1998; Aussel et al. 1999).
From the position alone, the dust source could be the arc-like feature or the elliptical. We argue, however, that the 1.3 mm dust source is probably associated with the arc-like feature. Although we cannot associate the dust source with this optical object from the astrometry, we now present several physical arguments that support this association and disfavor the elliptical.
5.1 Dust flux ratios, dust temperature, and gas mass
The source HDF 850.1 is not detected at 450 m to a limit of 21 mJy (Hughes et al. 1998), nor is it in the IRAS Faint Source Catalog, nor in the ISO images of the Hubble Deep Field at 6.7 m and 15 m (Aussel et al. 1999). We thus have a limit on the 450 m to 1300 m flux ratio, where the emission is optically thin (the spectral index is ). This ratio is m)/m) 10. Let the corresponding observed frequencies (667 and 236 GHz) be and , respectively. Because the shape of the Planck function is preserved with redshift, the ratio is the same at the emitted frequencies, namely
| (2) |
where is the dust temperature and is the dust optical depth. Experience in millimeter detection of dust at high redshifts during the past decade shows that sources are only detected when they contain large amounts of dust ( M⊙) — as in the IR ultraluminous galaxies which have dust opacities equal to unity near a wavelength of 100 m (e.g., Downes, Solomon, & Radford 1993). At this wavelength (frequency 3 THz), one may approximate the dust opacity as , where is the emitted frequency in THz, and is the dust emissivity index, where to 2. Regardless of whether the dust is optically thick or thin, however, at “low” redshifts (), the ratio in eq.(2) can be as low as the observed value of only with dust temperatures K. (Fig. 5).
From the mere detection of dust at 1.3 mm with a flux density of 2.2 mJy, we can make a useful deduction about the gas mass from the formula (cf. Downes et al. 1992)
| (3) |
where is the gas mass, is the flux density, is the luminosity distance, is the dust temperature, is the emitted frequency, and is the dust emissivity index, which we adopt to be . The main assumption is that the emission comes from optically thin dust. The equation is for a dust mass absorption coefficient of 0.11 m2 kg-1 of dust at an emitted wavelength of 1.3 mm, as in dense molecular clouds (e.g., Krügel & Siebenmorgen 1994, their Fig. 12), and a gas-to-dust mass ratio of 100. The uncertainties are about a factor of three in each direction — higher and lower (for an analysis, see Hughes, Dunlop, & Rawlings 1997). Higher gas-to-dust ratios mean even larger gas masses.
To have a flux density of 2 mJy at 1.3 mm with the low dust temperature derived above, a “low”-redshift () source would need a very high molecular gas mass, approaching M⊙. Lower dust temperatures or less opaque dust or higher gas-to-dust ratios would all imply even higher gas masses. Such an enormous quantity of dust and molecular gas would have dramatic consequences for star formation, and such a large, gas-rich galaxy at low redshift would have been easily seen on the HDF images or in the follow-up optical spectroscopy of these sources (e.g. Zepf et al. 1997). For comparison, a large galaxy like NGC 891, at a distance of 10 Mpc, has a total 1.3 mm dust continuum flux of 730 mJy, corresponding to a molecular gas mass of M⊙ (Guélin et al. 1993), about the same as that of the Milky Way. If NGC 891 or the Milky Way were moved to , at an emission distance (angular size distance) of 1.75 Gpc, then the 1.3 mm observed flux would be only 36 Jy, that is, 60 times lower than the dust flux we detect.
At higher redshifts, the observed limit on the 450 m to 1300 m flux ratio allows the dust temperature to be higher. For example, at , the dust temperature can be 60 K, comparable with the blackbody dust temperatures deduced for IR ultraluminous galaxies from their IRAS fluxes (e.g. Downes & Solomon 1998). The corresponding molecular gas masses deduced from the observed 1.3 mm flux also become plausible — a few M⊙, even in the absence of gravitational magnification. Because the line of sight to the source passes so close to the elliptical — a good gravitational lens— the observed mm and submm fluxes may be gravitationally magnified, and the real gas mass even lower.
In summary, our argument, based on the mm and submm fluxes alone, that the dust source cannot be a “low” redshift () object, is as follows: a) the optical depth is not high; b) the observed flux ratio may be obtained at low redshift only if the dust temperature is sufficiently low ( K), and c) the observed flux plus a low temperature requires an excessive gas mass.
5.2 Other arguments against identifying HDF 850.1 with the elliptical galaxy 3-586.0
A number of other facts argue against the optical source 3-586.0, an elliptical galaxy at , being the optical object associated with the 1.3 mm dust source.
1) The gas and dust masses of ellipticals are generally too low for 1.3 mm dust detections ( M⊙). Even in nearby ellipticals, there are very few detections (see, e.g., the review by Knapp 1999). The three galaxies with dust detections reported by Wiklind & Henkel (1995) have gas masses ranging from to M⊙. The much larger dust and gas mass predicted by the physical arguments in the previous section would be totally inconsistent with the gas content of an elliptical galaxy like 3-586.0. Such galaxies typically have a total dynamical mass (mostly stars) of M⊙ within a radius of 1 kpc, and, with a de Vaucouleurs profile, enclose a total mass of M⊙ at a radius of 7 kpc ( 0.85′′ at ). This argument from the dust and gas mass needed to yield 2 mJy at 1.3 mm is equivalent to the empirical luminosity argument by Hughes et al. (1998) — that the mm/sub-mm luminosity of the source HDF 850.1 is two orders of magnitude too high to be emission by dust in the elliptical galaxy 3-586.0. Therefore the dust source cannot be the elliptical galaxy.
2) Dust has not yet been detected at 1.3 mm in any “normal ” galaxy at . The reasons are firstly, that the redshift is not high enough to shift warm dust emission into the millimeter band, and secondly, that the emission distance (angular size distance) is close to its maximum. A striking exception is the extremely red, galaxy HR 10 (or ERO J164502+4626.4), for which Cimatti et al. (1998) and Dey et al. (1999) find mm/submm dust fluxes corresponding to an astonishing far-IR luminosity of L⊙, a molecular gas mass of M⊙, and an apparent star formation rate of 1000 to 2000 M⊙ yr-1. It will be important to investigate whether this object is gravitationally lensed or not.
3) We argued above that if the object is at , the dust must be cold. So far, however, the mm detections of dust in high- objects are mainly of “warm” dust ( K), probably circumnuclear regions heated by an AGN and/or a nuclear starburst. Therefore it is most unlikely that we are detecting the elliptical at .
6 Discussion
6.1 The dust source HDF850.1 as an unlensed source
Hughes et al. (1998) gave a very plausible interpretation of HDF850.1 as a high-redshift starburst galaxy, similar to the ultraluminous infrared galaxies at . As discussed above, from the interferometer position measurement and the physical arguments about the gas mass, it is likely that the dust source HDF850.1 is associated with the optical arc-like feature 3-593.0/593.2. The photometric redshift estimates of the arc are (Rowan-Robinson 1999) and (Fernández-Soto et al. 1999). In this part of the sky there seems to be a cluster or a group of galaxies at photometric redshifts (the objects 3-593.0, 3-633.1, 3-550.2, and 3-613.0). It is conceivable that the dust source is at this redshift as well, and that it is part of the same object as the optical arc-like feature. Such a redshift for HDF850.1 would be well within the redshift distribution of the identified sources detected so far with the SCUBA array in other fields (e.g., Barger et al. 1999a,b; Eales et al. 1999; Lilly et al. 1999).
No optical lines were detected in the arc by Zepf et al. (1997). Why not? A simple explanation is that the object is at , consistent with the photometric redshifts, so that no strong lines are shifted into the optical. As shown by the data of Zepf et al. (1997), the arc 3-593.0 is not likely to be at , because it is too blue — it shows up nicely in the HST F450W band, and it has significant flux in the F300W band. It is not a “U-band dropout”, that is, the hydrogen along the line of sight does not greatly decrease the flux in the F300W band, as it would if the object were at , again consistent with the photometric redshift of . The arc is much bluer than, for example, the object 3-577.0, which has a photometric redshift of 2.88 (see, e.g, the colors tabulated in Zepf et al. 1997).

In fact, the data on HDF 850.1, if combined with the optical fluxes of the optical arc-like feature 3-593.0 and a redshift of 1.7, agree rather well with the spectral energy distribution of the ultraluminous infrared galaxy VII Zwicky 31. This object, which was interpreted by Djorgovski et al. (1990) as a merger-induced starburst galaxy, was recently selected for study with the HST by Trentham, Kormendy, & Sanders (1999) because its “cool” spectral energy distribution indicates it is an ultraluminous galaxy that derives its IR luminosity from an embedded starburst only, with no “warm” AGN component. Figure 6 shows this comparison with VII Zw 31, if HDF 850.1 is associated with the optical object 3-593.0, that has a photometric redshift of . For VII Zw 31, we took the IRAS and HST data from Trentham et al. (1999), re-scaled for km s-1 Mpc-1. The luminosities of the far-IR peak of HDF 850.1 and the optical emission of 3-593.0, calculated for , correspond quite well to the observed luminosity of VII Zw 31. The solid curve in Fig. 6 shows the predicted spectrum of the cool dust component from the radiative-transfer model for VII Zw 31 by Downes & Solomon (1998). In that model, the dust temperature varies with galactocentric radius. The denser dust that is opaque at 100 m has a temperature of 50 K. The millimeter dust emission is transparent over the full extent of the source, for which the global spatial average of the dust temperature is K.
There is also a good agreement in the size of 3-593.0 and the dust region in VII Zw 31. On the Hubble Deep Field image, the bright part of 3-593.0 has a radius of 0.22′′, or kpc at . The total emission along the arclike feature, including the faint optical object 3-593.2, has an radius of 0.67′′, or 5.6 kpc. In VII Zw 31, the relevant dimensions are nearly the same. The half-power radius of the rotating molecular gas disk in VII Zw 31 is 1.7 kpc, with an outer radius of 5 kpc (Downes & Solomon 1998), and the ring of star-forming knots in VII Zw 31 has a radius of 3.4 kpc (Mazzarella et al. 1999; image in Trentham et al. 1999). This good match to the star-forming region of VII Zw 31 in both size and spectral energy distribution, if HDF 850.1 is at and associated with 3-593.0, suggests a plausible interpretation of HDF 850.1 as an ultraluminous IR galaxy with the same intrinsic 8 m to 1000 m luminosity as VII Zw 31, namely, = L⊙.
Although the best-fit photometric redshift for the optical arc-like feature 3-593.0 is with an Scd galaxy template at = 1.73 to 1.76 (Fernández-Soto et al. 1999; Rowan-Robinson 1999), the redshift likelihood function does have a much smaller alias as a starburst galaxy at = 2.6 (Fernández-Soto, private communication) to 3.0 (Rowan-Robinson 1999). The fit is not as good as for = 1.73, in particular for the -magnitude, but it is not implausible. This is in fact the case discussed by Hughes et al. (1998; see their Fig. 5). The spectral energy distribution would still match that of VII Zw 31, as in Fig. 6, scaled up by a factor of 3.6 (to correct for the greater luminosity distance), except in the optical range, where the arc source 3-593.0 would then be much more blue than VII Zw 31. A better fit for both HDF 850.1 and 3-593.0 would be obtained with the other two sources measured by Trentham et al. (1999), namely, IRAS 12112+0305 and IRAS F224911808. Because of the greater luminosity distance at , the 8 m to 1000 m luminosity would have to be = L⊙, which would place HDF 850.1 among the most powerful of the ultraluminous galaxies, like Mrk 231 (see, e.g., the sample of Sanders et al. 1988).
In summary, the arguments in favor of the interpretation as an unlensed source at are the fairly good match in both size and spectral energy distribution with VII Zw 31, the better fit of the optical template with a photometric redshift of 1.7 for 3-593.0, the absence of any strong lines in the optical spectrum, which is better understood if , the apparent cluster of objects in the range 1.6 to 1.8 in this region, the blue color of the arc, and the fact that the total luminosity of L⊙ is not exceptional in the class of ultraluminous galaxies, consistent with the absence of any indication of an embedded optical quasar or Seyfert 1 nucleus (see, e.g., Kim & Sanders 1998; Solomon et al. 1997).
The arguments in favor of an interpretation as an unlensed source at have been given by Hughes et al. (1998) and Carilli & Yun (1999). To these arguments we may add the poorer-fitting alias for a photometric redshift of 2.6 or 3.0. The consequence is that the IR luminosity would place the source among the most powerful of the ultraluminous galaxies, those containing a quasar or a Seyfert 1 nucleus. These objects are fairly rare in the existing samples of ultraluminous galaxies (see the luminosity histogram of Kim & Sanders 1998; their Fig. 3), and usually have a small, bright, symmetric nucleus resembling a reddened QSO (Surace et al. 1998). There is no evidence for such a bright QSO-like nucleus in the optical image of 3-593.0, which instead looks like a star-forming region extended over several kpc.
6.2 The dust source HDF850.1 as a lensed source
Another possibility is that HDF 850.1 is a lensed source. The relative abundance of lensed sources in the submm is expected to be large, because the submm flux density-redshift relations of distant, dusty, star-forming galaxies are flat, leading to a larger fraction of brighter images in the submm relative to the optical (Blain 1997). The fraction of gravitationally lensed sources at the 10 mJy level at 850 m is (Blain 1998, his Fig. 4; Blain et al. 1999), orders of magnitude greater than for the corresponding optical sources. There is therefore a good chance that we are detecting a lensed source, especially if the line of sight is close to an elliptical galaxy.
Hogg et al. (1996) originally proposed that the arc-like feature 3-593.0 was a source gravitationally lensed by the elliptical galaxy at because of the 1.8′′ separation of the arc from the elliptical 3-586, the mass of the elliptical as deduced from its luminosity, the appearance of the arc, concave toward the elliptical, and the fact that other gravitational lenses tend to be ellipticals. It is possible that the dust source is part of the same object as the optical arc-like feature. and lies near a high-magnification point of the lens.
The non-detection of optical lines in the arc is consistent with (S. Zepf, private communication and Zepf et al. 1997). The low end of this range is close to the redshift of the elliptical, giving an unfavorable geometry for lensing. The high end of the range, however, yields nearly the same geometry as for IRAS F10214+4724, where the elliptical is at and the source is at . If the optical arc-like feature is at its photometric redshift (), then the arc source and the elliptical are in a favorable configuration for lensing. The approximate radius of the circle of images may be roughly estimated from the standard formula for the Einstein radius for an isothermal, spherical lens
| (4) |
(e.g., Peacock 1999, his eq. 4.14), where is the line of sight velocity dispersion of the lens in km s-1, and and are the angular size distances from the lens to the source and from the observer to the source respectively.
| ————— Elliptical galaxy ————— | ————— Lensed feature ————— | ||||||||
| Lens | Source | crit.curve | opt./UV | ||||||
| Source | redshift | total | total | redshift | radii | total | magnifi- | ||
| (mag) | (mag) | (mag) | (km s-1) | (arcsec) | (mag) | cation | |||
| HDF 850.1 system: | |||||||||
| HDF 3-586.0/3-593.0 | 1.0 | — | 23.3 | 19.5 | 1.61 | 26.1 | — | ||
| Other lenses: | |||||||||
| IRAS F10214+4724 | 0.9 | 22.8 | 20.3 | 18.5 | 270 | 2.286 | 1.2 | 20.44 | |
| HST 14176+5226 | 0.81 | — | 19.7 | — | 260 | 3.4 | 25.8 | — | |
| Cloverleaf | ? | 2.558 | 0.7 | 17.5 | 18 to 30 | ||||
| HDF 3-586.0/3-593.0 data from Cowie (1999); lens model from Hogg et al. (1996). | |||||||||
| IRAS F10214+4724 data and lens model from Eisenhardt et al. (1996); IR data from Evans et al. (1999). | |||||||||
| HST 14176+5226 data from Ratnatunga et al. (1995); Crampton et al. (1996); lens model from Hjorth & Kneib (1999). | |||||||||
| Cloverleaf data and lens model from Kneib et al. (1998a; 1998b), Turnshek et al. (1997), and Chae & Turnshek (1999). | |||||||||
In the lower-mass, isothermal, elliptical-potential model of Hogg et al. (1996), where only 3-593.0 and 3.577.0 were a candidate lensed pair, the optical arc was close to the critical radius of 1.6′′, from which they derived a velocity dispersion of km s-1 if the elliptical galaxy is at . If the dust source is at , and is a lensed image 0.8′′ from the elliptical, then the very rough estimate from eq.(4) also yields a velocity dispersion of km s-1. Hogg et al. (1996) tried to explain not only the apparent arc 3-593.0, concave toward the elliptical, but also the object 3-577.0 as its counterimage, elongated toward the elliptical. The observations of Zepf et al. (1997) made this candidate counterimage unlikely, however, because of the tentative detection of a Ly line at in 3-577.0, and the different colors in the arc and the “counterimage” (the arc is bluer than its candidate “counterimage”; for an alternative interpretation, see Dickinson 1998).
How could the HDF 850.1 dust source and the optical arc-like feature be at different positions? There are several ways this could happen. In the source that is lensed, the dust emission may not be in the same place as the UV/optical emission. The dust source and the optical arc could be different parts of the same galaxy, or a merger of two galaxies, with their light paths deflected to different spots by the elliptical. They would intersect the elliptical’s cusp and fold caustics differently, and have different magnifications, and different image shapes on the sky. If the source is at and lensed, its luminosity would still be that of a starburst galaxy. These objects are often highly distorted, with double nuclei, or multiple knots of emission — good candidates to yield non-coincident optical and mm/submm images if gravitationally lensed.
Non-coincident images in different wavebands can be expected quite naturally, as shown by the comparison with other lensed sources in the next section.
6.3 Comparison with other lensed systems
More than half of the high-redshift objects in which dust and/or CO has been detected at 1.3 mm are known to be gravitationally lensed, with magnification factors for the mm dust emission in some of the sources (e.g. IRAS F10214+4724, the Cloverleaf quasar, APM 08279+5255, MG 0414+0534, and very likely BR 120207). Other submm-selected sources are also lensed, with lower amplification factors (e.g., SMM J02399-0136 and SMM J14011+0252: Ivison et al. 1998; Frayer et al. 1998; 1999).
Table 2 compares the lower-mass model for the elliptical 3-586.0 from Hogg et al. (1996) with similar models for IRAS F10214+4724, HST 14176+5226, and the Cloverleaf quasar, in which the lensing elliptical galaxies are at comparable redshifts. An important point in these examples is that a gravitational lens can image different parts of a source to different spots on the sky in different wavebands.
In IRAS F10214+4724, the combination of an elliptical at and a source at gives strong magnification with a 1.18′′ asymptotic critical radius for the UV light redshifted to the optical. The optical arc in 10214+4724 contains two peaks. In the model of Eisenhardt et al. (1996), the brighter east peak is interpreted as the blending of two images merging on the critical curve, while the west peak is interpreted as the third image. A possible analogy in the HDF 850.1 system might be the brighter optical source 3-593.0 as the two-image blend, and the weaker peak 3-593.2 as the third image. The 10214+4724 counterimage is 100 times fainter than the main arc, and has not been detected in the cm-radio or mm-dust emission. The models by Eisenhardt et al. (1996) for 10214+4724 predict a 0.4′′ radial displacement in the -band arc, due to the larger source region at longer wavelengths. They note that an 0.5′′ infrared source would be imaged into an elliptical ring with a position angle perpendicular to that of the optical arc, with the center of the ring offset from the elliptical. In fact, the HST NICMOS observations of 10214+4724 by Evans et al. (1999) show that the peak position of the arc changes even between wavelengths of 1.1 and 2.1 m.
In HST 14176+5226, the lens redshift, total magnitude of the elliptical galaxy in the HST F814W band, and calculated line-of-sight velocity dispersion of the elliptical are very similar to those of the elliptical that lenses IRAS F10214+4724. In the detailed model by Hjorth & Kneib (1999) for the lensing of HST 14176+5226, the magnified images in the Einstein cross configuration actually lie outside the critical line, which is an elongated ellipse.
In the Cloverleaf quasar, the lensing galaxy has recently been detected in NICMOS images (Kneib et al. 1998b), and may belong to a galaxy cluster or group at . The lensing effect may be due to a combination of the elliptical and the galaxy group. The different source size in different spectral regions leads to quite different images. In the Cloverleaf, the four optical images are circular spots, while the four millimeter sources are arcs (Kneib et al. 1998a).
6.4 Possible identification of the dust source with the tentative VLA source 3651+1226 and implications from the radio-FIR relation
From the positions in Table 1 and Fig. 4, the 1.3 mm dust source appears to coincide with the weak VLA radio source 3651+1226, listed in the Supplementary Catalogue of Richards et al. (1998; their Table 5). At a wavelength of 3.5 cm, this 4.5 source has a (revised) sky flux density of Jy (E. Richards, private communication). From the map by Richards (1999) one may set a 3 upper limit of 23 Jy at 20 cm. The dust emission extrapolated from the 2 mJy measured at 1.3 mm, would yield only 0.02 Jy at 3.5 cm, so the cm-radio source must be mainly synchrotron emission, not dust. Using this VLA source in relation with the cm-radio-to-far-IR correlation in low-redshift star-forming galaxies, Carilli & Yun (1999) concluded that HDF 850.1 could be at a redshift , because the 350/1.4 GHz index is .
With regard to this submm-to-radio ratio, it is instructive to compare the observed flux density of HDF 850.1 with that expected from the ultraluminous IR galaxy Arp 220, if the latter were at high redshift. The result is shown in Table 3, which indicates that Arp 220 could not be detected much beyond at 20 cm, even with deep integrations with the VLA, a fact stressed by Richards (1999). An unlensed Arp 220 would not be detectable with the IRAM interferometer at 1.3 mm to the detection limits reported in this paper, in the range . It would also be 3.5 to 6 times weaker at 850 m than the flux observed by Hughes et al. (1998) for HDF 850.1. Nor would it have been detected by the ISOCAM instrument at 15 m, in the same range of redshift.
| Arp 220 expected flux at wavelength: | ||||
| VLA | IRAM | SCUBA | ISOCAM | |
| Redshift | 20 cm | 1.3 mm | 850 m | 15 m |
| (Jy) | (mJy) | (mJy) | (Jy) | |
| 0.01818 | 180 | 800 | ||
| 1.7 | 37 | 0.3 | 1.2 | 18 |
| 3.0 | 14 | 0.5 | 2.0 | 1.7 |
| 4.0 | 8 | 0.8 | 2.1 | 0.8 |
| HDF 850.1 | ||||
| observed | 23 | 2.2 | 7.0 | 23 |
| Values are scaled to Arp 220’s observed spectrum: | ||||
| radio: Sopp & Alexander (1991), | ||||
| millimeter: Downes & Solomon (1998), | ||||
| far-IR: Rigopoulou et al. (1996); Fischer et al. (1998); | ||||
| Klaas et al. (1997), near-IR: Soifer et al. (1999). | ||||
As noted by Carilli & Yun (1999), however, the submm-to-radio index has a large scatter, so it should be regarded more as a redshift indicator rather than a redshift estimator in the sense of the optical photometric redshifts. In particular, for the high- dust sources detected to date, there is not only a large scatter in the 350/1.4 GHz index, but also possible contamination of the radio flux by emission from an AGN, and modification of the ratio due to differential magnification effects of gravitational lensing. For example, IRAS F10214+4724, at , has an index = 0.7, and APM 08279+5255, at higher redshift () has nearly the same index, = 0.8. Both of these indices would be compatible with , given the scatter in the index data.
7 Conclusions
1) The IRAM interferometer has detected the source HDF 850.1, the strongest source in the submm survey of the Hubble Deep Field by Hughes et al. (1998). We measure a flux of mJy, in agreement with the flux density measured at 1.35 mm at the James Clerk Maxwell Telescope. The 1.3 mm flux, together with our non-detections at 2.8 and 3.4 mm, and the SCUBA flux at 850 m, are all consistent with the interpretation by Hughes et al. (1998) that the radiation is optically thin emission by dust.
2) The improved position from the interferometer shows the dust source cannot be the optical source 3-577.0, as suggested by Hughes et al. (1998). The measured position also rules out the galaxy 3-659.1 and the low surface brightness galaxy 3-633.1 at suggested by Richards (1999) as an indentification for HDF 850.1. The dust source may coincide with the tentative VLA source 3651+1226.
3) The dust source may be associated with the optical arc-like feature 3-593.0/3-593.2, located 1.8′′ to the southwest of the elliptical galaxy 3-586.0. The arguments in favor of this interpretation are the separation of the dust source and 3-593 on the sky and the temperature-mass argument developed in the text, which disfavors an association of the dust source with the elliptical. If HDF 850.1 is at , the photometric redshift of the optical source, then it could be an unlensed galaxy with a spectral energy distribution and linear dimensions that are similar to those of the ultraluminous starburst galaxy VII Zw 31. Hence, if at and unlensed, HDF 850.1 must be an ultraluminous IR galaxy, with an IR luminosity of = L⊙.
4) Because of the close proximity on the sky of the elliptical 3-586.0, the dust source HDF 850.1 may be gravitationally lensed. The arguments in favor of this interpretation are the arclike morphology of the optical source that suggests a gravitational mirage; the similarity of the properties of the elliptical galaxy to the ones responsible for the lensing in IRAS F10214+4724, HST 14176+5226, and the Cloverleaf; and the fact that many of the other high-redshift objects detected to date at mm/sub-mm wavelengths in dust and CO are magnified by gravitational lensing. The arguments against this interpretation are that the arc morphology is not conclusive, and that the candidate counterimage, 3-577.0, has a different color, and apparently a different redshift.
The discussion in this paper illustrates the absolute necessity of sensitive millimeter/submillimeter interferometers for identifying sources of dust emission with cosmologically distant optical galaxies. The next step in this direction is the construction of a mm/submm interferometer with more than an order of magnitude greater sensitivity than presently available.
Acknowledgements.
We thank the operators on Plateau de Bure for their help in observing, M. Bremer (IRAM) for some of the image processing, and H. Aussel (CEA-Saclay), M. Dickinson (STSci), A. Fernández-Soto (Univ. New South Wales), J.-P. Kneib (Obs. Midi-Pyrénées), E. Richards (Univ. Virginia), P.A. Shaver (ESO), and S. Zepf (Yale Univ.) for very useful comments. We also thank the referee, A. Omont, for his helpful suggestions on improving the paper.Appendix: The cm-radio source 3651+1221
Richards et al. (1998) tentatively associated the VLA source 3651+1221 with the galaxy 3-659.1 (cf. Fig. 4). This galaxy may also be the 15 m source HDF_PM3_29 detected with ISOCAM (Aussel et al. 1999). Richards (1999) showed however that the radio emission is confined to the faint emission north of the spiral, about south of the optical object 3-633.1, which has a photometric redshift of 1.72 (Fernández-Soto et al. 1999). Since then, this optical object has been detected in and bands, having colors consistent with a high- galaxy (Dickinson 1998). Richards (1999) noted that if the radio source is at , the implied radio luminosity is substantially higher than that of the most extreme local starbursts like Arp 220, which suggests the radio source may be an AGN.
There is a 3-sigma contour near the spiral galaxy on the IRAM 1.3 mm map (Fig. 4), which we list in Table 1 as a questionable source. The 1.3 mm position is 1′′ south of the VLA source. The apparent 1.3 mm flux density is 0.75 mJy, but this would have to be corrected for the primary beam attenuation to mJy if the source were real. In this case, the emission could not be the extrapolation of the synchrotron spectrum from centimeter wavelengths, because the flux density at 3.4 cm is only 16 Jy (Richards et al. 1998). Could it be dust emission from the spiral? The problem with dust emission at low redshifts () is that most of the energy is at shorter wavelengths, not redshifted into the mm /submm bands. The dust in the central parts of the Milky Way, or in NGC 891, corresponding to a molecular gas mass of M⊙, would yield a 1.3 mm flux of only 68 Jy at , or times lower than the apparent flux on the 1.3 mm map. The apparent 3 signal would thus have to come from an extremely gas-rich galaxy, which is not in any way indicated by the HST optical image of this relatively nearby object. Since there is also a 3 negative peak at a similar radius from the center of the primary beam (Fig. 1), the apparent 3 positive signal may not be real.
References
- [] Aussel, H., Cesarsky, C.J., Elbaz, D., & Starck, J.L. 1999, A&A, 342, 313
- [] Barger, A.J., Cowie, L.L., & Sanders, D.B. 1999a, ApJ, 518, (June 10) in press
- [] Barger, A.J., Cowie, L.L., Smail, I., Ivison, R.J., Blain, A.W., & Kneib, J.-P. 1999b, AJ, (June 1999) in press (astro-ph/9903142)
- [] Blain, A.W. 1997, MNRAS, 290, 553
- [] Blain, A.W. 1998, MNRAS, 295, 92
- [] Blain, A.W., Kneib, J.-P., Ivison, R.J., & Smail, I. 1999, ApJ, 512, L87
- [] Carilli, C.L., & Yun, M.S. 1999, ApJ, 513, L13
- [] Chae, K.-H., & Turnshek, D.A. 1999, ApJ, 514, 587
- [] Cimatti, A., Andreani, P., Röttgering, H., & Tilanus, R. 1998, Nature, 392, 895
- [] Clark, B.G. 1980, A&A, 89, 377
- [] Condon, J.J., Helou, G., Sanders, D.B., & Soifer, B.T. 1996, ApJS, 103, 81
- [] Cowie, L. 1999, http://www.ifa.hawaii.edu/cowie/tts /hdf42.html
- [] Crampton, D., Le Fèvre, O., Hammer, F., & Lilly, S.J. 1996, A&A, 307, L53
- [] Dey, A., Graham, J.R., Ivison, R.J., Smail, I., Wright, G.S., & Liu, M.C. 1999, ApJ, in press (astro-ph/9902044)
- [] Dickinson, M. 1998, in The Hubble Deep Field, ed. M. Livio, S.M. Fall, & P. Madau, Cambridge: Cambridge Univ. Press, 219
- [] Djorgovski, S., de Carvalho, R.R., & Thompson, D.J. 1990, AJ, 99, 1414
- [] Downes, D., Radford, S.J.E., Greve, A., Thum, C., Solomon, P.M., & Wink, J.E. 1992, ApJ, 398, L25
- [] Downes, D., Solomon, P.M., & Radford, S.J.E. 1993, ApJ, 414, L13
- [] Downes, D., & Solomon, P.M. 1998, ApJ, 507, 615
- [] Eales, S., Lilly, S., Gear, W., Dunne, L., Bond, J.R., Hammer, F., Le Fèvre, O., & Crampton, D. 1999, ApJ, 515, 518
- [] Eisenhardt, P.R., Armus, L., Hogg, D.W., Soifer, B.T., Neugebauer, G., & Werner, M.W. 1996, ApJ, 461, 72
- [] Evans, A.S., Scoville, N.Z., Dinshaw, N., Armus, L., Soifer, B.T., Neugebauer, G., & Rieke, M. 1999, ApJ, in press (astro-ph/9812196)
- [] Fasano, G., Christiani, S., Arnouts, S., & Filippi, M. 1998, AJ, 115, 1400
- [] Fernández-Soto, A., Lanzetta, K.M., & Yahil, A. 1999, ApJ, 513, 34 (http://bat.phys.unsw.edu.au/fsoto/hdfcat.html)
- [] Fischer, J., Satyapal, S., Luhman, M.L., Melnick, G., Cox, P., Cernicharo, J., Stacey, G.J., Smith, H.A., Lord, S.D., & Greenhouse, M.A. 1998, in ISO to the Peaks, ed., M. Kessler & M. Perry, Noordwijk: ESTEC, in press
- [] Frayer, D.T., Ivison, R.J., Scoville, N.Z., Yun, M., Evans, A.S., Smail, I., Blain, A.W., & Kneib, J.-P. 1998, ApJ, 506, L7
- [] Frayer, D.T., Ivison, R.J., Scoville, N.Z., Evans, A.S., Yun, M.S., Smail, I., Barger, A.J., Blain, A.W., & Kneib, J.-P. 1999, ApJ, 514, L13
- [] Guélin, M., Zylka, R., Mezger, P.G., Haslam, C.G.T., Kreysa, E., Lemke, R., & Sievers, A.W. 1993, A&A 279, L37
- [] Gwyn, S.D.J., & Hartwick, F.D.A. 1996, ApJ, 468, L77 (http:/uvastro.phys.uvic.ca/grads/gwyn)
- [] Hjorth, J., & Kneib, J.-P. 1999, ApJ, in press
- [] Hogg, D.W., Blandford, R., Kundić, T., Fassnacht, C.D., & Malhotra, S. 1996, ApJ, 467, L73
- [] Hughes, D.H., Dunlop, J.S., & Rawlings, S. 1997, MNRAS, 289, 766
- [] Hughes, D., et al. 1998, Nature, 394, 241
- [] Ivison, R.J., Smail, I., Le Borgne, J.-F., Blain, A.W., Kneib, J.-P., & Bézecourt, J., Kerr, T.H., & Davies, J.K. 1998, MNRAS, 298, 583
- [] Kim, D.-C., & Sanders, D.B. 1998, ApJS, 119, 41
- [] Klaas, U., Haas, M., Heinrichsen, I., & Schulz, B. 1997, A&A, 325, L21
- [] Knapp, G.R. 1999, in Star Formation in Early-Type Galaxies, ed. P. Carral & J. Cepa, San Francisco: Astron. Soc. Pacific, in press
- [] Kneib, J.-P., Alloin, D., Mellier, Y., Guilloteau, S., Barvainis, R., & Antonucci, R. 1998a, A&A, 329, 827
- [] Kneib, J.-P., Alloin, D., & Pelló, R. 1998b, A&A, 339, L65
- [] Krügel, E., & Siebenmorgen, R. 1994, A&A, 288, 929
- [] Lanzetta, K.M., Yahil, A., & Fernández-Soto, A. 1996, Nature, 381, 759
- [] Lilly, S.J., Eales, S.A., Gear, W.K.P., Hammer, F., Le Fèvre, O., Crampton, D., Bond, J.R., & Dunne, L. 1999, ApJ, in press (astro-ph/9901047)
- [] Mann, R.G., et al. 1997, MNRAS, 289, 482
- [] Mazzarella, J.M., et al. 1999, in preparation
- [] Mobasher, B., Rowan-Robinson, M., Georgakakis, A., & Eaton, N. 1996, MNRAS, 282, L7
- [] Patnaik, A.R., Browne, I.W.A., Wilkinson, P.N., & Wrobel, J.M. 1992, MNRAS, 254, 655
- [] Peacock, J.A. 1999, Cosmological Physics, Cambridge: Cambridge Univ. Press, 106
- [] Ratnatunga, K.U., Ostrander, E.J., Griffiths, R.E., & Im, M. 1995, ApJ, 453, L5
- [] Richards, E.A. 1999, ApJ, 513, L9 (http://www.cv.nrao.edu/jkempner/vla-hdf)
- [] Richards, E.A., Kellermann, K.I., Fomalont, E.B., Windhorst, R.A., & Partridge, R.B. 1998, AJ, 116, 1039
- [] Rigopoulou, D., Lawrence, A., & Rowan-Robinson, M. 1996, MNRAS, 278, 1049
- [] Rivolo, A.R., & Solomon, P.M. 1988, in Molecular Clouds in the Milky Way and External Galaxies, ed. R.L. Dickman, R.L. Snell, & J.S. Young, Heidelberg: Springer, 42
- [] Rowan-Robinson, M. 1999, in preparation
- [] Rowan-Robinson, M., et al. 1997, MNRAS, 289, 490
- [] Sanders, D.B., Soifer, B.T., Elias, J.H., Madore, B.F., Matthews, K., Neugebauer, G., & Scoville, N.Z. 1988, ApJ, 325, 74
- [] Sawicki, M.J., Lin, H., & Yee, H.K.C. 1997, AJ, 113, 1; (http://www.astro.utoronto.ca/sawicki/)
- [] Soifer, B.T., Neugebauer, G., Matthews, K., Becklin, E.E., Ressler, M., Werner, M.W., Weinberger, A.J., & Egami, E. 1999, ApJ, 513, 207
- [] Solomon, P.M., Downes, D., Radford, S.J.E., & Barrett, J.W. 1997, ApJ, 478, 144
- [] Sopp, H.M., & Alexander, P. 1991, MNRAS, 251, 112
- [] Surace, J.A., Sanders, D.B., Vacca, W.D., Veilleux, S., & Mazzarella, J.M. 1998, ApJ, 492, 116
- [] Trentham, N., Kormendy, J., & Sanders, D.B. 1999, AJ, in press (astro-ph/9901382)
- [] Turnshek, D.A., Lupie, O.L., Rao, S.M., Espey, B.R., & Sirola, C.J. 1997, ApJ, 485, 100
- [] Wang, Y., Bahcall, N., & Turner, E.L. 1998, AJ, 116, 2081; ftp.astro.princeton.edu, cd elt/:HDF
- [] Wiklind, T., & Henkel, C. 1995, A&A, 297, L71
- [] Williams, R.E., et al. 1996, AJ, 112, 1335
- [] Wilner, D.J., & Wright, M.C.H. 1997, ApJ, 488, L67
- [] Wink, J.E., Duvert, G., Guilloteau, S., Güsten, R., Walmsley, C.M., & Wilson, T.L. 1994, A&A, 281, 505
- [] Wyrowski, F., Hofner, P., Schilke, P., Walmsley, C.M., Wilner, D.J., & Wink, J.E. 1997, A&A, 320, L17
- [] Wyrowski, F., Schilke, P., Walmsley, C.M., & Menten, K.M. 1999, ApJ, 514, L43
- [] Zepf, S.E., Moustakas, L.A., & Davis, M. 1997, ApJ, 474, L1