X-ray properties of LINERs
Abstract
We present an investigation of the X-ray properties of 13 LINERs based on ROSAT all-sky survey and pointed PSPC and HRI observations. Several sources are studied for the first time in X-rays. The X-ray spectra are best described by a powerlaw with photon index –2.0 or thermal emission from gas with very subsolar abundances. The luminosities range between (NGC 404) and 40.8 (NGC 4450). No X-ray variability on the timescale of hours/days is detected. This is in line with the suggestion that LINERs may accrete in the advection-dominated mode. On a longer term, one of the objects, NGC 2768, turns out to be slightly variable. Some sources appear to be extended at weak emission levels whereas the bulk of the X-ray emission is consistent with arising from a point source within the PSPC instrumental resolution. / ratios are derived and emission mechanisms that potentially contribute to the observed X-ray luminosities are discussed.
We also examine the presence of second X-ray sources near the target sources both in terms of instrumental effects and in terms of ‘real’ sources within the LINER galaxies.
Key Words.:
Galaxies: active – Galaxies: fundamental parameters – Galaxies: ISM – Galaxies: nuclei – X-rays: galaxiesskomossa@xray.mpe.mpg.de
1 Introduction
Low-ionization nuclear emission line regions, LINERs, are characterized by their optical emission line spectrum which shows a lower degree of ionization than Seyfert galaxies (e.g., Heckman et al. 1980). Their major power source and line excitation mechanism has been a subject of lively debate ever since their discovery (for reviews see, e.g., Filippenko 1989, 1993, Ho 1998). LINERs manifest the most common type of activity in the local universe. If powered by accretion, they probably represent the low-luminosity end of the quasar phenomenon and their presence has relevance to, e.g., the evolution of quasars, the faint end of the AGN luminosity function, and the presence of supermassive black holes (SMBHs) in nearby galaxies. A detailed study of the LINER phenomenon is thus very important.
Many different mechanisms that might account for their optical emission line spectra have been examined, including collisional ionization and excitation (Burbidge & Burbidge 1962), shock heating (e.g., Fosbury et al. 1978, Heckman 1980, Dopita et al. 1996, Contini 1997), photoionization by hot stars (e.g., Shields 1992, Ho et al. 1993), photoionization by a non-stellar continuum source (e.g., Ferland & Netzer 1983, Halpern & Steiner 1983, Binette 1984,1985,1986, Ho et al. 1993), and photoionization by an absorption-diluted AGN continuum (Halpern & Steiner 1983, Schulz & Fritsch 1994). Despite this detailed shock and photoionization modelling the nature of the main ionizing source of LINERs remained elusive, although there is now growing evidence that they are accretion powered (e.g., Falcke et al. 1997, Falcke 1998, Ho 1998). Eracleous et al. (1995), in an effort to explain the UV bright centers detected in some but not all LINERs, suggested a duty cycle model where central activity in LINERs is governed by occasional tidal disruptions of stars by central black holes. In an alternative approach, Barth et al. (1998) suggested that dust extinction could cause the UV darkness of some LINERs.
X-rays are a powerful tool to investigate the presence of an AGN via X-ray variability, luminosity, and extent, and to explore the physical properties of LINERs in general. Nevertheless, not many LINERs have been examined in X-rays, particularly not larger samples in an homogeneous way. The largest previous one we are aware of was presented by Ptak et al. (1999, see also Serlemitsos et al. 1997) and consisted of several low-luminosity AGN (LLAGN) including 5 LINERs observed with ASCA. They find that the ASCA spectra are best described by a two-component model consisting of soft thermal emission and a powerlaw with photon index , with varying relative contributions of the two spectral components from object to object. Several studies of individual objects (e.g., Mushotzky 1982, Koratkar et al. 1995, Ehle et al. 1995, Cui et al. 1997, Terashima et al. 1998, Pietsch et al. 1998, Roberts et al. 1999) revealed results consistent with the above spectral results. A fairly complex X-ray spectrum was recently reported for the LINER NGC 1052 (Weaver et al. 1999). Concerning the spatial extent of the X-ray emission, Koratkar et al. (1995; K95 hereafter) found their two LINERs to be consistent with a point source within the limits of the ROSAT HRI resolution. X-ray luminosities range up to 1041 erg s-1 (e.g., Ptak et al. 1999, Stockdale et al. 1998, K95; see Halpern & Steiner 1983 for a collection of Einstein luminosities) and are presently biased towards the X-ray brightest objects.
Given the importance to better understand the LINER phenomenon and activity in nearby galaxies in general, with its potential bearing on the evolution of SMBHs in galaxies, the contribution to the faint end of the AGN luminosity function, and the soft X-ray background; and given the still limited number of objects previously studied in the X-ray spectral region, we examined a sample of 13 LINERs with the ROSAT (Trümper 1983) instruments (Pfeffermann et al. 1987). We report here the results of an investigation of the spectral, spatial, and temporal X-ray properties of these galaxies.
Our sample consists of spiral galaxies and lenticulars. The primary selection was according to the list of Huchra & Burg (1992, with most LINERs identified in Heckman 1980, Staufer 1982, and Keel 1983) and Huchra (1998, priv. com.). We then excluded LINERs that were, on the basis of emission lines, re-classified as Seyferts or listed to contain a Seyfert-component as well according to the NED database. This resulted in 13 remaining LINERs. Results for a larger sample of LLAGN, including the objects with composite spectra and Seyfert 2 galaxies will be reported elsewhere. For the selected sources we analyzed ROSAT all-sky survey data. In addition, 8 of the galaxies were targets of, or serendipituously located in the field of view of, PSPC and/or HRI observations. All except one are detected, and for 5 of them a PSPC spectral analysis was possible. The brightest source turned out to be NGC 4450 which is studied in most detail below.
The paper is organized as follows: The data reduction is described in Sect. 2. In the next two Sections we present the general assumptions on which the data analysis is based (Sect. 3) and results for the individual objects (Sect. 4), including a discussion of (the reality of) further X-ray sources close to the target sources. The discussion (Sect. 5) is followed by the concluding summary in Sect. 6.
2 Data reduction
We used ROSAT all-sky survey (RASS) data as well as archival and serendipituous pointed observations of the galaxies. The observations are summarized in Table 1.
For further analysis of the pointed PSPC and HRI data the source photons were extracted within a circular cell centered on the target source. The background was determined in a source-free region around the target source and subtracted. The data were corrected for vignetting and dead-time, using the EXSAS software package (Zimmermann et al. 1994).
To carry out the spectral analysis source photons in the amplitude channels 11-240 were binned according to a constant signal/noise ratio of 4.
Lightcurves were created with a binning of 800 sec to account for the wobble mode of the satellite.
| galaxy | date | instrument | (1) | |
|---|---|---|---|---|
| sec | cts/s | |||
| NGC 404 | surv | 473 | 0.02 | |
| 04/01/97 | HRI | 23874 | 0.0011 0.0003 | |
| NGC 1167 | surv | 477 | 0.02 | |
| 27-28/1/92 | PSPC | 7315 | 0.005 | |
| NGC 2768 | surv | 341 | 0.038 0.014 | |
| 11-13/10/93 | PSPC | 4766 | 0.021 0.002 | |
| 01/05/94 | PSPC | 2898 | 0.013 0.003 | |
| NGC 3642 | surv | 540 | 0.023 0.011 | |
| 10-11/5/93 | PSPC | 6178 | 0.018 0.003 | |
| 21/10/93 | PSPC | 7804 | 0.016 0.002 | |
| NGC 3898 | surv | 456 | 0.016 0.011 | |
| 19/11/91 | PSPC | 4916 | 0.012 0.003 | |
| NGC 4036 | surv | 415 | 0.013 0.010 | |
| NGC 4419 | surv | 73 | 0.14 | |
| NGC 4450 | surv | 266 | 0.039 0.018 | |
| 04-12/6/92 | PSPC | 6170 | 0.101 0.004 | |
| 17/12/92 | PSPC | 5145 | 0.091 0.004 | |
| NGC 5371 | surv | 682 | 0.026 0.010 | |
| 23/06/ -01/07/93 | PSPC | 14960 | 0.038 0.002 | |
| NGC 5675 | surv | 623 | 0.016 | |
| NGC 5851 | surv | 123 | 0.08 | |
| NGC 6500 | surv | 262 | 0.04 | |
| 17-20/3/93 | HRI | 5953 | 0.0025 0.0008 | |
| IC 1481 | surv | 410 | 0.02 |
(1)countrate in the observed (0.1-2.4) keV band (note the different sensitivity of the PSPC and HRI detector, which results in a countrate conversion of a factor of several from one instrument to the other, depending on the spectral shape).
3 Data analysis: General considerations and assumptions
The following models were fit to the X-ray spectra of all objects: (i) a powerlaw of the form , and (ii) emission from a Raymond-Smith (1977; RS hereafter) plasma, abundances fixed to either the solar value (Anders & Grevesse 1989) or below, up to 1/100 solar. The amount of cold absorption was constrained not to underpredict the Galactic value (Dickey & Lockman 1990) along the line-of-sight.
If several PSPC observations were available, we used the one with the deepest exposure time (for the present sample, this also always happened to correspond to the pointing were the source was on-axis, if an on-axis pointing existed at all.)
To calculate X-ray fluxes and luminosities, we proceeded as follows: For sources bright enough to allow spectral fits we integrated over the SED in the (0.1-2.4 keV) band after correcting for cold absorption. For RASS sources too weak to perform spectral fits, and for HRI sources we assumed a powerlaw spectrum with =–1.9 and absorption of the Galactic value. Distances were calculated using a Hubble constant of =75 km/s/Mpc for the distant ( km/s) objects. For those nearby or even with blueshift we used Tully’s (1988) catalog of nearby galaxies (if not stated otherwise) which is based on the virgocentric model of Tully & Shaya (1984). To check for the influence of the assumed distances, which can be important given that all galaxies are very nearby, we re-calculated all luminosities based on distances obtained with the flow field model of Mould et al. (2000; ApJ, in prep.). We find that our conclusions are unaltered and that luminosities of individual objects are changed by a factor 2. If not stated otherwise, X-ray luminosities given below refer to the energy interval (0.1–2.4) keV.
Some of the RASS sources were not significantly detected. Namely, formally only 1, 3, 0, 5, 1, 2 source photons above the background were registered in the (0.5–2) keV band for NGC 404, NGC 1167, NGC 4419, NGC 5675, NGC 5851, and IC 1481, respectively. In this case we conservatively assumed that 10 source photons would have escaped detection and the upper limits for countrates and luminosities listed in Tables 1, 2 were calculated correspondingly.
To derive blue luminosities, we used the observed blue magnitudes of de Vaucouleur et al. (1991; see also Huchra & Burg 1992). To carry out the extinction correction we adopted the same amount of Galactic absorption (Dickey & Lockman 1990) as we did in the X-ray analysis, assumed a standard gas/dust ratio, and utilized the relation of Bohlin et al. (1978; see also Predehl & Schmitt 1995).
4 Notes on individual objects
Below, we first give a brief summary of what is known for the individual galaxies (only the detected ones plus NGC 1167) from the literature and then describe the results from our X-ray temporal, spectral and spatial analysis of the individual objects.
A detailed literature search revealed that some of the present galaxies were already very briefly discussed in other/previous samples with different aims. Given the inhomogeneity of the assumptions made and models fit (for details see below), we extent here the spectral analysis of these objects and also perform a spatial and temporal analysis.
4.1 NGC 404
NGC 404 is blueshifted (Stromberg 1925). Baars & Wendker (1976) noted its peculiar radio properties. Optical spectroscopy was performed by, e.g., Burbidge & Burbidge (1965), Keel (1983), and Filippenko & Sargent (1985) and revealed very narrow emission lines; for an image see Sandage (1961). Larkin et al. (1998) obtained NIR spectra and reported the detection of strong [FeII] emission in this and several further LINERs (but not in all of their sample) and suggested X-ray heating to be at work. A molecular gas ring was observed by Wiklind & Henkel (1990). The detection of a UV core with HST was presented by Maoz et al. (1995). Based on the analysis of UV spectra, Maoz et al. (1998) explained the data by the presence of a central star cluster.
A deep HRI observation of NGC 404 is available. The source is detected (25 source photons) but too weak to allow a more detailed temporal or spatial analysis. Assuming a powerlaw spectral shape as described above we derive a (0.1-2.4 keV) luminosity of erg s-1, the lowest among the present objects, and among the lowest so far detected for a LINER. The X-ray emission of NGC 404 is consistent with originating completely from discrete stellar sources given the galaxy’s blue luminosity. Using the relation between and of Canizares et al. (1987), we predict erg s-1 in the (0.5–4.5 keV) band which compares to the observed value of erg s-1, which is below the expectation but consistent within the scatter. (The intrinsic X-ray luminosity could be boosted if there is some excess absorption or the spectral shape is different from the assumed one.) It is interesting to note that Wiklind & Henkel (1990) argue for a much larger distance of NGC 404 than derived from, e.g., the Tully catalog (1988): they suggest 10 Mpc instead of 2.4 Mpc which would correspondingly increase the values of both and .
4.2 NGC 1167
The galaxy is a well-known radio source (4C +34.09) and has been intensively studied at radio wavelengths (e.g., Long et al. 1966, Condon & Dressel 1978, Bridle & Fomalont 1978, Sanghera et al. 1995). Optical spectra were presented by, e.g., Wills (1967), Wills & Wills (1976), and Gelderman & Whittle (1994). Despite earlier suspicions, Ho et al. (1997; H97 hereafter) did not detect a broad component in H. An upper limit for the X-ray luminosity derived from Einstein observations, erg s-1, was reported by Dressel & Wilson (1985; see also Canizares et al. 1987, Fabbiano et al. 1992).
The source is undetected in the PSPC pointing, which might be partly traced back to the large value in its direction, cm-2. We estimate an upper limit for the countrate of 0.005 cts/s, from the conservative assumption of a countrate less than that of the weakest detected source in the field of view at similar off-axis angle.
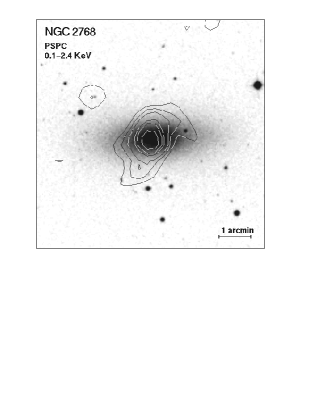


4.3 NGC 2768
No broad H component was detected by H97. Weak CO emission was found by Wiklind et al. (1995). The source is included in a sample of galaxies by Davis & White (1996) who fit a Raymond-Smith model and find keV for metal abundances 0.2 solar, and absorption of = cm-2, less than the Galactic value.
The source seems to be slightly variable from the first to the second pointing with a drop in countrate from 0.0210.002 cts s-1 to 0.0130.003 cts s-1. The short-term light curve (first pointing) shows constant source flux.
Spectral fits were performed for the deeper PSPC observation only. Neither a single powerlaw with nor emission from a Raymond-Smith plasma with solar abundances provides a successful X-ray spectral fit. The fit becomes acceptable for very subsolar abundances. In that case we find a lower temperature than Davis & White (1996) (and cold absorption consistent with the Galactic value, which should not be underpredicted). This also is more consistent with the relation of Davis & White.
A comparison of the source’s spatial extent with the theoretical point spread function (PSF) of a point source shows that most of the X-ray emission is consistent with arising from a point source (Fig. 3). There may be some extended emission at weak levels (Fig. 2). A nearby weak second source is detected with a countrate of 0.0030.001 cts/s. It coincides with a stellar objects on a POSS plate.
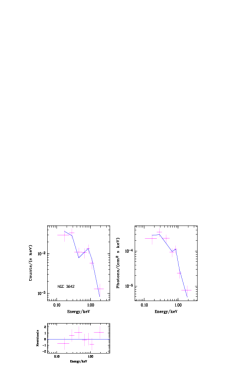
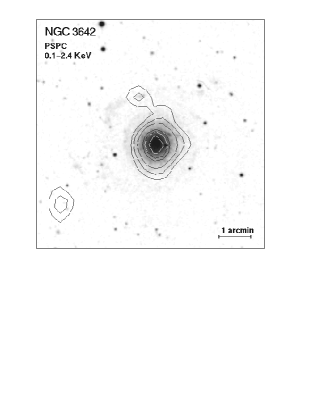
4.4 NGC 3642
Some X-ray properties of this LINER were earlier examined by K95 who fit a powerlaw model to the ROSAT PSPC spectrum and found the HRI source extent to be consistent with a point source. A broad component in H is present (e.g., K95). Barth et al. (1998) reported the detection of a compact nuclear UV source based on HST data, and conclude that the extrapolation of the UV continuum, assuming an AGN-like shape, would provide enough ionizing photons to power the NLR emission of this galaxy.
We neither detect short-time variability nor variability between the two PSPC observations separated by 5 months.
The spectrum is best fit by a Raymond-Smith model of heavily depleted abundances, around 0.03 solar (or, alternatively, by a powerlaw model with some excess absorption, confirming K95).
A comparison with the PSF of the PSPC shows that most of the X-ray emission arises from an unresolved source (Fig. 3). There is a second source nearby with a countrate of 0.0025 0.0007 cts/s. Its position falls close to two star-like knots projected onto (or in) one of the spiral arms of NGC 3642 (they could be HII regions or foreground stars). If the X-ray source is intrinsic to NGC 3642, its luminosity of erg s-1 assuming a powerlaw spectral shape as described in Sect. 3 is fairly high. For instance, its exceeds the Eddington luminosity of a solar mass black hole by a factor 10. One possible interpretation is a powerful X-ray binary with either a super-eddington low-mass black hole or a massive black hole. We note in passing that no optical supernova was detected in NGC 3642.
4.5 NGC 3898
There have been several studies of this galaxy in the optical (e.g., Burbidge & Burbidge 1965, Barbon et al. 1978, Mizuno & Hamajima 1986, and references given in van Driel & van Woerden 1994). H97 tentatively concluded that broad H is absent from the optical spectrum. 21 cm HI observations with the WRST were presented by van Driel & van Woerden (1994).
The source is quite weak with only about 50 detected photons, very close to the limits of meaningful spectral fits. Therefore, we only applied a powerlaw model with fixed Galactic absorption. This results in =–2.1 and gives an acceptable fit.
| object | ||||||||
|---|---|---|---|---|---|---|---|---|
| 1021 cm-2 | 10erg cm-2 s-1 | erg s-1 | keV | sol | ||||
| NGC 404 | 0.509 | –1.91 | 0.07 | 37.7 | ||||
| NGC 1167 | 1.33 | –1.91 | 0.18 | 40.95 | ||||
| NGC 2768 | 0.383 | –2.2 | 0.58 | 40.6 | 3.1 | 3.7 | 1.0 | 5.3 |
| 0.5 | 0.1 | 0.8 | ||||||
| NGC 3642 | 0.073 | –1.8 | 0.18 | 40.2 | 1.4 | 5.5 | 1.0 | 3.6 |
| 1.1 | 0.1 | 1.5 | ||||||
| 0.7 | 0.05 | 0.8 | ||||||
| NGC 3898 | 0.106 | –2.1 | 0.29 | 40.2 | 0.8 | |||
| NGC 4036 | 0.192 | –1.91 | 0.20 | 40.2 | ||||
| NGC 4419 | 0.255 | –1.91 | 2.43 | 40.9 | ||||
| NGC 4450 | 0.245 | –2.0 | 1.89 | 40.8 | 1.1 | 3.6 | 1.0 | 10 |
| 1.4 | 0.1 | 3.9 | ||||||
| NGC 5371 | 0.110 | –1.6 | 0.40 | 40.8 | 1.1 | 5.3 | 1.0 | 5.1 |
| 1.4 | 0.1 | 3.2 | ||||||
| 0.8 | 0.01 | 1.8 | ||||||
| NGC 5675 | 0.100 | –1.91 | 0.18 | 40.8 | ||||
| NGC 5851 | 0.258 | –1.91 | 1.40 | 42.1 | ||||
| NGC 6500 | 0.753 | –1.91 | 0.19 | 40.6 | ||||
| IC 1481 | 0.566 | –1.91 | 0.49 | 41.6 |
(1) fixed
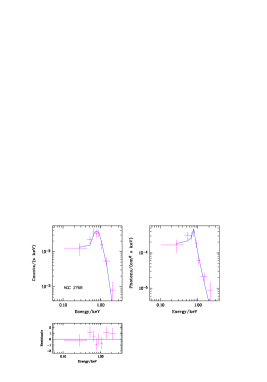
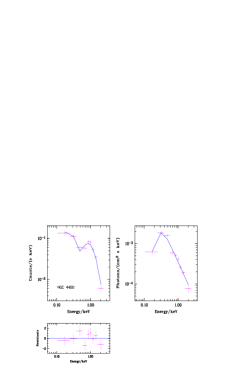
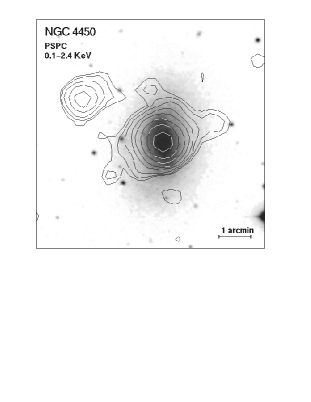
4.6 NGC 4450
A fairly weak broad H line is probably present in the optical spectrum (Staufer 1982, H97). For an optical image see, e.g., Sandage (1961). The HII region population of the galaxy was studied by Gonzalez Delgado et al. (1997). An Einstein IPC image is shown in Fabbiano et al. (1992). They derive an (0.2-4 keV) X-ray flux erg cm-2 s-1 under the assumption of a thermal bremsstrahlung spectrum with =5 keV.
Again, we do not detect short-timescale variability.
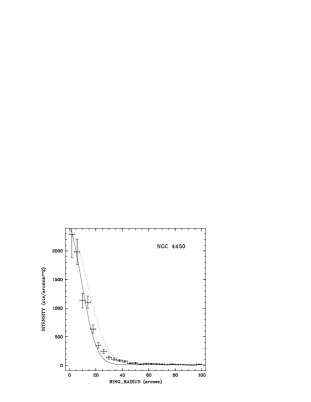
The source is quite bright and nearly 2000 photons are available for the spectral analysis (we used the deepest pointing). No Raymond-Smith fit is possible. When allowing to be free, it underpredicts the Galactic value. If subsolar abundances are allowed, the best fit requires abundances less than 1/100 solar and that fit is still unsatisfactory. In contrast, a single powerlaw with = –2.0 near the AGN-canonical value (e.g., Pounds et al. 1994; Svensson et al. 1994) gives an excellent fit. If is treated as free parameter, the Galactic value is recovered. We derive a soft X-ray luminosity of erg s-1, the highest value found among the present galaxies. The corresponding (0.5-4.5 keV) X-ray luminosity is erg s-1, a factor 5 above the value expected from the stellar contribution using the relation of Canizares et al. (1987). We note that Tully’s catalog places NGC 4450 at the distance of the Virgo cluster. If the galaxy is instead located in the sheet of galaxies behind the Virgo cluster, the luminosities inferred above increase correspondingly.
A comparison with the PSF of the PSPC shows that most of the X-ray emission is consistent with arising from a point source. At weak emission levels there is evidence for source extent (Fig. 3; several of the structures are seen in both, the soft (0.1-0.5 keV) and hard (0.5-2.4 keV) band). Again, there is a nearby second source. Its countrate is 0.011 0.002 cts/s and since the pointing is deep, a spectral analysis is possible. A powerlaw spectral fit gives a spectrum similar to NGC 4450 itself, but a bit softer with =–2.4. At the distance of NGC 4450 this corresponds to a luminosity of erg s-1. The source is also present in the second PSPC pointing of slightly lower exposure time (Table 1). Its countrate is constant. Inspection of the POSS plates does not reveal any optical counterpart. Neither is there any X-ray source visible in the Einstein IPC image (see Fig. 7 of Fabbiano et al. 1992). The ‘reality’ of these nearby sources is examined in Section 4.9.
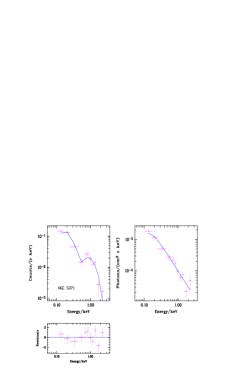
4.7 NGC 5371
The galaxy was classified as a LINER by Rush et al. (1993). Elfhag et al. (1996) presented CO measurements and suggested NGC 5371 to be a good candidate for a post-starburst galaxy (Koorneef 1993). The rotation curve was measured by, e.g., Zasov & Sil’chenko (1987). Gonzalez Delgado et al. (1997) studied the HII region population.
The X-ray lightcurve does not show short-timescale variability (the countrate in individual bins falls slightly outside the 1 error, occasionally, but this is most likely due to the closeness of the source to the PSPC support grid structure).
The source appears to be extended or double. Thus, photons from the total emission region were first extracted for analysis. A spectrum was fit to this ‘double’ source (since their contributions cannot be disentangled from each other safely; it is these results that are listed in Table 2). In that case, a powerlaw of index yields a successful X-ray spectral fit. The cold absorption, if treated as free parameter, underpredicts the Galactic value, and even more so if a RS model is applied. The latter type of model only provides an acceptable fit if the metal abundances are depleted below 0.01 solar.
Secondly, since the optical position of NGC 5371 falls on the northernmost of the two sources, source photons centered on the optical position of the galaxy were extracted within a circular region of diameter 250″. In this case, the X-ray spectrum is dominated by the northernmost source, but the second one contributes to some extent. The spectral analysis then yields a best fit in terms of a powerlaw with (=0.5), and recovers the Galactic value if treated as free parameter. Again, RS emission can only successfully describe the spectrum for heavily depleted abundances.
The source appears double, or extended. No HRI observation is available for a more detailed study of the spatial extent.
4.8 NGC 6500
There are several lines of evidence for the presence of a nuclear outflow or wind as judged from radio continuum emission measurements (Unger et al. 1989) and optical emission lines (Gonzalez Delgado & Perez 1996). H97 did not detect broad H. Barth et al. (1997) using HST data concluded that the resolved UV emission of NGC 6500 is likely dominated by massive stars. They also derived a ROSAT HRI flux for this galaxy, assuming a spectrum with =–2.
Although NGC 6500 is detected in the HRI observation, the low number of source photons prevents a more detailed analysis in terms of source extent or variability.
4.9 Origin of nearby sources
In PSPC observations of several galaxies (NGC 2768, NGC 3642, NGC 4450) there is a second source detected near the target source with a countrate always roughly 1/10 of the central source. The same was found for NGC 4736 by Cui et al. (1997) who considered the second source to be real and of transient nature due to its presence in the PSPC and absence in the HRI observation. Given the similar locations relative to the central source, and same (factor 1/10) relative countrates, we suspected these second sources to be an instrumental artifact, namely ghost imaging (Briel et al. 1994) to be at work.
To more closely examine this problem we selected the second source near NGC 4450 since it is the brightest, thus allowing the most detailed analysis, and since no potential optical counterpart shows up near the X-ray position. We extracted the photons around the X-ray center of the source and made several tests. However, we find no indications of ghost imaging: Source photons do not exclusively cover the very soft channels (ghost imaging only operates below 0.2 keV; Nousek & Lesser 1993, Briel et al. 1994), and the source is not fixed in detector coordinates but follows the wobble.
Using the X-ray distribution of Hasinger et al. (1994), we expect only 0.17 sources of X-ray flux greater or equal to that of the source near NGC 4450 in a region of size 10′ 10′. For a discussion of an excess of bright X-ray sources around nearby galaxies see Arp (1997, and references therein).
Unfortunately, no HRI observation of NGC 4450 is available for further scrutiny. It will certainly be interesting to check for the presence of the second source once further high spatial resolution observations of NGC 4450 become available.
5 Discussion
5.1 X-ray luminosity and / ratio
The objects examined span a luminosity range from erg s-1 in the (0.1-2.4 keV) band. There is still some bias towards selecting the high LINERs. This does not hold for the ROSAT survey data but given the short exposure times of typically 400s upper limits, although already meaningful, are not very restrictive concerning the low-luminosity end.
None exceeds the limit of erg s-1 which is usually taken as indicative for the presence of a ‘normal’ AGN (e.g., Wisotzki & Bade 1997). Also, none reaches the high usually observed for ellipticals in the group/cluster environment (e.g., Brown & Bregman 1998, Irwin & Sarazin 1998, Beuing et al. 1999) which occasionally show LINER-like emission lines.
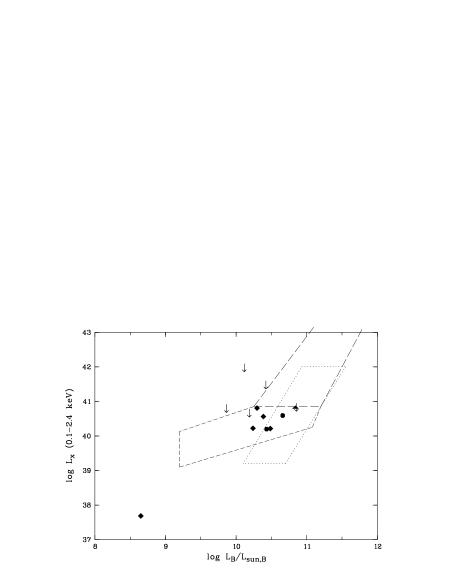
Most of the present objects fall in the intermediate / range (Fig. 4). Since the majority of LINERs are found in bulge-dominated early-type galaxies (e.g., Ho 1998) the same emission mechanisms might contribute to the observed X-ray luminosity. Among the suggestions for early-type galaxies are accumulated stellar winds, SN heating and cooling flows (see Pellegrini 1999 for a recent overview).
The low systems are dominated by discrete sources, mainly LMXBs (e.g., Canizares et al. 1987, Irwin & Sarazin 1998, Irwin & Bregman 1999). Among the present sample, this holds best for NGC 404.
Further clues on the emission mechanism can be drawn from the observed spectral shapes.
5.2 X-ray spectral shapes
The LINERs analyzed here show some spectral variety. Some of them are best described by a powerlaw model of photon index similar to that observed in AGN (e.g., Schartel et al. 1996a,b, 1997), the others are best fit by Raymond-Smith (RS) emission of a very sub-solar abundances plasma (see Table 2).
We consider the RS model with heavily depleted gas-phase metal abundances to be quite unrealistic, and as previously found for other galaxies (ellipticals, AGN; e.g., Matsushita et al. 1997, Buote & Fabian 1998, Komossa & Schulz 1998) we prefer the alternative of a two-component spectrum, consisting of contributions from both, a powerlaw (or other hard component) and thermal RS emission of solar abundances gas. Such models were not fit, though, due to the quite low number of photons available per spectrum. Other possibilities (than the two-component solution) include a contribution from Fe L emission, not yet fully modeled (but see Buote & Fabian 1998 who excluded the FeL region from fitting ASCA spectra of early type galaxies, and still find similar results concerning abundances), a multi-temperature distribution of the emitting medium (e.g., Strickland & Stevens 1998) and the possibility that the X-ray emitting gas is far out of collisional-ionization equilibrium (e.g., Breitschwerdt & Schmutzler 1994, 1999, Komossa et al. 1999; see Böhringer 1998 for a recent review).
In case of the two-component interpretation – as indeed observed by ASCA with its broader X-ray energy range for several early-type galaxies (e.g., Matsushita et al. 1994, Matsumoto et al. 1997, Buote & Fabian 1998) and some LINERs (e.g., Ptak et al. 1999) – the hard component could be due to stellar sources, namely LMXBs, or a low-luminosity AGN, the soft component due to emission from hot gas (see previous Section).
In the case of NGC 6500 the X-ray emission might be related to the outflow/wind for which optical and radio evidence was reported (Unger et al. 1989, Gonzales Delgado & Perez 1996), in analogy to the X-ray emission associated with starburst-driven winds observed in several starburst galaxies (e.g., Heckman et al. 1990, Schulz et al. 1998). It is also interesting to note that in two further cases, NGC 4450 and NGC 2768, the weak extended emission appears roughly perpendicular to the galaxy’s disk and could result from an outflow.
We interpret the powerlaw spectral component, in those cases where it dominates the spectrum, as arising most likely from a low-luminosity active nucleus, since the inferred luminosities are above those expected from discrete stellar sources and the powerlaw indices derived are in the range to (Table 2) similiar to what is observed for AGNs. However, we cannot exclude a more complex situation where the superposition of several different emission components mimics a single AGN-like powerlaw.
For a detailed spatial and spectroscopic disentanglement of the contributing components (thermal RS-like emission, presumably extended, and a pointlike powerlaw-like component) and a better determination of the metal abundances high-spectral resolution observations with future X-ray observatories like XMM, AXAF or Spectrum-X-Gamma will be very useful.
5.3 X-ray variability
We do not find evidence for X-ray variability on the timescale of hours/days. This also holds for the LINERs examined by Ptak et al. (1998) and some further sources, and is not in line with a continuation of the trend of higher variability at lower luminosity seen in AGN. It is consistent with the presence of advection-dominated accretion disks (e.g., Abramowicz et al. 1988, Narayan & Yi 1994) in LINERs as suggested by Ptak et al. (1998; see also Lasota et al. 1996).
6 Summary and conclusions
We have investigated the soft X-ray properties of a number of LINERs based on ROSAT survey and pointed PSPC and HRI observations.
Luminosities range between (NGC 404) and 40.8 (NGC 4450). The ratios /, when compared to early-type galaxies, are located in the intermediate region and similar emission mechanisms may contribute to the observed X-ray luminosities.
Whereas the bulk of the X-ray emission is consistent with arising from a point source there is some extended emission seen at weak emission levels in some sources.
Spectra are best described by either a powerlaw of photon index (NGC 3898, NGC 4450, NGC 5371), or a Raymond-Smith model with heavily depleted abundances (NGC 2768, NGC 3642). Since the inferred metal abundances are implausibly low we take this latter model as indication of a more complex soft X-ray spectral shape/ emission mechanism (e.g., a powerlaw or other hard component plus RS emission from gas with solar abundances; or plasma out of equilibrium). Some sources are best described by a single AGN-like powerlaw with X-ray luminosity above that expected from discrete stellar sources. These spectra most likely indicate the presence of low-luminosity AGNs in the centers of the LINER galaxies.
The absence of (short-timescale) variability is consistent with the earlier suggestion that LINERs may accrete in the advection-dominated mode. Only one source (NGC 2768) seems to be slightly variable on a timescale of months.
For several LINER galaxies nearby second X-ray sources are discovered with countrates roughly one-tenth those of the target sources. We cannot identify an obvious detector effect. If at the distances of the galaxies, their luminosities are on the order of several erg s-1.
Given the spectral variety of LINERs with contributions from several emission components, future studies of both, spectra of individual objects as well as larger samples will certainly give further insight into the LINER phenomenon which provides an important link between active and ‘normal’ galaxies.
Acknowledgements.
H.B. and St.K. thank the Verbundforschung for support under grant No. 50 OR 93065. J.P.H. acknowledges support from the Smithsonian Institution and NASA grant NAGW-201. We thank Andreas Vogler for providing the software to plot the overlay contours of Fig. 2. The ROSAT project has been supported by the German Bundesministerium für Bildung, Wissenschaft, Forschung und Technologie (BMBF/DLR) and the Max-Planck-Society. This research has made use of the NASA/IPAC extragalactic database (NED) which is operated by the Jet Propulsion Laboratory, Caltech, under contract with the National Aeronautics and Space Administration. The optical images shown are based on photographic data of the National Geographic Society – Palomar Observatory Sky Survey (NGS-POSS) obtained using the Oschin telescope on Palomar Mountain.References
- (1) Abramowicz M.A., Czerny B., Lasota J.-P., Szuszkiewicz E., 1988, ApJ 332, 646
- (2) Anders E., Grevesse N., 1989, Geochimica & Cosmochimica Acta 53, 197
- (3) Arp H., 1997, A&A 319, 33
- (4) Baars J.W.M., Wendker H.J., 1976, A&A 48, 405
- (5) Barbon R., Benacchio L., Capaccioli M., 1978, A&A 65, 165
- (6) Barth A.J., Reichert G.A., Ho L.C., et al., 1997, AJ 114, 2313
- (7) Barth A.J., Ho L.C., Filippenko A.V., Sargent W.L.W., 1998, ApJ 496, 133
- (8) Beuing J., Döbereiner S., Böhringer H., Bender R., 1999, MNRAS 302, 291
- (9) Binette L., 1984, in ‘The Messenger’ 38, 13
- (10) Binette L., 1985, A&A 143, 334
- (11) Binette L., 1986, in ‘Structure and evolution of active galactic nuclei’, G. Giuricin et al. (eds), 475, Reidel: Dordrecht
- (12) Böhringer H., 1998, in ‘The local bubble and beyond’, D. Breitschwerdt, M.J. Freyberg, J. Trümper (eds), LNP 506, 341
- (13) Bohlin R.C., Savage B.D., Drake J.F., 1978, ApJ 224, 132
- (14) Breitschwerdt D., Schmutzler T., 1994, Nat 371, 774
- (15) Breitschwerdt D., Schmutzler T., 1999, to appear in A&A; astro-ph/9902268
- (16) Bridle A.H., Fomalont E.B., 1978, MNRAS 185, 67p
- (17) Briel U., Aschenbach B., Hasinger G. et al., 1994, ROSAT user’s handbook, MPE: Garching
- (18) Brown B.A., Bregman J.N., 1998, ApJ 495, L75
- (19) Buote D.A., Fabian A.C., 1998, MNRAS 296, 977
- (20) Burbidge E.M., Burbidge G.R., 1962, ApJ 135, 694
- (21) Burbidge E.M., Burbidge G.R., 1965, ApJ 142, 634
- (22) Canizares C.R., Fabbiano G., Trinchieri G., 1987, ApJ 312, 503
- (23) Cui W., Feldkun D., Braun R., 1997, ApJ 477, 693
- (24) Condon J.J., Dressel L., 1978, ApJ 221, 456
- (25) Contini M., 1997, A&A 323, 71
- (26) Davis D.S., White III R.E., 1996, 470, L35
- (27) de Vaucouleurs G., de Vaucouleurs A., Corwin J.R., et al., 1991, Third reference catalogue of bright galaxies, New York: Springer
- (28) Dickey J.M., Lockman F.J., 1990, ARA&A, 28, 215
- (29) Dopita M., Allen M., Bicknell G.V., et al., 1996, in ‘The physics of LINERs in view of recent observations’, M. Eracleous et al. (eds), ASP conf ser. 103, 44
- (30) Dressel L.L., Wilson A.S., 1985, ApJ 291, 668
- (31) Elfhag T., Booth R.S., Höglund B., Johansson L.E.B., Sandqvist Aa., 1996, A&AS 115, 439
- (32) Ehle M., Pietsch W., Beck R., 1995, A&A 295, 289
- (33) Eracleous M., Livio M., Binette L., 1995, ApJ 445, L1
- (34) Fabbiano G., Kim D.-W., Trinchieri G., 1992, ApJS 80, 531
- (35) Falcke H., 1998, Rev. mod. Astron. 11, 245
- (36) Falcke H., Wilson A.S., Ho L.C., 1997, in proc. of ‘Relativistic Jets in AGN’, p. 13
- (37) Filippenko A.V., 1989, in ‘Active galactic nuclei’, D.E. Osterbrock and J.S. Miller, (Dordrecht: Kluwer), 495
- (38) Filippenko A.V., 1993, in ‘The nearest active galaxies’, J. Beckman (ed.), Ap&SS 205
- (39) Filippenko A.V., Sargent W.L.W., 1985, ApJS 57, 503
- (40) Ferland G., Netzer H., 1983, ApJ 264, 105
- (41) Fosbury R.A.E., Mebold U., Goss W.M., Dopita M.A., 1978, MNRAS 183, 549
- (42) Gelderman R., Whittle M., 1994, ApJS 91, 491
- (43) Gonzales Delgado R., Perez E., 1996, MNRAS 281, 1105
- (44) Gonzales Delgado R., Perez E., Tadhunter C., Vilchez J.M., Rodriguez-Espinosa J.M., 1997, ApJS 108, 155
- (45) Halpern J., Steiner J.E., 1983, ApJ 269, L3
- (46) Hasinger G., Burg R., Giacconi R., et al., 1994, A&A 275, 1
- (47) Heckman T., 1980, A&A 87, 152
- (48) Heckman T., Armus L., Miley G.K., 1990, ApJS 74, 833
- (49) Ho L.C., 1998, to appear in ‘The 32nd COSPAR Meeting’, Adv. Space Res.; astro-ph/9807273
- (50) Ho L.C., Filippenko A.V., Sargent W.L.C., 1993, ApJ 417, 63
- (51) Ho L.C., Filippenko A.V., Sargent W.L.C., 1995, ApJS 98, 477
- (52) Ho L.C., Filippenko A.V., Sargent W.L.C., Peng C.Y., 1997, ApJS 112, 391
- (53) Huchra J., Burg R., 1992, ApJ 393, 90
- (54) Irwin J.A., Sarazin C.L., 1998, ApJ 499, 650
- (55) Irwin J.A., Bregman J.N., 1999, ApJ 510, L21
- (56) Keel W.C., 1983, ApJ 269, 466
- (57) Komossa S., Breitschwerdt D., Böhringer H., Meerschweinchen J., 1999, in ‘Astrophysical Dynamics, D. Berry et al. (eds), Ap&SS, in press
- (58) Komossa S., Schulz H., 1998, A&A 339, 345
- (59) Koorneef J., 1993, ApJ 403, 581
- (60) Koratkar A., Deustua S.E., Heckman T., et al., 1995, ApJ 440, 132
- (61) Larkin J.E., Armus L., Knop R.A., Soifer B.T., Matthews K., 1998, ApJS 114, 59
- (62) Lasota J.P., Abramowicz M.A., Chen X., et al., 1996, ApJ 462, 142
- (63) Long R.J, Smith M.A., Stewart P., Williams P.J.S., 1966, MNRAS 134, 371
- (64) Maoz D., Filippenko A.V., Ho L.C., et al., 1995, ApJ 440, 91
- (65) Maoz D., Koratkar A., Shields J.C., et al., 1998, AJ 116, 55
- (66) Matsumoto H., Koyama K., Awaki H., et al., 1997, ApJ 482, 133
- (67) Matsushita K., Makishima K., Awaki H., et al., 1994, ApJ 436, L41
- (68) Matsushita K., Makishima K., Rokutanda E., Yamasaki N., Ohashi T., 1997, ApJ 488, L125
- (69) Mizuno T., Hamajima K., 1986, PASJ 39, 211
- (70) Mould J., et al., 2000, ApJ, in prep.
- (71) Mushotzky R., 1982, ApJ 256, 92
- (72) Narayan R., Yi I., 1994, ApJ 428, L13
- (73) Nousek J., Lesser A., 1993, ROSAT Newsletter 8, 13
- (74) Pellegrini S., 1999, to appear in A&A; astro-ph/9812325
- (75) Pfeffermann E., Briel U.G., Hippmann H., et al., 1987, SPIE 733, 519
- (76) Pietsch W., Trinchieri G., Vogler A., 1998, A&A 340, 351
- (77) Pounds K.A., Nandra K., Fink H., Makino F., 1994, MNRAS 267, 193
- (78) Predehl P., Schmitt J.H.M.M., 1995, A&A 293, 889
- (79) Ptak A., Yaqoob T., Mushotzky R., Serlemitsos P., Griffiths R., 1998, ApJ 501, L37
- (80) Ptak A., Serlemitsos P., Yaqoob T., Mushotzky R., 1999, to appear in ApJS; astro-ph/9808159
- (81) Raymond J.C., Smith B.W., 1977, ApJS 35, 419
- (82) Roberts T.P., Warwick R.S., Ohashi T., 1999, MNRAS 304, 52
- (83) Rush B., Malkan M.A., Spinoglio L., 1993, ApJS 89, 1
- (84) Sandage A., 1961, The Hubble Atlas of Galaxies, Wahington D.C.: Carnegie Institution of Washington
- (85) Sanghera H.S., Saikia D.J., Ludke E., et al., 1995, A&A 295, 629
- (86) Schartel N., Walter R., Fink H., Trümper J., 1996a, A&A 307, 33
- (87) Schartel N., Green P.J., Anderson S.F., et al., 1996b, MNRAS 283, 1015
- (88) Schartel N., Schmidt M., Fink H., Hasinger G., Trümper J., 1997, A&A 320, 696
- (89) Schulz H., Fritsch C., 1994, A&A 291, 713
- (90) Schulz H., Komossa S., Berghöfer T., Boer B., 1998, A&A 330, 823
- (91) Serlemitsos P., Ptak A., Yaqoob T., 1997, in ‘The physics of LINERs in view of recent observations’, M. Eracleous et al. (eds), ASP conf. ser. 103, 70
- (92) Shields J.C., 1992, ApJ 339, L27
- (93) Stauffer J. R., 1982, ApJ 262, 66
- (94) Stockdale C.J., Romanishin W., Cowan J.J., 1998, ApJ 508, L33
- (95) Strickland D.K., Stevens I.R., 1998, MNRAS 297, 747
- (96) Stromberg G., 1925, ApJ 61, 353
- (97) Svensson R., 1994, ApJS 92, 585
- (98) Terashima Y., Kunieda H., Misaki K., et al., 1998, ApJ 503, 212
- (99) Tully R.B., 1988, Nearby galaxies catalog, Cambridge University Press: Cambridge
- (100) Tully R.B., Shaya E.J., 1984, ApJ 281, 31
- (101) Trümper J., 1983, Adv. Space Res. 2, 241
- (102) Unger S.W., Pedlar A., Hummel E., 1989, A&A 208, 14
- (103) van Driel W., van Woerden H., 1994, A&A 286, 395
- (104) Weaver K.A., Wilson A.S., Henkel C., Braatz J.A., 1999, to appear in ApJ; astro-ph/9902269
- (105) Wiklind T., Henkel C., 1990, A&A 227, 394
- (106) Wiklind T., Combes F., Henkel C., 1995, A&A 297, 643
- (107) Wills D., 1967, ApJ 148, L57
- (108) Wills D., Wills B.J., 1976, ApJS 31, 143
- (109) Wisotzki L., Bade N., 1997, A&A 320, 395
- (110) Zasov A.V., Sil’chenko O.K., 1987, Pis’ma Astron. Zh. 13, 455
- (111) Zimmermann H.U., Becker W., Belloni T., et al., 1994, MPE Report 257