An Ultraviolet Fe II Image of SN 1885 in M31
Abstract
Ultraviolet imaging of the remnant of Supernova 1885 in M31 with the Hubble Space Telescope using the F255W filter on the WFPC2 reveals a dark spot of Fe II absorption at the remnant’s known position in the bulge of M31. The diameter of the absorbing spot is , slightly smaller than, but consistent with, the diameter measured in the higher quality WFPC2 Ca II absorption image previously reported by us. The measured ratio of flux inside to outside SNR 1885 in the Fe II image is , consistent with the ratio expected on the basis of a model fit to the previously obtained near-UV FOS spectrum. The observed depth of Fe II absorption suggests that Fe II is fully saturated, with an iron mass in the range –. Besides Fe, ion species Mg I, Mg II, and Mn I probably make some contribution to the absorption from the SN 1885 remnant in the F255W image.
Subject headings:
galaxies: individual (M31) — ISM: supernova remnants — stars: supernovae: individual (SN 1885) — ultraviolet: galaxies — ultraviolet: ISM1. Introduction
SN 1885 (S Andromedae) in the Andromeda galaxy M31 was the first supernova recorded in another galaxy (Zwicky (1958)). The supernova, which occurred just from the central nucleus of M31, reached a peak magnitude of 5.85 in August 1885 (de Vaucouleurs & Corwin (1985)). At the distance of M31, and allowing for 0.23 mag of extinction, this corresponds to an absolute magnitude of (van den Bergh (1994)), some 0.8 mag fainter than the peak magnitude of normal SN Ia (Tammann & Reindl (1999)). This, combined with SN 1885’s unusually fast light curve and reddish color near maximum light (de Vaucouleurs & Corwin (1985)), point to a subluminous Type Ia event similar to SN 1991bg (Filippenko (1997)).
A little over a century later, the remnant of SN 1885 (SNR 1885) was detected through a near-UV filter () as a spot of absorption silhouetted against the starlight of M31’s central bulge (Fesen, Hamilton, & Saken (1989)). Fesen et al. attributed the absorption to the resonance line of Fe I , consistent with the expected presence of a large mass of iron in a Type Ia supernova.
Subsequent near-UV WFPC2 imaging and FOS spectroscopy with the Hubble Space Telescope (HST) revealed that the principal source of absorption is not Fe I, but rather Ca II H & K, freely expanding at velocities up to (Fesen et al. (1999), hereafter Paper 1). In addition to strong Ca II H & K absorption, the FOS spectrum showed similarly broad but weaker absorption from Ca I and Fe I (), and possibly () and ().
The Fe I absorption observed in the FOS spectrum implies a mass of in the ejecta of SNR 1885. The observed relative strengths of the Ca II and Ca I lines indicate that calcium is mostly singly ionized, with , the large upward uncertainty reflecting the near saturation of the Ca II H & K feature. If the ionization state of iron is similar to that of calcium, with –, then the corresponding Fe II mass is –. Such a large mass of iron is consistent with what is expected in normal or subluminous Type Ia supernovae (Höflich & Khokhlov (1996); Höflich, Wheeler & Thielemann (1998); Nomoto, Thielemann, & Yokoi (1984); Nomoto et al. (1997); Woosley & Weaver (1994); Woosley (1997)). Thus on both observational and theoretical grounds there is good reason to expect that the remnant of SN 1885 should show strong Fe II resonance line absorption.
In this paper we report the detection of Fe II absorption in a UV image of SNR 1885 obtained with the WFPC2 on HST.
2. Observations
2.1. Images
The strongest resonance lines of Fe II are the 2600, () and 2382, 2344, () complexes. A model fit to the near-UV spectrum reported in Paper 1 predicts that these Fe II resonance lines should form a broad, deep, blended profile that is fortuitously well matched to the WFPC2 F255W () filter on HST.
Three UV exposures were taken with the WFPC2 and F255W filter over 3 orbits on 16 Feb 1999. The bulge of M31, though bright enough to see with the naked eye in the visible, is quite faint in the UV, and special measures were taken to ensure detection of SNR 1885. While sky brightness was negligible (about 0.01 of the signal), both readout noise and dark counts were significant. Dark counts were reduced by centering SNR 1885 in the WF2 chip, which has the lowest dark count of the WF and PC chips. Readout noise was reduced by minimizing the number of readouts, which was accomplished by on-chip binning (AREA mode), and by extending each exposure over a full orbit, 2700 s each. Finally, the effect of hot and cold pixels was mitigated by dithering the three images along a diagonal line, by two binned pixels (4 unbinned pixels) in each of the horizontal and vertical directions.
The long exposures increased the risk of contamination by cosmic rays, but this risk was considered acceptable in the interest of reducing noise. Cosmic rays were removed by applying the crrej routine in STSDAS to the three exposures. Approximately 10% of the binned pixels in each 2700 s exposure were affected by cosmic rays. Cold pixels were removed by applying the cosmicray routine in IRAF to the negative of the cosmic-ray-removed WF2 image.
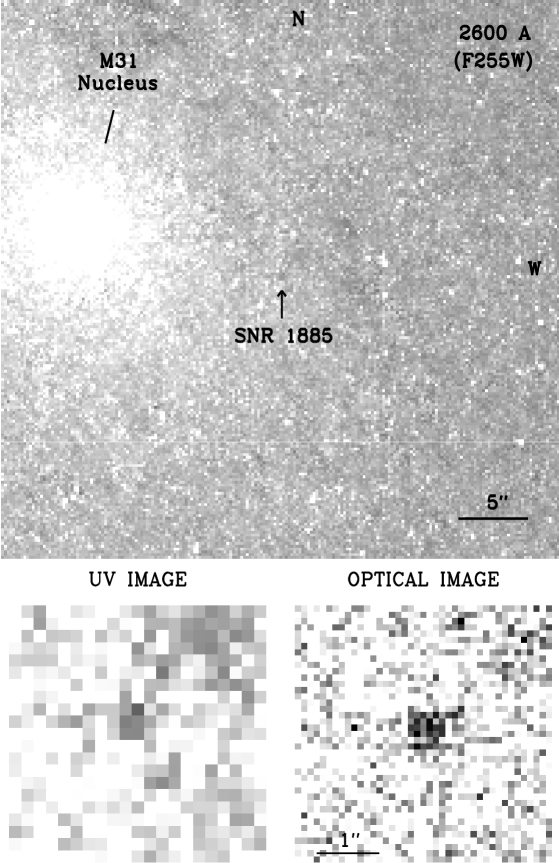
Figure 1 shows the resulting cleaned, coadded WF2 image. SNR 1885 shows up as a dark spot of Fe II absorption. Since the absorbing region at SNR 1885’s position was partially contaminated by cosmic rays in both the first and third images, the pattern of absorption visible in the UV close-up in Figure 1 is determined to a considerable degree by the second image. We estimate the diameter of the dark Fe II spot to be , slightly smaller than, but consistent with, the diameter of the Ca II spot measured in Paper 1. The position of the dark spot is consistent with (within one binned pixel of) that measured from the higher quality Ca II WFPC2 image of Paper 1, which was west and south of the nucleus of M31.
The cleaned image shown in Figure 1 shows of the order of a hundred point sources. These point sources appeared only if the 3 exposures were correctly registered. If instead one or more exposures were misaligned, then most of the point sources disappeared, being rejected as cosmic rays by crrej. Visual inspection in several cases confirmed that the point sources that survive screening by crrej occur in all three exposures, and look like stars on each exposure. We therefore conclude that, while a handful of the point sources may be cosmic ray artifacts, the majority () of them are real stars.
Most of the stars in the Fe II () image are not apparent in the Ca II () image from Paper 1, although the mottled appearance of the Ca II image suggests incipient resolution into stars (Lauer et al. (1998)). That resolved stars appear only at shorter wavelengths is consistent with previous UV imaging of the bulge of M31 by Bertola et al. (1995), Brown et al. (1998), and Lauer et al. (1998). Current observational evidence and theoretical ideas, reviewed by O’Connell (1999), suggest that the UV () light observed in old populations such as the bulge of Andromeda is dominated by low-mass, thin-envelope stars in extreme (hot) horizontal branch and subsequent phases of evolution. The more luminous UV-bright stars, such as those observed here, are undergoing hydrogen- and helium-shell burning in later phases of evolution following core helium burning on the horizontal branch. Further discussion of this issue goes beyond the scope of this paper.
2.2. UV Count Levels for SNR 1885
In the UV absorption image of SNR 1885, the observable quantity that can be compared to theoretical expectation is the fractional depth of absorption produced by the remnant against background starlight from the bulge of M31. The fractional depth of absorption follows from three quantities: (a) the zero-level of counts from dark current plus readout, (b) the background level of counts from starlight in regions adjacent to SNR 1885, and (c) the level of counts in SNR 1885 itself.
The zero-level of counts, from dark current plus readout, was estimated from averages of counts in the darkest regions of the cosmic-ray-removed WF2 image. Measurements at the centers of the darkest dust lanes and in regions farthest from the bulge gave a consistent zero-level of (data numbers) per binned pixel for the coadded image. At a gain of , this corresponds to a zero-level of counts per binned pixel. The uncertainty here is an estimate of the uncertainty in the mean zero-level, not a measure of the variation in pixel to pixel counts, which is larger. The measured zero-level agrees well with the expected zero-level, which comprises dark counts of (the uncertainty is the systematic variation in the dark current of the WF2 chip, while the added to each exposure is the unexposed dark time), plus readout counts of , for a total expected zero-level of per binned pixel.
The level of background starlight against which SNR 1885 is seen in absorption was estimated from clean regions adjacent to SNR 1885. The average and dispersion of the counts in these regions was per binned pixel, equivalent to per binned pixel. Subtracting the zero-level of gives a background starlight level of per binned pixel. This translates into a surface brightness of at in the vicinity of SNR 1885. This surface brightness is consistent with the mean surface brightness measured by IUE of at through a racetrack-shaped aperture centered on the nucleus of M31 (Burstein et al. (1988); see also Bertola et al. (1995); Brown et al. (1998)).
Counts in SNR 1885 itself were estimated from the () block of binned pixels centered at the position measured from the Ca II image of Paper 1. In the Fe II image, the dark absorbing region associated with SNR 1885 appears to extend over a block 2 binned pixels () wide (east-west) by 3 binned pixels () high (north-south). However, since the northern 2 binned pixels in the block lie partially outside the Ca II absorbing region, we conservatively chose to estimate the counts in SNR 1885 only from the southern block of binned pixels.
In this block of binned pixels at SNR 1885’s position, the southern 2 of the 4 pixels were contaminated by cosmic rays in each of the first and third exposures, but the second exposure was clean of cosmic rays. Thus there are 8 independent measurements of counts in the interior of SNR 1885: from 2 pixels in each of the first and third exposures, and from 4 pixels in the second exposure. The average and dispersion of the 8 measurements was per binned pixel per exposure, which at is equivalent to per binned pixel per exposure. The dispersion of is consistent with the dispersion expected from counting noise. The uncertainty in the mean counts is times the dispersion, that is, . Multiplying by 3 to scale to the coadded exposure time gives a mean count of per binned pixel over the combined exposure. Subtracting the zero-level of yields a mean count of per binned pixel in the interior of SNR 1885.
The ratio of the net counts inside SNR 1885 to in adjacent regions yields the observed fractional depth of absorption, .
3. Analysis
The depth of absorption of SNR 1885 observed with the F255W filter, , may be compared to the ratio expected on the basis of a model fit to the 3240– absorption line FOS spectrum reported in Paper 1.
The model spectrum includes absorption from all non-negligible resonance lines of neutral and singly-ionized species of C, O, Mg, Al, Si, S, Ar, Ca, and iron-group elements with ionic charges from 22 to 30, namely Ti, V, Cr, Mn, Fe, Co, Ni, Cu, and Zn. Relative masses of these elements were set equal to those in the normal SN Ia model DD21c of Höflich et al. (1998).
The adopted ejecta density profile is the best fit to the Ca I and Ca II absorption line profiles in the FOS spectrum reported in Paper 1. The best-fit density profile is bell-shaped, a quartic function of free-expansion velocity up to a maximum velocity :
| (1) |
The available data offer no evidence that the ejecta are compositionally stratified: the Ca II and Fe II absorption images of SNR 1885 are consistent with being the same size, and the spectral absorption line profiles of Ca I, Ca II, and Fe I are similarly consistent with being the same. We therefore assume that the compositional structure is fully mixed, so that all elements follow the same density profile.
3.1. Photoionization
As described in Paper 1, the freely expanding ejecta in SNR 1885 appear to be in the process of becoming optically thin to photoionizing radiation, and are currently undergoing a period of photoionization by ambient UV starlight out of neutral into the singly-ionized state, as originally argued by Hamilton & Fesen (1991). Recombination is negligible, with recombination times exceeding a hundred times the age of the remnant.
Calculations of the photoionization of Ca and Fe, the two elements observed in the G400H FOS spectrum, were reported in Paper 1. Here we complete the account by reporting photoionization calculations for all elements of interest.
The expected ratios of singly-ionized to neutral species of various elements depend on how fast they are photoionized out of the assumed initially neutral state by ambient UV starlight. Photoionization timescales can be estimated fairly reliably, at least in the limit where the supernova ejecta are treated as optically thin, since the spectrum of photoionizing starlight in the bulge of M31 is observed directly with IUE (Burstein et al. (1988)) and HUT (Ferguson & Davidsen (1993)). Table 1 lists optically thin photoionization times of all elements considered here, computed as detailed in Paper 1. Photoionization cross-sections were taken from Verner et al. (1996). The uncertainty in the photoionization timescales quoted in Table 1 includes only that arising from uncertainty in the position of SNR 1885 relative to the central nucleus of M31 along the line of sight, as estimated in Paper 1, not uncertainty from the reddening correction or from photoionization cross-sections.
The photoionization timescales given in Table 1 are for optically thin ejecta, whereas in fact the ejecta are expected to be optically thick in broad bands of the ultraviolet, thanks to resonance line absorption by neutrals and singly-ionized species. Moreover, the expanding ejecta would have been more optically thick in the past. An accurate evaluation of the expected ionization structure of SNR 1885 would involve a self-consistent time-dependent computation of photoionization and radiative transfer in the freely expanding ejecta, such as was done for SNR 1006 by Hamilton & Fesen (1988). However, the present data are too limited, and the choice of underlying supernova model too uncertain, to warrant such a computation.
Instead, we estimate the ionization state of different elements from the optically thin photoionization timescales in Table 1, together with the observational datum from the FOS spectrum that calcium is mostly singly ionized, with . According to Table 1, the optically thin photoionization timescale of Ca I is . To reach the observed ionization state of calcium requires an effective time given by , implying . In other words, it is as if calcium has been ionizing not for the full year (at the time of the 1995 FOS observation) age of the remnant, but rather only for – years, because the remnant is only now becoming optically thin to photoionizing radiation.
If this effective time is used instead of the age of the remnant, then the predicted ratio of singly-ionized to neutral species of element Z is
| (2) |
values of which are given in the third column of Table 1. The quoted error on the ratio depends only on the uncertainty in the observed ratio, since uncertainty in the photoionization timescales cancels in the ratio , to the extent that uncertainties in the relative photoionization cross-sections are neglected, as here.
3.2. Model spectrum
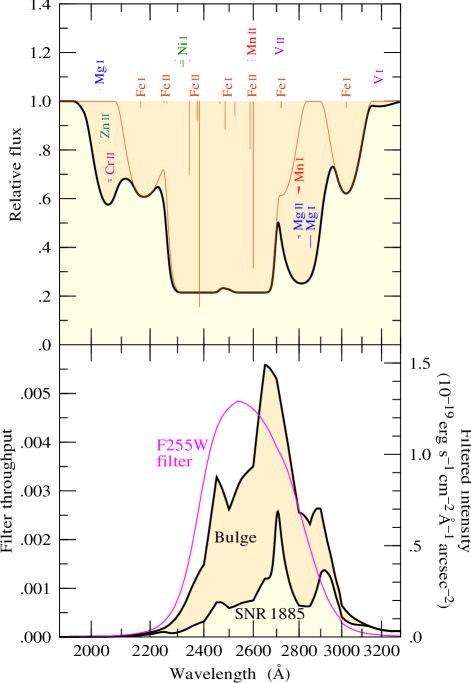
The upper panel of Figure 2 shows a model absorption line spectrum based on the fit to the 3240– spectrum observed with the G400H grating on the FOS (Paper 1). Since singly-ionized to neutral ratios in the best-fit model are skewed to the low end of the allowed range (from which other ionization fractions follow in accordance with eq. [2]), we choose to show not the ‘best-fit’ model, with , but rather a ‘typical’ model, with , the geometric mean of the allowed range –58. This spectrum is similar (differing in the adopted ionization fractions) to the model spectrum shown in Figure 4 of Paper 1, plotted there over the extended range 900–. The range 1900– covered in Figure 2 here includes resonances lines from Mg I, Mg II, Al I, Si I, V I, V II, Cr II, Ti II, Mn I, Mn II, Fe I, Fe II, Ni I, and Zn II, although the contributions from Al I, Si I, and Ti II are negligible.
Starlight to the foreground of SNR 1885 is not absorbed. The fraction of foreground starlight was measured in Paper 1 from the depth and shape of the Ca II H & K lines to be . The model shown in Figure 2 uses the best-fit foreground starlight fraction of .
While the ionization fractions in the model spectrum are fixed by the observed ionization state of Ca, and the relative masses of elements are fixed by Höflich et al.’s (1998) theoretical SN Ia model DD21c, the overall depth of absorption is scaled so that the depth of Fe I absorption is as observed in the FOS spectrum. The corresponding mass of neutral iron is . At the level of ionization adopted in Figure 2, the ionization state of iron is , for a total Fe mass of .
The lower panel of Figure 2 shows the expected spectrum from the bulge of M31 as measured by IUE (Burstein et al. (1988)), normalized to the surface brightness at the position of SNR 1885, and multiplied by the throughput of the F255W filter. The lower panel of Figure 2 also shows the expected filtered and absorbed spectrum at the position of SNR 1885, which is the filtered bulge spectrum multiplied by the absorption curve in the top panel. The ratio of the area under the SNR 1885 spectrum to the area under the bulge spectrum is the predicted fractional depth of absorption, the expected ratio of counts inside to outside SNR 1885 in the F255W image.
The ratio of counts inside to outside SNR 1885 in the model shown in Figure 2 is , consistent with the observed ratio of . Increasing the level of ionization deepens the absorption slightly: for ionization states varying over , the fractional depth of absorption varies over , again consistent with the observed ratio of .
The model level of absorption can be deepened, but only slightly, from to , by reducing the foreground starlight fraction below the best-fit value of , and at the same time reducing the Ca II mass in order to maintain consistency with the depth of the Ca II H & K line profiles observed in the FOS spectrum.
While Fe II is the main contributor to the expected absorption in the F255W filter, Fe I also makes a significant contribution, and Mg I, Mg II and Mn I produce appreciable absorption along the red side of the filter. Because the Fe II absorption is heavily saturated, increasing the amount of Fe II changes little the fractional depth of absorption predicted by the model. The contribution of Fe I cannot be changed, since it is tied to the level of absorption observed with the FOS. Changing the abundance of Mg or Mn on the other hand does have some effect. For example, increasing the abundance of Mg by a factor of 5, which is plausible, deepens the fractional depth of absorption to ; increasing Mg to the point where the Mg lines are fully saturated deepens the fractional depth to .
We therefore conclude that the model predicts a fractional depth of absorption in the rather narrow range . While the observed level of UV absorption, , is consistent with expectation, it does not constrain strongly the amount of Fe II in the ejecta of SN 1885.
4. Summary
Fe II imaging of the remnant of SN 1885 using the F255W filter on the WFPC2 reveals a dark spot of absorption, with position and diameter in accord with those measured from the higher quality WFPC2 Ca II absorption image from Paper 1.
The measured ratio of flux inside to outside SNR 1885 in the Fe II image is , in good agreement with the ratio expected on the basis of a model fit to the near-UV FOS spectrum reported in Paper 1.
The observed depth of the Fe II absorption in SNR 1885 is consistent with Fe II being fully saturated, so that the present data constrain the mass of iron in the supernova ejecta only weakly. In particular, the iron mass is consistent with the range – inferred in Paper 1. Figure 2 of the present paper illustrates a model UV spectrum with . The Figure indicates that, besides iron, ion species Mg I, Mg II, and Mn I probably make some contribution to the absorption in the F255W image.
Finally, the observed depth of Fe II absorption is consistent with the theoretical expectation that the remnant of SN 1885 should have a rich UV spectrum of broad absorption lines. Unfortunately, the faintness of the bulge of M31 in the UV means that the signal-to-noise ratio currently attainable with STIS on HST is marginal. If a UV spectrum with adequate S/N ratio could be obtained, then it should be possible to constrain the mass and velocity distribution of Mg, Si, Ca, V, Cr, Mn, Fe, Co, Ni, Cu, and Zn in the ejecta of SN 1885. From such observations it would be possible to learn a great deal not only about SN 1885 itself, but also about the increasingly important class of subluminous SN Ia in general (Filippenko (1997)).
References
- Bertola et al. (1995) Bertola, F., Bressan, A., Burstein, D., Buson, L. M., Chiosi, C., & di Serego Alighieri, S. 1995, ApJ, 438, 680
- Brown et al. (1998) Brown, T. M., Ferguson, H. C., Stanford, S. A., & Deharveng, J. M. 1998, ApJ, 504, 113
- Burstein et al. (1988) Burstein, D., Bertola, F., Buson, L. M., Faber, S. M., & Lauer, T. R. 1988, ApJ, 328, 440
- de Vaucouleurs & Corwin (1985) de Vaucouleurs, G., & Corwin, H. G. Jr. 1985, ApJ, 295, 287 (dVC)
- Ferguson & Davidsen (1993) Ferguson, H. C., & Davidsen, A. F. 1993, ApJ, 408, 92
- Fesen, Hamilton, & Saken (1989) Fesen, R. A., Hamilton, A. J. S., & Saken, J. M. 1989, ApJ, 341, L55
- Fesen et al. (1999) Fesen, R. A., Gerardy, C. L., McLin, K. M., & Hamilton, A. J. S. 1999, ApJ, 514, 195 (astro-ph/9810002) (Paper 1)
- Filippenko et al. (1992) Filippenko, A. V., et al. 1992, AJ, 104, 1543
- Filippenko (1997) Filippenko, A. V. 1997, ARA&A, 35, 309
- Hamilton & Fesen (1988) Hamilton, A. J. S., & Fesen, R. A. 1988, ApJ, 327, 178
- Hamilton & Fesen (1991) Hamilton, A. J. S., & Fesen, R. A. 1991, in Supernovae, 10th Santa Cruz Summer Workshop in Astronomy and Astrophysics, ed. S. E. Woosley (Berlin: Springer-Verlag), 656
- Höflich & Khokhlov (1996) Höflich, P., & Khokhlov, A. 1996, ApJ, 457, 500
- Höflich, Wheeler & Thielemann (1998) Höflich, P., Wheeler, J. C., & Thielemann, F.-K. 1998, ApJ, 495, 617
- Lauer et al. (1998) Lauer, T. R., Faber, S. M., Ajhar, E. A., Grillmair, C. J., & Scowen, P. A. 1998, AJ, 116, 2263
- Nomoto, Thielemann, & Yokoi (1984) Nomoto, K., Thielemann, F.-K., & Yokoi, K. 1984, ApJ, 286, 644
- Nomoto et al. (1997) Nomoto, K., Iwamoto, K., Nakasato, N., Thielemann, F.-K., Brachwitz, F., Tsujimoto, T., Kubo, Y., & Kishimoto, N. 1997, Nuclear Physics A, 621, 467c
- O’Connell (1999) O’Connell, R. W. 1999, ARA&A, to appear (astro-ph/9906068)
- Tammann & Reindl (1999) Tammann, G. A., & Reindl B. 1999, Proc. Supernova Workshop, Assergi, Sep 29–Oct 2 1998 (astro-ph/9903220)
- van den Bergh (1994) van den Bergh, S. 1994, ApJ, 424, 345
- Verner et al. (1996) Verner, D. A., Ferland, G. J., Korista, K. T., & Yakovlev, D. G. 1996, ApJ, 465, 487
- Woosley (1997) Woosley, S. E. 1997, ApJ, 476, 801
- Woosley & Weaver (1994) Woosley, S. E., & Weaver, T. A. 1994, ApJ, 423, 371
- Zwicky (1958) Zwicky, F. 1958, Handbuch der Physik, 51, 766 (Berlin: Springer-Verlag)
| Element | Photoionization timeaa Ionization timescale in optically thin limit; actual ionization timescale is probably longer. | Z II/Z Ibb Predicted ratio of singly-ionized to neutral abundance. |
|---|---|---|
| (yr) | ||
| C | ||
| Occ Ionization potentials of these elements exceed the Lyman limit. | long | |
| Mg | ||
| Al | ||
| Si | ||
| S | ||
| Arcc Ionization potentials of these elements exceed the Lyman limit. | long | |
| Ca | ||
| Ti | ||
| V | ||
| Cr | ||
| Mn | ||
| Fe | ||
| Co | ||
| Ni | ||
| Cu | ||
| Zn |