ROSAT X-ray observations of 3CRR radio sources
Abstract
Over half the 3CRR sample of radio galaxies and quasars has been observed in X-rays with ROSAT pointed observations, and we present results from these observations, discussing many of the sources in detail. The improved spatial resolution of ROSAT over earlier missions allows a better separation of the nuclear and extended components of the X-ray emission. We investigate the relationship between nuclear X-ray and core radio luminosity and show that our results support a model in which every radio galaxy and quasar has a beamed nuclear soft X-ray component directly related to the radio core. We report evidence for rich cluster environments around several powerful quasars. These X-ray environments are comparable to those of high-redshift radio galaxies.
keywords:
X-rays: galaxies1 Introduction
Soft X-ray emission from radio galaxies and radio-loud quasars probes a range of physical conditions. On the largest scales, the X-rays are the thermal emission of hot intracluster gas. In general we do not expect a strong quantitative relationship between this emission and the radio properties of the galaxy or quasar, although there is direct evidence for the influence of one on the other in a few well-studied objects [e.g. NGC1275, Böhringer et al. (1993); Cygnus A, Carilli, Perley & Harris (1994); 3C 449, Hardcastle, Worrall & Birkinshaw (1998c)].
On smaller scales, X-ray emission may come directly from components of the radio source, as synchrotron, inverse-Compton, or synchrotron self-Compton (SSC) radiation. There is evidence for X-ray synchrotron emission in the jets of M87 (Biretta, Stern & Harris 1991) and Centaurus A (Turner et al. 1997) and in a hotspot of 3C 390.3 (Prieto 1997), and for a synchrotron self-Compton process in the hotspots of Cygnus A (Harris, Carilli & Perley 1994). Moreover, inverse-Compton scattering of CMB or active nucleus photons may be responsible for extended emission seen in Fornax A (Feigelson et al. 1995) and 3C 219 (Brunetti et al. 1998). However, in general such kpc-scale X-ray emission is likely to be weak compared to that due to hot gas.
Inverse-Compton processes are more important on parsec scales, where electron and photon densities are much higher. Such emission is unresolved by present-day X-ray observatories. Synchrotron emission, along with thermal emission from the central engine and accretion disc, may also contribute to an unresolved nuclear component. Obscuration has a strong effect on what is observed. Unified models of radio sources (e.g. Urry & Padovani 1995) require an obscuring ‘torus’ of dusty material around the central engine, so that nuclear optical continuum and broad lines are not seen in objects classed as radio galaxies. This torus should also obscure soft X-ray emission originating close to the central engine, leading to suggestions (e.g. Crawford & Fabian 1996a) that soft X-ray emission from powerful radio galaxies should in general be dominated by the extended thermal component. In hard X-rays, a strongly absorbed nuclear component has been found in a few radio galaxies, consistent with this picture (e.g. Ueno et al. 1994).
However, the radio-related component of the nuclear emission may originate on scales larger than those of the torus. Although not affected by obscuration, it would be rendered anisotropic by bulk relativistic beaming. There is substantial evidence that unabsorbed radio-related non-thermal X-rays are seen in radio galaxies. Recent work has strengthened the conclusion of Fabbiano et al. (1984) that the correlation between nuclear soft X-ray and radio-core luminosity implies a jet-related origin for the X-ray emission, as high-resolution X-ray observations have allowed point-like and extended components to be separated (Worrall & Birkinshaw 1994; Edge & Röttgering 1995; Worrall 1997). A relativistically beamed radio-related component almost certainly dominates the soft X-ray emission in core-dominated quasars and BL Lac objects.
A large, unbiased sample of objects is most effective for investigating the origins of X-ray emission in extragalactic radio sources. The 3CRR sample (Laing, Riley & Longair 1983; Laing & Riley, in preparation) is a flux-limited sample of the brightest radio galaxies and quasars in the Northern sky. It includes all objects with 178-MHz flux density greater than 10.9 Jy (on the scale of Baars et al. 1977) having and . Excluding the starburst galaxy 3C 231 (M82), which will not be considered further in this paper, it contains 172 objects, of which, at the time of writing, 89 have been observed (either intentionally or serendipitously) in ROSAT pointed observations at off-axis angles less than 30 arcmin (and usually on-axis). Most sources in the sample are powerful, distant FRII (Fanaroff & Riley 1974) radio galaxies and quasars, and almost all are well-studied in the radio and optical, making 3CRR an ideal sample for a comparison of radio and X-ray properties. Although such comparisons have been carried out previously (e.g. Fabbiano et al. 1984; Crawford & Fabian 1995, 1996a; Prieto 1996), none has made full use of ROSAT’s high spatial resolution to try to distinguish between different physical origins for the X-ray emitting components, and in particular to test the suggested relationship between X-ray and radio core emission.
In this paper we tabulate the X-ray count rate from each of the 89 ROSAT-observed 3CRR sources and present our best estimates of the count rate associated with a central unresolved component. We use radio data from the literature to discuss whether a coherent picture of the physics can be derived from the X-ray and radio observations. Complex sources are discussed in detail and we provide references to existing studies. Some objects are the subject of more detailed work which will appear elsewhere.
Throughout the paper we use a cosmology in which km s-1 Mpc-1 and . Spectral index is defined in the sense that flux density is proportional to .
2 Data and analysis
Table 1 lists the 89 ROSAT-observed sources. [The ROSAT Master observation catalogue lists a further three 3CRR objects (3C 34, 3C 336 and 3C 438) for which data were not public in time for our study. With the demise of ROSAT, further data will not be forthcoming.] Optical and radio classifications and redshifts come largely from the updated 3CRR tables of Laing & Riley (in prep.), updated with more recent spectroscopic observations where available (e.g. Laing et al. 1994; Laing, private communication; Jackson & Rawlings 1997). The classification of objects by whether or not they have strong high-excitation nuclear emission lines dates back to Hine & Longair (1979); we use the definition of Laing et al. (1994) who define high-excitation objects as having [OIII]/H and equivalent widths of [OIII] Å. Low-excitation objects are excluded from many radio galaxy-quasar/broad line radio galaxy unified models (e.g. Barthel 1994) because broad lines in their spectra would be very hard to detect, so that there is no optical evidence for their orientation to the line of sight. They also appear to have rather different radio properties from high-excitation radio galaxies (Jackson & Rawlings 1997, Hardcastle et al. 1998b).
For each source we give the ROSAT observation request (ROR) number of the primary data set we have used and the source’s angular offset from the pointing direction where this is significantly different from zero. Because we are most interested in the sources’ spatial properties in this paper, we have in general preferred HRI observations over PSPC where both exist (the 50 per cent encircled energy radii are and arcsec for the PSPC at 1 keV and the HRI, respectively), though we have checked all HRI results against any existing PSPC data for consistency. Where an X-ray source is reasonably bright, and there is no obvious evidence for significant source extension, we have used an on-source circle of radius arcmin and taken background from an annulus of radii 1 and 2 arcmin about the source (for HRI data) or arcmin and 2 and 3 arcmin (for PSPC data), taking care in all cases to exclude unrelated contaminating sources. Where a smaller source circle was used, we have corrected the derived count rate to that expected from the standard source and background regions, for consistency (this affects only a few sources). Counts and background-subtracted count rates for the few sources observed significantly off-axis are corrected for the effects of vignetting (calculated at 1 keV) and any additional obscuration. Upper limits on the total (resolved plus unresolved) counts, quoted where a source was undetected, are limits, derived by applying Poisson statistics to a detection cell of a size appropriate to the off-axis angle of the source [for on-axis sources, the sizes used are arcsec (HRI) and arcsec (PSPC)].
The well-known ‘aspect smearing’ problem of the HRI (e.g. Morse 1994) means that we cannot reliably distinguish unresolved from resolved components in HRI data simply by fitting the nominal HRI point response function (PRF), and determining the number of counts associated with a possible central point source necessarily involves a certain amount of interpretation. Our procedure, justified by detailed work on sources known to be point-like, is that where the X-ray emission from a source is obviously compact, we treat it all as point-like if its radial profile is consistent with a nominal HRI PRF convolved with a Gaussian of FWHM a few arcseconds. If the statistics are too poor to make this judgement, we use the total measured counts as an upper limit on the counts in a possible point-like component.
Where there is emission which is unambiguously extended we attempt to separate out a compact, possibly AGN-associated, component. Our best approach, appropriate where the data are roughly radially symmetrical, is to fit models convolved with the instrumental PRF to the radial profile of the emission. -models (e.g. Sarazin 1986) are physically appropriate for extended emission originating from hot gas in hydrostatic equilibrium, and provide a useful way of characterising extended emission even when the origins of the emission are not known. In all such fits the parameter is allowed to take the values 0.35, 0.5, 0.667 and 0.9, while core radius is varied over a wide range, and the central normalisations of both the model and an unresolved central source are allowed to vary, so that the counts associated with the best-fitting components need not sum exactly to the total counts obtained directly from the data. We calculate counts in the best-fitting model from the integral of the model over the source and background regions.
In radial-profile fitting we are hampered, in the case of HRI data, by our inadequate knowledge of the PRF for a particular observation because of aspect-smearing effects. Some techniques exist to circumvent this problem. Where a bright nearby pointlike source is available in the image, it is possible to use it as a template to determine the PRF applicable to the observation (e.g. Hardcastle, Lawrence & Worrall 1998d), but such sources are rare. Another possible technique is ‘dewobbling’ the source (Harris et al. 1998b). The aspect errors in HRI observations are thought to arise from pixel-to-pixel gain variations in the aspect camera CCD. The spacecraft wobble exacerbates this problem because it causes the aspect stars to move across the CCD on short time-scales. The ‘dewobble’ technique relies on binning the data according to the phase of the wobble, and then recentroiding to correct for aspect errors; so long as the satellite roll angle and the properties of the CCD are constant, the aspect error should be a function of the wobble phase only. Harris et al. provide iraf/PROS scripts to perform this task. The main disadvantage of the method is that it is applicable only to sources with a relatively bright unresolved component (of order 0.1 counts s-1); this rules out its application to many of the sources in the sample.
In general we expect sources that have been dewobbled to show some deviation from the nominal PRF on small scales; the procedure of stacking by centroid should tend to produce a profile that is more sharply peaked than the true PRF, as can easily be understood by considering the limit of a single photon in each bin, but on the other hand errors in centroiding and restacking will broaden the profile. Where HRI observations are clearly dominated by a point-like component (e.g. quasars) but may also contain some extended emission, we sometimes use the central regions of the (dewobbled) radial profile of the source itself to determine a broadened PRF for model fitting; the procedure here is to fit the central part of the radial profile with the nominal HRI PRF convolved with a Gaussian, assuming that the central source is pointlike. All cases where dewobbling or a broadened PRF have been applied are discussed individually in section 3. Where neither method is applicable we assume that the nominal PRF (David et al. 1997) applies.
An error in the automatic (SASS) processing of HRI observations has recently been discovered (Harris 1999). This introduces an additional aspect uncertainty into HRI data taken before 1997 January 17. We have applied the SAO-provided scripts which approximately correct this problem to all affected HRI observations in which we have carried out radial profile fits. In general the scripts make a small difference to the radial profiles of our target sources, most noticeable in those sources, mainly quasars, which are dominated by a central point-source component. In no case does the correction cause a previously existing extended component to disappear.
The PRF of the PSPC is sufficiently broad that it is not expected to be significantly affected by aspect problems, and PSPC data are not affected by the SASS processing error. When fitting models to data taken with this instrument, we determine an energy-dependent PRF from the data in the energy band 0.2–1.9 keV (where the PRF is well known). For consistency of presentation, the results of model fitting are scaled to the full 0.1–2.4 keV passband of ROSAT using an appropriate spectral model.
3 Notes on individual sources
In this section we comment on any features of particular interest in the X-ray observations, and discuss our analysis of complicated objects. Where we have separated a source into extended and compact components, values for the best-fitting parameters of the -model and point source are listed in Table 3.
As well as the core radius and for the best-fitting -model, we tabulate the central surface brightness . This quantity may be converted to an estimate of the central proton density of the X-ray emitting gas, . From Birkinshaw & Worrall (1993), eq. 10, to within a factor of 2
where is in counts s-1 arcsec-2, is the core radius in arcsec and is the luminosity distance to the source in Gpc. , the factor relating count rate to distance-normalised emission measure. has a relatively weak dependence on spectral shape, since the passband of ROSAT is broad. Within a factor of about 1.5, for temperatures between 1 and 5 keV, has the value m-5 s count-1 for HRI data and m-5 s count-1 for the PSPC. The central density can be used to calculate the central cooling time, using the relation given by Sarazin (1986):
where is in keV and in years.
Where we quote a central density or cooling time in the present paper, we have calculated the value of appropriate for the source’s redshift, and estimated temperature.
3.1 3C 28
This low-excitation radio galaxy lies in the double X-ray cluster Abell 115 (Feretti et al. 1984; Worrall, Birkinshaw & Cameron 1995). It has a relaxed double radio structure with no detected radio core, although thin radio filaments emerging from the host galaxy may suggest that it is not an inactive object (Leahy, Bridle & Strom 1998). 3C 28 lies in the northern component of the X-ray cluster, with its lobes straddling (within the ROSAT pointing accuracy) the peak in the X-ray surface brightness. Radial profile fitting shows the source to be significantly extended (Table 3). A point-like component is not significant on an F-test. It seems likely that most of the emission from the central peak originates in the central regions of a cooling flow, as suggested by Feretti et al. (1984). We therefore take the best-fit point-like component as an upper limit on the AGN contribution.
3.2 3C 31
Our results for this FRI radio galaxy (NGC 383) are consistent with Trussoni et al. (1997). PSPC images show extended emission, but the HRI detects only point-like emission, with a component coincident with 3C 31’s nucleus. Emission coincident with NGC 380 and NGC 379, other members of 3C 31’s group, is also detected.
3.3 3C 33
Results for this low-redshift FRII radio galaxy are taken from Hardcastle, Birkinshaw & Worrall (1998a). The source is unresolved with the HRI.
3.4 3C 48
The HRI data for this compact steep-spectrum quasar seem to show a strong E-W elongation, but this is mainly contributed by a single observation interval (OBI). The observations of 3C 48 consist of 7 OBIs taken over the course of three days at three distinct nominal satellite roll angles. We first split the data into these three ‘stable roll angle intervals’ and then applied the dewobbling procedure. The result was a clear reduction in the east-west elongation of the data. The radial profile of the source was still not well fit with a nominal HRI PRF; there were large contributions to the fitting statistic both from the inner bins, on scales of a few arcseconds, and from the bins on scales of 20–50 arcsec. We therefore used the central part of the radial profile as a template for the PRF. This left an excess component of extended X-ray emission, on scales of tens of arcsec, which we interpret as emission from hot gas; results are given in Table 3. PSPC data are adequately modelled as a point source but not inconsistent with the HRI-derived model. For any reasonable temperature assumption, the bright, compact extended X-ray emission implies rapid cooling with mass deposition rates of several hundreds of solar masses per year. This would tend to support the cooling-flow model of Fabian et al. (1987) for the optical emission-line regions. The X-ray emission from 3C 48 is discussed in more detail elsewhere (Worrall et al., in preparation).
3.5 3C 61.1
A faint point source is detected close to the pointing centre of the HRI observation, but it is arcsec from the core of the FRII radio galaxy (Laing & Riley, in prep.), a larger offset than would be expected if the sources were associated (see Fig. 1). The X-ray source appears to be almost coincident with a point-like optical object in the field, about 30 arcsec to the east of 3C 61.1’s host galaxy (see the plates of Gunn et al. 1981), which is presumably a background active nucleus. We therefore derive an upper limit on the X-ray counts associated with the radio position.
3.6 3C 84
This source (Perseus A, NGC 1275) lies in the centre of the Perseus cluster, and in a strong cooling flow. Remarkable shell-like structure is apparent in the HRI image, which Böhringer et al. (1993) relate to displacement of thermally emitting gas by the radio lobes. Consequently it is hard to measure a good count rate for the central component; radial fitting is not appropriate. The counts we associate with the unresolved source are measured from a 15-arcsec radius source circle and a 15–25-arcsec background annulus in the centre, rather than by fitting to the data. For consistency with the other objects, the counts we tabulate are corrected to our standard 1-arcmin source circle and 1–2-arcmin background region. The total counts listed are for a 7-arcmin source circle and 7-8 arcmin background region.
3.7 3C 98
This nearby FRII galaxy shows some extended X-ray emission on scales of tens of arcseconds, in addition to a compact central source (Table 3).
3.8 3C 123
This peculiar FRII radio galaxy is dominated by an X-ray extended component. Radial profiling does not require a core component, but the X-ray distribution is complex. Since radial profiling may not be appropriate, we derive an upper limit on the core contribution from a 15-arcsec source circle around the brightest X-ray peak. The counts we tabulate are corrected to our standard 1-arcmin source circle and 1–2-arcmin background region. We will discuss this object in more detail elsewhere (Hardcastle et al., in preparation).
3.9 3C 212
This quasar is unresolved with the PSPC. Our count rate is consistent with that measured from the same data by Elvis et al. (1994).
3.10 3C 215
This object is a well-studied lobe-dominated quasar. Both the co-added HRI image used in our analysis and, to a lesser extent, the individual datasets from which we generated it show elongation of the X-rays in a NNW-SSE direction; the weak nearby point sources in the field also show elongation roughly in this direction, so we attribute the elongation to aspect-smearing problems. The long observation contains many different OBIs and satellite roll angles, and to apply dewobbling it was necessary to drop some of the shorter intervals with insufficient counts for good centroiding, leaving 65 ks, or 75 per cent of the available data. The restacked image is indeed narrower and without significant elongation. Radial profile fits, using a PRF based on the inner regions of the source, show the dewobbled source to have a significant extended component (Table 3). Galaxy counts around 3C 215 also suggest a rich cluster environment (Ellingson, Yee & Green 1991) and some extended line emission is seen (Crawford & Fabian 1989) so it seems likely that we are seeing emission from hot cluster gas, perhaps influencing the distorted structure of the radio source (Bridle et al. 1994). The core radius corresponds to 140 kpc and the cooling time of the gas will be less than years for keV.
3.11 3C 219
This broad-line radio galaxy (Laing et al. 1994) shows largely point-like emission in the short archival PSPC observation, but there is some evidence of excess counts in the radial profile on scales of 40–100 arcsec. This may be related to the poor optical cluster known to be associated with 3C 219 (Macdonald, Kenderdine & Neville 1968), though Brunetti et al. (1998), using HRI observations not yet in the public archive, suggest instead that the extension is inverse-Compton emission associated with the radio lobes, while not ruling out a thermal origin for some or all of it. A point-source fit to the PSPC radial profile has with 9 degrees of freedom, a barely acceptable fit, while the addition of the -model (Table 3) improves the fit significantly. The point-like component dominates, contributing per cent of the counts in the 2-arcmin source circle.
3.12 3C 220.1
Our results for this FRII radio galaxy are taken from Hardcastle, Lawrence & Worrall (1998d). The source is decomposed into point-like and extended components (Table 3). The counts allocated to the point source here neglect any possible contribution from a cooling flow.
3.13 3C 220.3
Our results for this undetected FRII radio galaxy are taken from Worrall et al. (1994).
3.14 4C 73.08
This low-excitation FRII source is in a crowded X-ray field. The optical position is coincident with a weak extended X-ray source, but there are too few counts for adequate radial profile fitting. We take the counts in a 2-arcmin source circle as an upper limit to point-like emission.
3.15 3C 254
The radial profile of the PSPC observation of this quasar is poorly fit by a point-source model, with positive residuals on scales between 30 and 60 arcsec. The HRI observation detects a weak secondary source 30 arcsec to the E, unidentified on Digitized Sky Survey (DSS)111Available on the World Wide Web at URL: http://stdatu.stsci.edu/dss/ plates, and too close to the quasar to be resolved by the PSPC. The secondary source is not responsible for all of the extension seen in either the HRI or PSPC data; it may, in any case, be a clump in extended thermal emission. There is optical evidence that 3C 254 lies in a cluster of galaxies (Bremer 1997), and there is no evidence in the HRI images for X-ray emission from the foreground galaxy to the NE of the quasar reported by Bremer (1997). We fit to the radial profile of the PSPC observations, where there are more counts and so better statistics; dewobbling has no effect on the results. The results are tabulated in Table 3. The counts in the extended component indicate a luminous cluster; no cooling flow is required unless keV, but we cannot rule out a contribution to the point-source component from unresolved cooling gas. If we assume keV, then the rest-frame 0.3–3.0 keV luminosity of the extended component is W, consistent with the estimate of Crawford & Vanderreist (1997) who examine the spectrum of the same PSPC data. Fitting to the radial profile of the dewobbled HRI data gives a smaller and somewhat less luminous extended component, but the results are consistent within the uncertainties on the fitted parameters.
3.16 3C 263
After dewobbling the long HRI observation of this quasar, known to lie in a cluster of Abell richness , we find no significant evidence of extended emission. This is consistent with the results of an earlier study using the same data by Hall et al. (1995).
3.17 3C 263.1
This FRII radio galaxy was not detected by Crawford & Fabian (1996a) in a far-off-axis PSPC observation. However, an HRI observation detects a source within 6 arcsec of the optical position of 3C 263.1, with a count rate consistent with the upper limit of Crawford & Fabian. There is no obvious background source on the optical plates of Laing et al. (1978) that might be responsible for the X-ray emission. The HRI emission is compact and adequately fitted by a broadened PRF. The source is surprisingly bright if it is due only to nuclear X-ray emission, given the weak flux of the radio core (Liu, Pooley & Riley 1992). Up to per cent of the X-ray flux may be contributed by a cluster of comparable size to that seen in 3C 220.1, but the data do not require this, so for consistency we treat the source as pointlike.
3.18 3C 264
This narrow-angle-tail radio galaxy lies arcmin away from the X-ray centroid of the cluster Abell 1367, and 8.4 arcmin off-axis in the PSPC observation. We use the parametrised off-axis PSPC PSF (Hasinger et al. 1995) to perform a radial-profile fit in a standard 2-arcmin source region, which excludes most of the emission from the cluster. The results (Table 3) suggest that there is some extended emission associated with the radio source, in addition to a strong point-like component. Our result is consistent with the count rate quoted by Edge & Röttgering (1995).
3.19 3C 270.1
50 arcsec to the NW of this high-redshift quasar there is a second compact source, associated with a faint compact source on DSS plates and so probably another AGN. Our counts are taken from a 30-arcsec source circle around the quasar, corrected to our standard 2-arcmin source circle and 2–3-arcmin background annulus. We are unable to say whether the apparent extended emission around 3C 270.1 is related to our target source or the other object.
3.20 3C 272.1
This nearby FRI source (M84) is extended in the X-ray. Our results are taken from a fit of point source plus model (Table 3).
3.21 Abell 1552
The cluster is detected in the short PSPC observation, but no point-like excess is found at the optical position of the radio galaxy.
3.22 3C 274 (M87)
Harris, Biretta & Junor (1997) present evidence that the X-ray core of M87 varies by per cent on time-scales of years. We use their core count rate for June 1995. The total counts tabulated are for the source region they define, a 276-arcsec radius circle with background taken from a 280–300 arcsec annulus, both centred around the X-ray core, and our results are consistent with theirs.
3.23 3C 275.1
Both HRI and PSPC data are available for this quasar. The PSPC data are confused by weak extended emission from the nearby spiral galaxy NGC 4651; when this is removed, the data show a point-like source. The longer HRI observation shows a profile slightly broader than the nominal PRF, characteristic of a source affected by aspect smearing. When the profile is fitted with a broadened PRF, there is some indication of additional extension on scales of 20–60 arcsec. Using the broadened PSF, we fit an additional -model component, with results tabulated in Table 3. As in 3C 215, the galaxy counts of Ellingson et al. (1991) imply a rich cluster environment for this source, so it is likely that the extended emission we detect is real and due to hot intracluster gas. Hinten & Romanishin (1986) suggest that the extended emission-line region around the source is due to a cooling flow, but the best-fitting -model does not require cooling.
3.24 3C 277.2
Our count rate for this faint FRII radio galaxy (taken from a 30-arcsec source circle and corrected to our standard 1-arcmin source region) is consistent with that of Crawford & Fabian (1995).
3.25 3C 280
Worrall et al. (1994) describe the separation of the PSPC emission from this high-redshift FRII radio galaxy into compact and extended components. The archival HRI data are consistent with such a decomposition (cf. Dickinson et al. 1998), and so we use the Worrall et al. results here (Table 3).
3.26 3C 288
Because this radio galaxy is 21 arcmin off-axis in the PSPC observation, uncertainties in the PSPC PRF at this radius mean that we have not been able to separate extended and compact emission, although the source is at least partially extended. 3C 288 appears in the optical to be the dominant member of a cluster (Wyndham 1966) and so it is not surprising that extended X-ray structure is seen. Interactions with the cluster gas may be the reason for its unusual structure in the radio (Bridle et al. 1989); it is one of a small class of reasonably powerful, distorted double sources with strong jets but weak hotspots, which often have a low-excitation optical spectrum and an association with a cluster [other good examples are 3C 401 and 3C 438, Hardcastle et al. (1997); the class is similar in radio properties to the ‘jetted doubles’ of Law-Green et al. (1995)]. The available X-ray data are unfortunately not good enough to test whether 3C 288 lies in a cooling flow, a suggested origin for this type of source.
3.27 3C 294
This high-redshift radio galaxy was detected in PSPC observations by Crawford & Fabian (1996a). The counts we measure from a long archival HRI observation are consistent with the result of Crawford & Fabian within the errors. The source appears extended, but the low count rate prevents us from extracting a reliable radial profile. Dickinson et al. (1998) reach similar conclusions.
3.28 3C 295
This radio galaxy is known to lie in an optical cluster (e.g. Yates, Miller & Peacock 1989) and to have extended X-ray emission (Henry & Hendriksen 1986). Our best-fitting characterisation of the HRI emission with a -model and point source is tabulated in Table 3. Acceptable fits are found with no point-source contribution. Our values for core radius and are consistent with the findings of Henry & Hendriksen. The point-source contribution is much lower than their adopted value (which would correspond to approximately 115 counts in the HRI observation, on the assumption of a power-law spectrum and galactic absorption) but agrees within the errors. Our best-fitting model is also consistent with Neumann (1999). The best-fitting model implies rapid cooling, with a mass deposition rate of some hundreds of solar masses per year, consistent with the picture of Henry & Hendriksen (1986), and the cooling time at the core radius is less than the Hubble time, so that the isothermal -model is not physically consistent. When we fit the data with the most recent versions of the cooling-flow models used by Hardcastle et al. (1998d), we find that the dependence of pressure on radius must be weaker than the relation used in our earlier work, because the HRI emission is not strongly centrally peaked; for example, acceptable fits are obtained for a model with , , , with the cooling time at the core radius being yr. This fit is not as good as the simple model together with a weak point source, and the cooling time is rather short, but it fits the data without the need for a central radio-related contribution. For consistency with our other analyses, we use the point-source component derived from -model fitting as our best estimate of the unresolved contribution to the X-ray emission.
3.29 3C 303
This broad-line radio galaxy is a strong point source in the X-ray. In the HRI image a faint point-like component, containing counts, is approximately coincident (after aligning the radio core and X-ray centroid) with the western hotspot of 3C 303. We may therefore be seeing an X-ray counterpart to the radio and optical hotspots already known in this object (e.g. Meisenheimer, Yates & Röser 1997). If so, this would be one of only a very few X-ray hotspots known. [The other examples are the hotspots of Cygnus A (Harris et al. 1994) where the emission mechanism is likely to be synchrotron self-Compton scattering, the western hotspot of Pictor A (Röser & Meisenheimer 1987, and unpublished ROSAT data) where the emission mechanism is not clear, and the northern hot spot of 3C 390.3 (Prieto 1997, and see below) which is interpreted as a synchrotron X-ray source.] However, the position of this X-ray component, given the low count rate, is at least equally consistent with that of a quasar 4 arcsec to the SW of the optical source identified with the hot spot (Kronberg 1976; Kronberg et al. 1977), and it seems most likely that the X-ray emission comes from this quasar (see Fig. 2). If the X-ray emission is related to the hot spot, then its 1-keV flux of 7.6 nJy means that it is much too bright [using the code of Hardcastle, Birkinshaw & Worrall (1998a)] to be synchrotron self-Compton emission unless the source is very far from equipartition. It could be synchrotron emission if the electron energy distribution is a steep power law (electron energy index of , corresponding to the observed radio and radio-optical spectral indices of ) and extends to very high energies, with a high-energy cutoff near the region corresponding to X-ray emission.
3.30 3C 309.1
In spite of the suggestion by Forbes et al. (1990), based on the presence of a luminous extended emission-line region, that this quasar lies in a massive cooling flow, its X-ray emission is well fitted by a PSPC PRF. As for 3C 254, we cannot rule out the possibility of a cooling-flow contribution to the point-source flux, which would need to be present on smaller scales than the PSPC resolution (i.e. about 100 kpc at the redshift of 3C 309.1).
3.31 3C 310
This relaxed double radio galaxy (van Breugel & Fomalont 1984) shows clear extended X-ray emission, first detected with Einstein by Burns, Gregory & Holman (1981). The HRI image shows the X-ray emission to be centred on the radio galaxy, with some evidence for east-west extension in the very central regions; because some other sources in the field seem to be extended in a similar direction, we are inclined to treat this as an aspect-induced artefact. When we characterise the emission with a model and point source (Table 3), is not well constrained but large core radii (between 40 arcsec for and 140 arcsec for ) provide the best fit to the data. No model without a point-source contribution is a good fit.
3.32 3C 324
We find a very weak extended source close to the catalogued position in the HRI observation of this high-redshift radio galaxy. Our count rates for this source are consistent with those of Crawford & Fabian (1996a) and Dickinson et al. (1998).
3.33 NGC 6109 (4C 35.40)
Our results for this FRI radio galaxy are consistent with those of Feretti et al. (1995), who find a compact source. Radial-profile fitting suggests that some of the emission is extended (Table 3).
3.34 3C 334
This quasar appears point-like in a PSPC observation. A long HRI observation shows some extension in a NW-SE direction but, as this is in the same direction as a ‘hot line’ at the edge of the image, it seems plausible that much of the extension is due to aspect smearing. However, when the source is dewobbled, radial profiling reveals some residual extension on scales of tens of arcseconds. The best-fitting model (Table 3) has significant extended emission. Such a model is consistent with the PSPC radial profile, although the total count rate in the HRI observation is considerably higher than would be inferred from the PSPC data, suggesting variability. There is no evidence in the galaxy counts of Yee & Green (1987) that 3C 334 lies in a particularly rich environment, but Crawford & Fabian (1989) show it to have some extended optical line emission and Hintzen (1984) presents an optical plate with a number of nearby galaxies, including an apparent close companion. The compact nature of the extended emission means that a cooling flow is required unless the temperature is very high.
3.35 3C 338
This radio galaxy, located in the cluster A2199, shows a complex and asymmetrical X-ray structure (Owen & Eilek 1998) and is also unusual in the radio. Radial profiling is clearly not particularly appropriate, but a simple application to the inner regions of the source gives the decomposition tabulated here, which represents our best estimate of the core contribution.
3.36 NGC 6251
This FRI radio galaxy shows both extended and compact emission in the PSPC observation (Birkinshaw & Worrall 1993; Worrall & Birkinshaw 1994). The HRI observation detects mainly the compact core, but there is also a weak but significant detection of a component arcsec to the NW of the core, coincident with a bright knot in the base of the jet (Perley, Bridle & Willis 1984). [This component is not to be confused with the possible jet-related X-ray emission claimed by Mack, Kerp & Klein (1997), which is at much larger distances from the nucleus and is not visible on the HRI image.] The knot contributes only counts to the total. The number of counts in the unresolved component is consistent with the results of the spatial decomposition of Worrall & Birkinshaw (1994), a result insensitive to the spectrum of the source. We cannot rule out a thermal contribution to the unresolved component, but it must be compact.
3.37 3C 346
This narrow-line radio galaxy is clearly detected with the PSPC, showing both extended and compact X-ray emission; fitting a PSPC PRF alone to the radial profile gives unacceptable results. In the radio, 3C 346 is another ‘jetted double’ source with a strong one-sided jet and a weak hot spot (compare 3C 288, section 3.26). It has an unusually bright core (Spencer et al. 1991) and an optical jet (e.g. de Koff et al. 1996) and exhibits a strong Laing-Garrington effect222Laing (1988); Garrington et al. (1988). (Akujor & Garrington 1995) which suggests a cluster environment for the source. -model fits are tabulated in Table 3. Most of the counts (70 per cent) are contributed by the point-source component; no model without a point-source contribution can adequately fit the data. A cooling flow is not required.
3.38 3C 345
This superluminal quasar is known to be variable in both the radio and X-ray (e.g. Unwin et al. 1997). We use a single PSPC observation, taken between 1993 Mar 06 and 1993 Mar 11, as representative (since the available HRI observations are all short). The data are acceptably fit with a point-source model.
3.39 3C 356
This high-redshift radio galaxy was observed with the ROSAT PSPC and HRI by Crawford & Fabian (1993, 1996b). We confirm the existence of a very weak source in the HRI observation, and our measurements are consistent with theirs within the errors.
3.40 4C16.49
This steep-spectrum quasar is only barely detected. It appears elongated in the HRI observation, but in the same direction as other objects in the field, and so is likely to be aspect-smeared. We treat it as unresolved.
3.41 3C 368
Our results for this high-redshift radio galaxy are consistent with those of Crawford & Fabian (1995).
3.42 3C 388
The X-ray images of this low-excitation FRII radio galaxy show a significant amount of diffuse emission. The source is known to lie in a poor cluster, with a number of nearby galaxies (Prestage & Peacock 1988). In the radio the object has an unusual structure. Its one-sided bright jet and diffuse hot spots might put it in the class of jetted doubles discussed earlier (section 3.26), but the presence of two distinct spectral regimes in its lobes suggests that it may be a restarting source (Roettiger et al. 1994). -model fits are tabulated in Table 3 and show the X-ray emission to be dominated by an extended component. No model without a point source is an acceptable fit to the data, however. Gas of the density implied by the fitted model should be rapidly cooling, with a mass deposition rate of yr-1. When we fit with cooling-flow models, using a temperature keV outside the cooling radius, the lack of a strong peak in the central regions (as with 3C 295) means that no model with is a good fit; we find acceptable fits for models with a weaker dependence of upon , for example with , , , , arcsec. The cooling radius for this model is 9 arcsec and the cooling time at this radius is about yr. A point-like nuclear component is still required, containing counts.
3.43 3C 390.3
Leighly et al. (1997) discuss 90 separate HRI observations of this broad-line radio galaxy in the context of a variability study; the source is shown to be highly variable on time-scales of weeks. We adopt their average value as our count rate. As discussed by Harris, Leighly & Leahy (1998a), the radial profile of the stacked HRI observations is broader than would be expected from the nominal HRI PRF, but its width is within the range observed to be a result of aspect uncertainty, and so we treat the source as point-like [with the exception of the X-ray hot spot discussed by Prieto (1997) and Harris et al.].
3.44 3C 442A
This peculiar radio galaxy (Comins & Owen 1991) is associated with NGC 7237 in the merging galaxy pair NGC 7236/7237, which lies in a poor cluster. The small-scale structure in the HRI image seems to suggest a double X-ray core with separation roughly 20 arcsec in an east-west direction. Such structure is unreliable because of aspect problems, but the large extension makes an aspect-related explanation unlikely. Other weak sources nearby are not doubled up in the same way, including one apparently coincident with the small associated galaxy to the SE. No compact source is found associated with NGC 7236. On larger scales, the map smoothed with a Gaussian of arcsec seems to show a bar of X-ray emission, oriented roughly NNW-SSE (see Fig. 3); this lies in approximately the same position angle as the common optical envelope of the galaxy pair (e.g. Borne & Hoessel 1988) and approximately perpendicular to the position angle of the radio source, contrary to the prediction of Comins & Owen (1991) who expected the hot gas to be aligned with the radio source. An X-ray counterpart to one of the nearby radio point sources (‘E’ in the notation of Comins & Owen) is also detected, but source ‘A’ is not seen.
Because of the clear absence of radial symmetry in this source, radial profiling is not suitable. An upper limit is found for the point-like counts by taking a 10-arcsec source circle about the X-ray component coincident with the steep-spectrum radio core, using a background region between 40 and 60 arcsec away; we correct the result to our standard 1-arcmin source region. Total counts are derived from a 2.5-arcmin source circle.
3.45 3C 449
The PSPC observations of this FRI radio galaxy are reported in Hardcastle et al. (1998c). The structure of the extended emission is poorly constrained by a more recent 19-ks HRI observation, but no point sources are detected which might have conspired to produce the ring-like structure seen around the southern radio lobe in the lower resolution PSPC observations, reinforcing the conclusion that this is caused by a displacement of the hot cluster gas by the radio-emitting plasma. The HRI and PSPC radial profile fits are consistent, and so we tabulate the PSPC results in Table 3, as the statistics are slightly better.
3.46 3C 454.3
This is a well-known highly variable core-dominated quasar. We report results from PSPC observations since the HRI exposures are all short. The count rates in a 2-arcmin source circle are significantly different in three separate PSPC observations, and so we have used the longest (from 1992 Dec 16 – 1992 Dec 18), which gives a count rate consistent with that of Sambruna (1997). We find no evidence for intraday variability or extended X-ray emission.
3.47 3C 465
Sakelliou & Merrifield (1998) present HRI data which show a point-like X-ray component coincident with the host galaxy of this wide-angle tail radio galaxy. After excluding X-ray emission from the northern companion galaxy of the AGN host and realigning the HRI data from the two observation epochs as suggested by Sakelliou & Merrifield, we find the radial profile of the central source is moderately well fit by a broadened PRF; we take a 1-arcmin source circle and background between 1.7 and 4 arcmin, excluding confusing sources. Further out, there is clear evidence for extended emission on arcminute scales.
4 Results
4.1 Demographics
Table 4 shows the numbers of 3CRR sources observed and detected in ROSAT pointed observations, broken down by source class. Just over half of the 3CRR sample has been observed. FRII radio galaxies, which make up 60 per cent of the sample, have only 46 per cent of the observations but are consistent with the overall detection fraction of 79 per cent in giving 37 per cent of the detections.
The observed subsample is biased with respect to the original (178-MHz flux density) selection criterion of 3CRR – the sources that have been observed with ROSAT tend to be brighter than those that have not, largely because the sources with 178-MHz fluxes much larger than the flux limit of the sample tend to be low-redshift objects and so more suitable for observation with ROSAT. However, dividing the observed subsample by source class, we find that the bias is only present in the FRII radio galaxies. The subsamples of FRI radio galaxies and of quasars are unbiased, in the sense of having 178-MHz radio fluxes that are consistent with having been drawn at random from the objects of their class in the 3CRR sample. We can treat at least these subsamples as representative of the 3CRR sample as a whole.
4.2 The radio core – X-ray core correlation
In Table 5 we list for each source the total counts found in the source region and the number (or upper limit) that we associate with an unresolved central source. The point-like count rate is converted into a 1-keV flux density and rest-frame spectral luminosity density333The X-ray luminosity density of a typical galaxy due to intragalactic gas, LMXB and stars, which will be unresolved in most of our objects, corresponds to only a few W Hz-1 sr-1 at 1 keV (see e.g. Irwin & Sarazin 1998), and so most of the luminosity of almost all our sources must arise elsewhere; similarly, all our sources (except M84) have nuclear luminosities significantly higher than those of the compact nuclear sources in nearby normal galaxies studied by Colbert & Mushotzky (1998). by assuming a power-law spectrum (with ) and galactic absorption. We also tabulate 5-GHz radio core flux density and rest-frame spectral luminosity density, assuming . For consistency we have used the arcsecond-scale rather than milliarcsecond-scale core fluxes even where both are available; in the objects (largely quasars) where good information is available the milliarcsecond- to arcsecond-scale core flux density ratio is not very different from unity. Fig. 4 shows histograms of the rest-frame radio to core-X-ray two-point spectral indices of sources with detections in the radio.
A strong correlation is apparent, in both flux-flux and luminosity-luminosity plots (Figs 5 and 6) between the X-ray and radio core strengths. Analysis with the survival analysis package asurv [Rev. 1.1; LaValley, Isobe & Feigelson (1992)] taking account of the censoring of the data, using a modified Kendall’s algorithm, shows that the flux-flux and luminosity-luminosity correlations are significant, both for the sample as a whole and for the different classes of source (Tables 7 and 8, columns 3 and 4). The fact that the flux-flux correlation is significant gives us confidence that we are not simply seeing a redshift-induced artefact in the stronger luminosity-luminosity correlation. Akritas & Siebert (1995) present a procedure which allows partial correlation analysis in the presence of censoring, and we apply it to the distributions of radio luminosity, X-ray luminosity and redshift to make this conclusion quantitative; the correlation for the sample as a whole, and for the radio galaxies and quasars separately, is significant at better than the 95 per cent confidence level even given the effects of redshift.
These results imply a physical relationship between the X-ray and radio cores of the radio sources, confirming work done with other samples and instruments on low-luminosity radio galaxies (Fabbiano et al. 1984; Edge & Röttgering 1995; Siebert et al. 1996; Canosa et al. 1999), high-luminosity radio galaxies (Worrall et al. 1994; Hardcastle et al. 1998d) and quasars (Tananbaum et al. 1983; Kembhavi, Feigelson & Singh 1986; Worrall et al. 1987; Browne & Murphy 1987; Baker, Hunstead & Brinkmann 1995; Siebert et al. 1996). What does this imply for the origin of the X-ray emission?
There is much evidence for relativistic motion in the cores of all radio-loud AGN, with Lorentz factors inferred from superluminal motion and unification arguments. The observed fluxes and luminosities of radio cores are therefore strongly influenced by Doppler beaming. For example, 20 of the 22 FRI radio galaxies in our sample, which have broadly similar total radio luminosities, have a distribution of core prominences (defined in this case as the ratio of 5-GHz core flux density to 178-MHz total flux density) spanning two to three orders of magnitude and consistent with having been drawn from a randomly oriented population of objects with a single intrinsic core prominence and . (The outliers are the peculiar objects 3C 28 and 3C 442A, where nuclear activity may have ceased). If the X-ray luminosity () were simply related to the AGN power, and therefore independent of beaming and orientation, we would not expect the core radio and X-ray emission to be strongly correlated. At best there would be two to three orders of magnitude of scatter in the correlation, and in practice for 20 objects of similar unbeamed luminosity we would simply not see the correlation at all. The very existence of a correlation between and in these radio galaxies forces us to the conclusion that the soft-X-ray emission originates in a Doppler-boosted region with a Lorentz factor similar to that of the jet. The simplest model is one in which the X-ray emission originates in the jet itself.
To make this argument more quantitative, and to extend it to the higher-luminosity radio galaxies where there are fewer clear detections of nuclear X-ray emission, it is useful to characterize the X-ray/radio correlation by linear regression. Linear regression is difficult in this dataset and its subsets because not all objects have detected cores either in the radio or the X-ray wavebands. Most available algorithms for linear regression in the presence of censored data work only with unidirectional censoring. Two well-known algorithms exist for performing linear regression on doubly censored data: that of Schmitt (1985), implemented in asurv, and the Theil-Sen estimator (Akritas, Murphy & LaValley 1995). Their application to datasets such as ours is discussed in Appendix A. Our conclusion is that the Theil-Sen estimator is slightly better, but we tabulate the results of both in Tables 7 and 8 to emphasise that similar results are obtained. In a few of the sub-samples the censoring is only unidirectional (e.g. in quasars where we have complete radio core information) and we are able to use other algorithms, such as the Buckley-James method implemented in asurv, which also give similar answers. The results are most doubtful in subsamples where upper limits dominate (e.g. the FRII radio galaxies).
Table 8 shows that for the subsamples of radio galaxies the slopes of the correlation are close to unity. Only when broad- and narrow-line radio galaxies are considered together is the slope clearly different from unity, and (as can be seen from Fig. 6) this is because the broad-line objects are systematically brighter in X-rays than the narrow-line objects of similar radio core luminosity, suggesting that these objects have an additional X-ray component not seen in the narrow-line and low-excitation objects. The quasars have an X-ray-radio slope significantly flatter than unity, and generally lie about the regression line for the whole sample. This result has been seen before and can be explained in terms of a model in which both beamed radio-related X-ray emission and anisotropic unrelated X-ray emission are seen from quasar nuclei (Worrall et al. 1987; Browne & Murphy 1987; Worrall et al. 1994; Baker et al. 1995).
Of particular interest are the high-power, narrow-line FRII radio galaxies, of which Cygnus A is the prototype. Obscuring tori are required by unified models in these sources. Because they are distant and faint, we have detected only 17 out of the 30 observed sources in this class, and convincingly detected a central unresolved component in only 7. However, the survival-analysis slope of the correlations in these FRIIs (Table 8) is entirely consistent with the results for the much better detected FRI radio galaxies. If we normalize the relation at a 5-GHz radio spectral luminosity density of W Hz-1 sr-1, then the expected X-ray luminosity density at 1 keV (with 90 per cent confidence range derived from simulation) is ( – ) W Hz-1 sr-1 for the FRI radio galaxies and ( – ) W Hz-1 sr-1 for the FRIIs, so the normalizations of the relations for the two classes of source are consistent. This is as expected if the nuclear soft X-ray emission originates from the jet in both classes of source, since there is little difference on parsec scales between the radio properties of FRI and FRII jets (e.g. Pearson 1996). There are no objects which have a bright radio core and a weak or undetected nuclear X-ray component; therefore nothing explicitly contradicts the suggestion that there is a radio-related soft X-ray component in the centre of all radio galaxies.
The slope of the radio-X-ray correlations can in principle provide information on the mechanism responsible for the radio-related X-ray emission. Possible mechanisms include synchrotron emission from the same population of electrons responsible for the radio emission, and inverse-Compton scattering by those electrons of a population of low-energy photons to X-ray energies, either the radio synchrotron photons themselves (synchrotron self-Compton emission) or an external photon population (‘external Compton’). These different mechanisms would give rise to different relationships between the intrinsic radio and X-ray luminosities. However, simulation shows that the effects of Doppler beaming will tend to obscure any relationship that there may be between the rest-frame luminosities in the two wavebands. In addition, redshift-induced effects will tend to push the slope towards unity. It is conventional to compensate for these problems by considering not the luminosity but the prominence of a beamed component, where the prominence is defined as the ratio of the component’s luminosity to an unbeamed quantity such as the low-frequency radio luminosity of the source. The slope of a plot of X-ray core prominence against radio core prominence, determined using the Theil-Sen regression, is consistent with unity for the FRI radio galaxies and the narrow-line FRII radio galaxies. This suggests that the bulk Lorentz factors of the radio- and X-ray emitting material are similar.
4.3 Cluster emission in high-power radio galaxies and quasars
We have detected extended emission, presumably hot gas associated with a cluster of galaxies, in several quasars with redshifts between and (3C 48, 3C 215, 3C 254, 3C 275.1, 3C 334). In all these objects optical observations have previously suggested a cluster environment for the radio source. Using the low-redshift cluster temperature-luminosity relation of David et al. (1993), which where tested has been reliable out to high redshift (Mushotzky & Scharf 1997; Donahue et al. 1998), we use PROS and the observed count rates to estimate444The procedure used is to guess a temperature, calculate a luminosity from this temperature using a redshifted Raymond-Smith model with 0.5 cosmic abundance, use the temperature-luminosity relation to calculate a new temperature from this luminosity and iterate until the temperature and luminosity stabilise. self-consistent temperatures and 2-10 keV luminosities (see Table 9). These luminosities are consistent with moderately rich cluster environments for the quasars, and also match those of radio galaxies with unambiguously extended X-ray emission at similar redshift inferred by Worrall et al. (1994), Crawford & Fabian (1996a), and Hardcastle et al. (1998d), as would be expected in unified models.
Deriving useful upper limits on extended luminosity for those objects (mostly high-redshift quasars) which appear pointlike in radial profile analysis is difficult; the answer depends on the radial profile and the temperature of the undetected extended X-ray emission as well as on the source and the background count rates. If we assume that the undetected emission is similar to that in detected objects, the task is better constrained. X-ray emission from the detected clusters in our sample can be represented on average by a model with , kpc, and keV. We then use Monte Carlo simulations to estimate how strong such a component would have to be to be detected at the 95 per cent significance level on an F-test in 95 per cent of the trials. For each of the 21 point-like objects with we determine an upper limit on extended counts in this way using a simulation matched to the on-source and background counts of the source. Where the simulations show that all the observed counts could be attributed to cluster emission, as happens in a few cases with poor statistics at high redshift, we use the total counts as an upper limit instead. From these limits on count rate we compute a limit on 2-10 keV extended luminosity assuming keV (the results are insensitive to choice of temperature). Limits are plotted with detections in Fig. 7. The upper limits on cluster luminosity are a substantial fraction of the total source luminosities for the majority of these objects, since most were observed with the PSPC which has poor spatial resolution compared with the expected angular size of clusters. Nevertheless, limits and detections populate similar ranges of luminosity for high-redshift radio galaxies and quasars.
At lower redshifts, it is known that FRI radio galaxies tend to lie in group- or cluster-scale hot gas (e.g. Worrall & Birkinshaw 1994) and results here agree with this. We cannot rule out extended X-ray emission in any of the FRIs in the sample, although objects observed only with the HRI are poorly constrained. The picture is less clear for FRII objects. Of the low-excitation objects, all seem to lie in environments that are at least comparable to those of the FRIs, and some (e.g. 3C 388) are in considerably richer environments. Of the high-excitation objects, which are more typical of their class in their radio structure, at least one (3C 219) appears to lie in an environment comparable to 3C 388’s, and some (e.g. 3C 223, 3C 284) probably have luminosities comparable to those of the cluster around the FRI 3C 449, but others (e.g. 3C 326, 4C 73.08, 3C 98) are constrained by the data to lie in environments no more luminous than those of the least luminous FRIs. It seems, therefore, that FRIIs at low redshift inhabit a range of environments, and while we cannot rule out the possibility that the environments of low- 3CRR FRIIs are identical to those of FRIs (although there is optical evidence against this; Prestage & Peacock, 1988), our finding that luminous X-ray environments for low- FRIIs are not common agrees with earlier work (e.g. Miller et al. 1985). Our data provide some weak support for the common belief (based on optical work; e.g. Yates, Miller & Peacock 1989) that there is an evolution in the environments of the most powerful radio sources between and , in the sense that they are more likely to lie in rich clusters at high redshift.
On the basis of Einstein observations Miller et al. (1985) suggested that the hot-gas environments of low- FRIIs do not confine their radio lobes. Our limits on extended emission in the environments of FRIIs, however, suggest that lobe confinement is possible; for example, the very poor environment that we detect around 3C 98, with an assumed temperature of 1 keV, provides a pressure greater than or equal to the minimum pressure derived for 3C 98 by Miller et al. out to arcmin (i.e. close to the hot spot regions where ram pressure confinement is believed to be important). Part of the argument of Miller et al. was based on the observation that sources with a wide range of linear sizes have approximately the same axial ratio (defined as the ratio of lobe width to length); this would not happen if the lobes were confined while the sources continued to expand linearly. But more recent studies of radio-galaxies at low redshift do show a weak relationship between source length and axial ratio, removing some of the motivation for believing that the lobes of radio galaxies are unconfined; it seems more likely that they are unconfined initially and reach equilibrium at a later stage in a source’s lifetime.
We can compare the clusters detected by X-ray observation with those inferred from observations of extended emission-line gas. Emission-line regions imply that there is cool ( K) gas in the environment of the quasar or radio galaxy, and this must be in pressure equilibrium with the hot, X-ray emitting gas if the emission-line region is to last more than a sound-crossing time. Pressures can be inferred from emission-line ratios if it is assumed that the lines are excited by photoionization from the central quasar. The assumption that the emission-line regions are not overpressured with respect to the X-ray emitting gas leads to the deduction in many objects (e.g. Crawford & Fabian 1989) that the X-ray gas must be so dense that its local cooling time is less than the Hubble time. There are luminous extended emission-line regions in all the quasars with detected extended X-ray emission, although the X-ray observations do not directly require cooling in all cases. Pressures deduced from line diagnostics ([OIII]/[OII] ratios) for four of these sources are tabulated in Table 9, together with pressures at similar radii derived from the -model fits to the extended X-ray emission. The pressures are consistent to within a factor of a few in all cases where data are available.
After submission of the first draft of this paper, Crawford et al. (1999) completed an independent radial-profile analysis of all five of the quasars in our sample with detected extended emission. They reach broadly similar conclusions.
5 Conclusions
We have used the spatial resolution of ROSAT to find compact central X-ray components in a large fraction ( per cent) of the observed radio galaxies and quasars in the 3CRR sample, and we report limits in the remaining sources. It appears that the model, discussed in section 1, in which all powerful radio sources have radio-related soft X-ray emission is consistent with these observations. As argued in section 4.2, the strong correlation between the core radio and nuclear X-ray emission, given that the radio core is believed to be strongly affected by relativistic beaming, implies that the soft X-ray emission originates in the jet, rather than being related to the radio emission less directly (e.g. by common correlation with the bolometric luminosity of the AGN). A jet origin for the soft X-ray emission also explains the fact that it is seen in radio galaxies in spite of the high column densities of absorbing material inferred from hard X-ray observations of some sources. A second nuclear X-ray component, which originates much closer to the nucleus and is affected by the absorbing material so that it is not seen in radio galaxies, is necessary to explain the otherwise anomalously bright emission from lobe-dominated quasars (and from radio-quiet quasars) as discussed by Worrall et al. (1994); such a component is also likely to be present in broad-line radio galaxies. The slope of the correlation for radio galaxies, qualitatively similar to that seen in core-dominated quasars, supports unified models for radio galaxies and quasars.
Extended X-ray emission from cluster- or group-scale gas is common in FRI objects in the sample. Several low-redshift FRIIs also show extended X-ray emission, but others must inhabit relatively poor environments. At higher redshifts, we have found evidence for luminous X-ray emission around several radio galaxies and lobe-dominated quasars, implying rich cluster environments for these sources. The resolution of ROSAT limits our ability to detect more quasar clusters, but it is very likely that more will be detected with the new generation of X-ray instruments. The inferred environments of radio galaxies and quasars detected at are similar, supporting the predictions of unified models.
Acknowledgements
We thank Mark Birkinshaw for writing and supporting the software used in radial profile analysis, and for helpful comments on the paper. Fortran code implementing the Theil-Sen estimator was written by Michael LaValley and kindly provided by Michael Akritas; we thank him and Eric Feigelson for helpful discussion of the linear regression problems discussed in section 4.2 and Appendix A. Fortran code implementing the partial Kendall’s procedure of Akritas & Seibert was also provided by Michael Akritas, director of the Statistical Consulting Center for Astronomy operated at the Department of Statistics, Penn State University (URL: http://www.stat.psu.edu/scca/homepage.html). We are grateful to Dan Harris for a thorough and wide-ranging referee’s report on the first version of this paper.
This research has made use of data obtained through the High Energy Astrophysics Science Archive Research Center Online Service, provided by the NASA/Goddard Space Flight Center. The Digitized Sky Surveys were produced at the Space Telescope Science Institute under U.S. Government grant NAG W-2166. The National Radio Astronomy Observatory is operated by Associated Universities Inc., under co-operative agreement with the National Science Foundation. This work was supported by PPARC grant GR/K98582 and NASA grant NAG5-1882.
References
- [] Akritas M.G., Siebert J., 1996, MNRAS, 278, 919
- [] Akritas M.G., Murphy S.A., LaValley M.P., 1995, J. American Statistical Association, 429, 171
- [] Akujor C.E., Garrington S.T., 1995, A&AS, 112, 235
- [] Akujor C.E., Spencer R.E., Zhang F.J., Davis R.J., Browne I.W.A., Fanti C., 1991, MNRAS, 250, 215
- [] Baars J.W.M., Genzel R., Pauliny-Toth I.I.K., Witzel A., 1977, A&A, 61, 99
- [] Baker J.C., Hunstead R.W., Brinkmann W., 1995, MNRAS, 277, 553
- [] Barthel P.D., 1994, in Bicknell G.V., Dopita M.A., Quinn P.J., eds, The First Stromlo Symposium: the Physics of Active Galaxies, ASP Conference Series vol. 54, San Francisco, p. 175
- [] Best P.N., Longair M.S., Röttgering H.J.A., 1997, MNRAS, 292, 758
- [] Biretta J.A., Stern C.P., Harris D.E., 1991, AJ, 101, 1632
- [] Birkinshaw M., Worrall D.M., 1993, ApJ, 412, 568
- [] Böhringer H., Voges W., Fabian A.C., Edge A.C., Neumann D.M., 1993, MNRAS, 264, L25
- [] Bogers W.J., Hes R., Barthel P.D., Zensus J.A., 1994, A&AS, 105, 91
- [] Borne K.D., Hoessel J.G., 1988, ApJ, 330, 51
- [] Bremer M.N., 1997, MNRAS, 284, 126
- [] Bridle A.H., Fomalont E.B., Byrd G.G., Valtonen M.J., 1989, AJ, 97, 674
- [] Bridle A.H., Hough D.H., Lonsdale C.J., Burns J.O., Laing R.A., 1994, AJ, 108, 766
- [] Browne I.W.A., Murphy D.W., 1987, MNRAS, 226, 601
- [] Brunetti G., Comastri A., Setti G., Feretti L., 1998, A&A, in, press
- [] Burns J.O., Gregory S.A., Holman G.D., 1981, ApJ, 250, 450
- [] Canosa C.M., Worrall D.M., Hardcastle M.J., Birkinshaw M., 1999, MNRAS, in press, astro-ph/9907009
- [] Carilli C.L., Perley R.A., Harris D.E., 1994, MNRAS, 270, 173
- [] Cawthorne T.V., Scheuer P.A.G., Morison I., Muxlow T.W.B., 1986, MNRAS, 219, 883
- [] Colbert E.J.M., Mushotzky 1998, to be published in proceedings of 32nd COSPAR Session E1.2 (1998 July 15-17 Nagoya) ‘The AGN-Normal Galaxy Connection’ (astro-ph/9809150)
- [] Comins N.F., Owen F.N., 1991, ApJ, 382, 108
- [] Crawford C.S., Fabian A.C., 1989, MNRAS, 239, 219
- [] Crawford C.S., Fabian A.C., 1993, MNRAS, 260, L15
- [] Crawford C.S., Fabian A.C., 1995, MNRAS, 273, 827
- [] Crawford C.S., Fabian A.C., 1996a, MNRAS, 282, 1483
- [] Crawford C.S., Fabian A.C., 1996b, MNRAS, 281, L5
- [] Crawford C.S., Vanderriest C., 1997, MNRAS, 285, 580
- [] Crawford C.S., Lehmann I., Fabian A.C., Bremer M.N., Hasinger G., 1999, MNRAS, in press,
- [] Danly L., Lockman F.J., Meade M.R., Savage B.D., 1992, ApJS, 81, 125
- [] David L.P., Harnden F.R., Kearns K.E., Zombeck M.V., Harris D.E., Prestwich A., Primini F.A., Silverman J.D., Snowden S.L., 1997, U.S. ROSAT Science Data Center report, available at URL: http://hea-www.harvard.edu/rosat/rsdc_www/hricalrep.html
- [] David L.P., Slyz A., Jones C., Forman W., Vrtilek S.D., 1993, ApJ, 412, 479
- [] de Koff S., Baum S.A., Sparks W.B., Biretta J., Golombek D., Machetto F., McCarthy P., Miley G.K., 1996, ApJS, 107, 621
- [] Dickinson M., Mushotzky R.F., Spinrad H., McCarthy P.J., van Breugel W., 1998, ApJ, submitted
- [] Donahue M., Voit G.M., Gioia I., Luppino G., Hughes J.P., Stocke J.T., 1998, ApJ, 502, 550
- [] Edge A.C., Röttgering H., 1995, MNRAS, 277, 1580
- [] Ellingson E., Yee H.K.C., Green R.F., 1991, ApJ, 371, 49
- [] Elvis M., Lockman F.J., Wilkes B.J., 1989, AJ, 97, 777
- [] Elvis M., Fiore F., Mathur S., Wilkes B.J., 1994, ApJ, 425, 103
- [] Fabbiano G., Miller L., Trinchieri G., Longair M., Elvis M., 1984, ApJ, 277, 115
- [] Fabian A.C., Crawford C.S., Johnstone R.M., Thomas P.A., 1987, MNRAS, 228, 963
- [] Fanaroff B.L., Riley J.M., 1974, MNRAS, 167, 31P
- [] Feigelson E.D., Laurent-Muehleisen S.A., Kollgaard R.I., Fomalont E., 1995, ApJ, 449, L149
- [] Feretti L., Fanti R., Parma P., Massaglia S., Trussoni E., Brinkmann W., 1995, A&A, 298, 699
- [] Feretti L., Gioia I.M., Giovannini G., Gregorini L., Padrielli L., 1984, A&A, 139, 50
- [] Fernini I., Burns J.O., Perley R.A., 1997, AJ, 114, 2292
- [] Forbes D.A., Crawford C.S., Fabian A.C., Johnstone R.M., 1990, MNRAS, 244, 680
- [] Garrington S., Leahy J.P., Conway R.G., Laing R.A., 1988, Nat, 331, 147
- [] Gavazzi G., Perola G.C., Jaffe W., 1981, A&A, 103, 35
- [] Giovannini G., Feretti L., Gregorini L., Parma P., 1988, A&A, 199, 73
- [] Gunn J.E., Hoessel J.G., Westphal J.A., Perryman M.A.C., Longair M.S., 1981, MNRAS, 194, 111
- [] Hall P.B., Ellingson E., Green R.F., Yee H.K.C., 1995, AJ, 110, 513
- [] Hasinger G., Boese G., Predehl P., Turner T.J., Yusaf R., George I.M., Rohrbach G., 1995, MPE/OGIP Calibration Memo CAL/ROS/93-015, version 1995 May 08
- [] Hardcastle M.J., Alexander P., Pooley G.G., Riley J.M., 1997, MNRAS, 288, 859
- [] Hardcastle M.J., Birkinshaw M., Worrall D.M., 1998a, MNRAS, 294, 615
- [] Hardcastle M.J., Alexander P., Pooley G.G., Riley J.M., 1998b, MNRAS, 296, 445
- [] Hardcastle M.J., Lawrence C.R., Worrall D.M., 1998c, ApJ, 504, 743
- [] Hardcastle M.J., Worrall D.M., Birkinshaw M., 1998d, MNRAS, 296, 1098
- [] Harris D.E., 1999, BAAS, 31, 729
- [] Harris D.E., Biretta J.A.J., Junor W., 1997, MNRAS, 284, L21
- [] Harris D.E., Carilli C.L., Perley R.A., 1994, Nat, 367, 713
- [] Harris D.E., Leighly K.M., Leahy J.P., 1998a, ApJ, 499, L149
- [] Harris D.E., Silverman J.D., Hasinger G., Lehman I., 1998b, A&AS, 133, 431
- [] Henry J.P., Henriksen M.J., 1986, ApJ, 301, 689
- [] Hine R.G., Longair M.S., 1979, MNRAS, 188, 111
- [] Hintzen P., 1984, ApJS, 55, 533
- [] Hintzen P., Romanishin W., 1986, ApJ, 311, L1
- [] Hough D.H., Readhead A.C.S., 1989, AJ, 98, 1208
- [] Irwin J.A., Sarazin C.L., 1998, ApJ, 499, 650
- [] Isobe T., Feigelson E.D., Akritas M.J., Babu G.J., 1990, ApJ, 364, 104
- [] Jackson N., Rawlings S., 1997, MNRAS, 286, 241
- [] Jones D.L., Unwin S.C., Readhead A.C.S., Sargent W.L., Seielstad G.A., Simon R.S., Walker R.C., Benson J.M., Perley R.A., Bridle A.H., Pauliny-Toth I.I.K., Romney J., Witzel A., Wilkinson P.N., Bååth L.B., Booth R.S., Fort D.N., Galt J.A., Mutel R.L., Linfield R.P., 1986, ApJ, 305, 684
- [] Kembhavi A., Feigelson E.D., Singh K.P., 1986, MNRAS, 220, 51
- [] Kronberg P.P., 1976, ApJ, 203, L47
- [] Kronberg P.P., Burbidge E.M., Smith H.E., Strom R.G., 1977, ApJ, 218, 8
- [] Laing R.A., 1988, Nat, 331, 149
- [] Laing R.A., Jenkins C.R., Wall J.V., Unger S.W., 1994, in Bicknell G.V., Dopita M.A., Quinn P.J., eds, The First Stromlo Symposium: the Physics of Active Galaxies, ASP Conference Series vol. 54, San Francisco, p. 201
- [] Laing R.A., Longair M.S., Riley J.M., Kibblewhite E.J., Gunn J.E., 1978, MNRAS, 183, 547
- [] Laing R.A., Riley J.M., Longair M.S., 1983, MNRAS, 204, 151
- [] LaValley M., Isobe T., Feigelson E.D., 1992, BAAS, 24, 839
- [] Law-Green J.D.B., Leahy J.P., Alexander P., Allington-Smith J.R., van Breugel W.J.M., Eales S.A., Rawlings S.G., Spinrad H., 1995, MNRAS, 274, 939
- [] Leahy J.P., Jägers W.J., Pooley G.G., 1986, A&A, 156, 234
- [] Leahy J.P., Bridle A.H., Strom R.G., 1998, Internet WWW page, at URL: http://www.jb.man.ac.uk/atlas/
- [] Leahy J.P., Perley R.A., 1991, AJ, 102, 527
- [] Leighly K.M., O’Brien P.T., Edelson R., Geogre I.M., Malkan M.A., Matsuoka M., Mushotzky R.F., Peterson B.M., 1997, ApJ, 483, 767
- [] Liu R., Pooley G.G., Riley J.M., 1992, MNRAS, 257, 545
- [] Lockman F.J., Savage B.D., 1995, ApJS, 97, 1
- [] Lonsdale C.J., Barthel P.D., Miley G.K., 1993, ApJS, 87, 63
- [] Macdonald G.H., Kenderdine S., Neville A.C., 1968, MNRAS, 138, 259
- [] Mack K.-.H., Kerp J., Klein U., 1997, A&A, 324, 870
- [] Meisenheimer K., Yates M.G., Röser H.-.J., 1997, A&A, 325, 57
- [] Miller L., Longair M.S., Fabbiano G., Trinchieri G., Elvis M., 1985, MNRAS, 215, 799
- [] Morse J.A., 1994, PASP, 106, 675
- [] Murphy E.M., Lockman F.J., Laor A., Elvis M., 1996, ApJS, 105, 369
- [] Mushotzky R.F., Scharf C.A., 1997, ApJ, 482, L13
- [] Neumann D.M., 1999, ApJ, in press,
- [] Noordam J.E., de Bruyn A.G., 1982, Nat, 299, 597
- [] O’Dea C.P., Owen F.N., 1985, AJ, 90, 927
- [] Owen F.N., Eilek J.A., 1998, ApJ, 493, 73
- [] Owen F.N., Ledlow M.J., 1997, ApJS, 108, 41
- [] Pearson T.J., 1996, in Hardee P.E., Bridle A.H., Zensus J.A., eds, Energy Transport in Radio Galaxies and Quasars, ASP Conference Series vol. 100, San Francisco, p. 97
- [] Pearson T.J., Readhead A.C.S., 1988, ApJ, 328, 114
- [] Perley R.A., Bridle A.H., Willis A.G., 1984, ApJS, 54, 291
- [] Perley R.A., Taylor G.B., 1991, AJ, 101, 1623
- [] Prestage R.M., Peacock J.A., 1988, MNRAS, 230, 131
- [] Prieto M.A., 1996, MNRAS, 282, 421
- [] Prieto M.A., 1997, MNRAS, 284, 627
- [] Röser M.-.J., Meisenheimer K., 1987, ApJ, 314, 70
- [] Reid A., Shone D.L., Akujor C.E., Browne I.W.A., Murphy D.W., Pedelty J., Rudnick L., Walsh D., 1995, A&AS, 110, 213
- [] Roettiger K., Burns J.O., Clarke D.A., Christiansen W.A., 1994, ApJ, 421, L23
- [] Sadler E.M., Jenkins C.R., Kotanyi C.G., 1989, MNRAS, 240, 591
- [] Sakelliou I., Merrifield M.R., 1998, MNRAS, 293, 489
- [] Sambruna R.M., 1997, ApJ, 487, 536
- [] Sanghera H.S., Saikia D.J., Lüdke E., Spencer R.E., Foulsham P.A., Akujor C.E., Tzioumis A.K., 1995, A&A, 295, 629
- [] Sarazin C.L., 1986, Rev. Mod. Phys., 58, 1
- [] Saripalli L., Patnaik A.R., Porcas R.W., Graham D.A., 1997, A&A, 328, 78
- [] Schmitt J.H.M.M., 1985, ApJ, 293, 178
- [] Siebert J., Brinkmann W., Morganti R., Tadhunter C.N., Danziger I.J., Fosbury R.A.E., Alighieri S.D., 1996, MNRAS, 279, 1331
- [] Spencer R.E., Schilizzi R.T., Fanti C., Fanti R., Parma P., van Breugel W.J.M., Venturi T., Muxlow T.W.B., Rendong N., 1991, MNRAS, 250, 225
- [] Stark A.A., Gammie C.F., Wilson R.W., Bally J., Linke R.A., Heiles C., Hurwitz M., 1992, ApJS, 79, 77
- [] Strom R.G., Riley J.M., Spinrad H., van Breugel W.J.M., Djorgovski S., Liebert J., McCarthy P.J., 1990, A&A, 227, 19
- [] Tananbaum H., Wardle J.F.C., Zamorani G., Avni Y., 1983, ApJ, 268, 60
- [] Trussoni E., Massaglia S., Ferrari R., Fanti R., Feretti L., Parma P., Brinkmann W., 1997, A&A, 327, 27
- [] Turner T.J., George I.M., Mushotzky R.F., Nandra K., 1997, ApJ, 475, 118
- [] Ueno S., Koyama K., Nishida M., Yamauchi S., Ward M.J., 1994, ApJ, 431, L1
- [] Unwin S.C., Wehrle A.E., Lobanov A.P., Zensus J.A., Madejski G.M., Aller M.F., Aller H.D., 1997, ApJ, 480, 596
- [] Urry C.M., Padovani P., 1995, PASP, 107, 803
- [] van Breugel W., Fomalont E.B., 1984, ApJ, 282, L55
- [] Worrall D.M., 1997, in Ostrowski M., Sikora M., Madjeski G., Begelman M., eds, Relativistic jets in Active Galactic Nuclei, Astronomical Observatory of the Jagiellonian University, Cracow, p. 20 (astro-ph/9709165)
- [] Worrall D.M., Birkinshaw M., 1994, ApJ, 427, 134
- [] Worrall D.M., Birkinshaw M., Cameron R.A., 1995, ApJ, 449, 93
- [] Worrall D.M., Giommi P., Tananbaum H., Zamorani G., 1987, ApJ, 313, 596
- [] Worrall D.M., Lawrence C.R., Pearson T.J., Readhead A.C.S., 1994, ApJ, 420, L17
- [] Wyndham J.D., 1966, ApJ, 144, 459
- [] Yates M.G., Miller L., Peacock J.A., 1989, MNRAS, 240, 129
- [] Yee H.K.C., Green R.H., 1987, ApJ, 319, 28
Appendix A Linear regression in doubly censored data
Linear regression when the data are censored in both directions is a common problem in astronomy, but there are relatively few algorithms for dealing with it; most of the survival-analysis techniques used in astronomy are inherited from the biological sciences where only one variable (survival time) is likely to be censored. Schmitt (1985) presents one algorithm, which is implemented in the survival-analysis package asurv. Some of the problems with Schmitt’s algorithm are discussed in Sadler, Jenkins & Kotanyi (1989). One particular practical difficulty is that the data must be binned, and the correct procedure for choosing the number of bins is not obvious. Akritas et al. (1995) present a second algorithm, a generalised version of the Theil-Sen estimator [which determines the slope which makes Kendall’s between the residuals () and approximately zero]. Here we discuss Monte Carlo simulations intended to demonstrate which of the two procedures is best suited to our data.
Our aim is to find the unknown physical relationship between two quantities, both of which probably have intrinsic scatter; this differs from the more usual case where the error in one of the quantities (the independent variable) can be neglected. The measurement errors in our data are probably small compared to the intrinsic scatter, and are in any case not well known in the case of the radio core flux densities. In the case of uncensored data of this kind, where ordinary least-squares regression is applicable, Isobe et al. (1990) have shown that the best estimators of the slope are those that treat the two variables symmetrically, so that one quantity is not privileged by being treated as the independent variable; they recommend the line that bisects the two lines obtained by ordinary least squares regression of each variable on the other. Schmitt’s algorithm is essentially a weighted least-squares estimator, so it seems likely that the same problems obtain and that similar solutions are applicable; the situation is less clear in the case of the Theil-Sen estimator.
Our simulated data consisted of a hundred data points. The were drawn from a uniform distribution between 21.0 and 28.0; the corresponding points were generated as , where . These values were chosen so as to match roughly with the ranges seen in radio and X-ray luminosity. Intrinsic scatter was modelled with Gaussians having standard deviations of and ; random numbers drawn from these distributions were added to and . Each point had independent probabilities , of being censored in the and directions, which were of the order of tens of per cent to match our dataset. Censored data were replaced with an upper limit which was higher by the modulus of a value drawn from a Gaussian distribution than the value after intrinsic scatter had been added. We ran a number of simulations (typically several hundred) and measured the median and 90 per cent confidence levels of the estimates of the slope. For the Schmitt algorithm the data were binned in a grid with the bin boundaries being chosen automatically by asurv. Simulation showed that the results, and confidence ranges, were not strongly affected by other choices of number of bins around this value. Neither estimator was strongly affected by choices of other distributions for the initial values of .
Our modelling shows that the Schmitt procedure results in a biased estimator of the true slope, , of such datasets even if no scatter is added to the -coordinate, taken to be the independent variable; it consistently underestimates . Only in the limit of negligible scatter and negligible censoring is it unbiased. By contrast, the Theil-Sen procedure gives a good, unbiased estimator of when no scatter is added to the , as described by Akritas et al. Both, however, are biased (in the sense of underestimating ) when intrinsic scatter is added to the dependent variable.
Treating the variables symmetrically by finding the bisector of the two regression lines has better results. Both the Schmitt and the Theil-Sen procedures provide essentially unbiased estimators of provided that there is similar noise and censoring in the two co-ordinates; ‘similar’ here implies that . The Theil-Sen procedure deals slightly better with cases where , though both tend to produce results that are biased towards an estimated slope of unity; we emphasise that this bias is small compared with the breadth of the distribution of the results in small datasets like ours. The 90 per cent confidence ranges are slighly smaller when the Theil-Sen estimator is used. Neither test appears to be biased by allowing the censoring probability to depend on the value of or , so long as this is done symmetrically. If the censoring probabilities or the degrees of intrinsic scatter are different in the two co-ordinates then there is some bias in the results of either algorithm, in the senses tabulated in Table A10. Bias is particularly serious when the degrees of intrinsic scatter are significantly different; for example, when and the median estimate of the slope is biased by per cent, even when censoring is negligible.
We conclude that
-
•
The Theil-Sen estimator is undoubtedly better than the Schmitt estimator when there is negligible intrinsic scatter in one co-ordinate but non-zero scatter in the other.
-
•
When the bisector of the two regression lines is used and when the variables are genuinely symmetrical, both procedures provide good estimates of the true slope for . The Theil-Sen estimator gives a smaller confidence range, is less badly affected by choices of significantly different from 1, and is less biased by asymmetry in the censoring of the two variables.
-
•
The bisector of the two regression lines is a significantly biased estimator of the true slope, using either estimator, when the noise on the two variables is significantly differently distributed.
Table 1: 3CRR objects in the ROSAT public archive Source FR class Source type Galactic ROR number Livetime Offset ( cm-2) (s) (arcmin) 3C 13 1.351 II NLRG 6.24 rp600244n00 34680 29 3C 20 0.174 II NLRG 17.93 rh702084n00 5138 – 3C 28 0.1952 I LERG 5.14 rh800633 50266 – 3C 31 0.0167 I LERG 5.53 rh600496 24815 – 3C 33 0.0595 II NLRG 3.21 rh7020872 47685 – 3C 33.1 0.181 II BLRG 22.50 rh702063 18263 – 3C 47 0.425 II Q 5.34 rp700069, rp700853 10835 – 3C 48 0.367 C(CSS) Q 4.50 rh800634 37020 – 3C 61.1 0.186 II NLRG 7.57 rh702064n00 15943 – 3C 66B 0.0215 I LERG 6.84 rh700365n00 10207 – 3C 67 0.3102 II BLRG 7.12 rp300324n00 2782 24 3C 79 0.2559 II NLRG 10.09 rh701607n00 881 – 3C 83.1B 0.0255 I LERG 13.86 rh701714n00 37680 – 3C 84 0.0172 I NLRG 13.83 rh800591a01 51913 – 3C 98 0.0306 II NLRG 11.70 rh701614a02 41047 – 3C 123 0.2177 II LERG 18.29 rh704034n00 28801 – 3C 171 0.2384 II NLRG 6.60 rh702623n00 20690 – 3C 181 1.382 II Q 7.59 rh701944n00 1594 – 3C 192 0.0598 II NLRG 5.06 rh700367m00 15954 – 3C 196 0.871 II Q 4.93 rp700249n00 6294 – 3C 204 1.112 II Q 4.85 rp201472n00 4811 15.3 3C 207 0.684 II Q 5.40 rp701170n00 6763 – 3C 208 1.109 II Q 3.60 rp700887n00 18068 – 3C 212 1.049 II Q 4.09 rp700436n00 20888 – 3C 215 0.411 II Q 3.75 rh800718, rh800753 86442 – 3C 216 0.668 C(CSS) Q 1.40 rp700329a01 21346 – 3C 219 0.1744 II BLRG 1.48 rp700539n00 4206 – 3C 220.1 0.61 II NLRG 1.93 rh701727n00 36226 – 3C 220.3 0.685 II NLRG 2.40 rp700072n00 8791 – 3C 223 0.1368 II NLRG 1.20 rp700389n00 7817 – 4C 73.08 0.0581 II NLRG 2.45 rp701214n00 12010 – 3C 236 0.0989 II LERG 1.26 rp701215 11946 – 3C 241 1.617 II NLRG 2.02 rp700050 8293 – 3C 245 1.029 II Q 2.70 rp700384n00 9735 – 3C 247 0.7489 II NLRG 1.03 rh702715n00 31137 – 3C 249.1 0.311 II Q 2.89 rp700070n00 1662 – 3C 254 0.734 II Q 1.75 rp700855n00 15570 – 3C 263 0.6563 II Q 0.91 rh800027a01 31203 – 3C 263.1 0.824 II NLRG 2.09 rh702716a01 33457 – 3C 264 0.0208 I LERG 2.20 rp800153n00 18141 8.4 3C 266 1.2750 II NLRG 1.69 rp201237 5767 17 3C 268.3 0.371 II BLRG 1.88 rh800442n00 6258 – 3C 268.4 1.400 II Q 1.25 rh701943n00 5718 – 3C 270.1 1.519 II Q 1.14 rp700864 21584 – 3C 272.1 0.0031 I LERG 2.78 rh600493n00 26237 – A1552 0.0837 I LERG 2.43 rp800577n00 3259 – 3C 274 0.0043 I NLRG 2.51 rh701712n00 44264 – 3C 275.1 0.557 II Q 1.89 rh800719n00 25158 – 3C 277.2 0.766 II NLRG 1.93 rp800393a01 13141 – 3C 280 0.996 II NLRG 1.25 rp700073n00 46619 – 3C 284 0.2394 II NLRG 1.0 rp201471n00 8374 27 3C 288 0.246 I LERG 0.81 rp900222 7793 21 3C 289 0.9674 II NLRG 1.21 rh702713n00 29736 – 3C 293 0.0452 I LERG 1.29 rh700366 10104 – 3C 294 1.78 II NLRG 1.20 rh800806n00 93123 – 3C 295 0.4614 II NLRG 1.38 rh800678 29292 – 3C 296 0.0237 I LERG 1.85 rh701833n00 29162 – 3C 299 0.367 II NLRG 1.20 rh702714n00 59927 – 3C 303 0.141 II BLRG 1.60 rh701723 22075 – 3C 309.1 0.904 C(CSS) Q 2.41 rp700330n00 9472 – 3C 310 0.0540 I LERG 3.42 rh702069 27756 – Table 2: continued Source FR class Source type Galactic ROR number Livetime Offset ( cm-2) (s) (arcmin) 3C 318 0.752 II LERG 3.90 rp201179n00 1195 20 3C 324 1.2063 II NLRG 4.47 rh701720n00 71603 – 3C 326 0.0895 II NLRG 3.87 rp701213 14249 – 3C 325 0.86 II Q 1.74 rh701605n00 28168 – 3C 330 0.5490 II NLRG 2.94 rp800149 3978 14 NGC 6109 0.0296 I LERG 1.47 rh800164n00 33399 – 3C 334 0.555 II Q 4.14 rh800720n00 27909 – 3C 338 0.0298 I NLRG 0.88 rh800429a01 20755 – 3C 343 0.988 C(CDQ) Q 2.45 rp701171n00 4653 – 3C 343.1 0.750 II NLRG 2.68 rp701171n00 4653 29 NGC 6251 0.024 I LERG 5.82 rh701306n00 17387 – 3C 346 0.162 I NLRG 5.47 rp701409n00 16981 – 3C 345 0.594 C(CDQ) Q 0.90 rp700870n00 5703 – 3C 351 0.371 II Q 2.03 rp701439n00 14804 – 3C 356 1.079 II NLRG 2.74 rh800717n00 36028 – 4C 16.49 1.296 II Q 6.54 rh701945n00 9939 – 3C 368 1.132 II NLRG 9.80 rp880394n00 25429 – 3C 380 0.691 C(CSS) Q 6.60 rp700250n00 6209 – 3C 382 0.0578 II BLRG 6.70 rh700368 4943 – 3C 388 0.0908 II LERG 5.81 rh701613n00, rh701722n00 52674 – 3C 390.3 0.0569 II BLRG 3.74 many HRI 1900 – 3C 433 0.1016 II NLRG 9.15 rp700519n00 792 – 3C 442A 0.0263 I LERG 5.08 rh701835n00 9060 – 3C 449 0.0171 I LERG 11.05 rp700886n00 9151 – 3C 454 1.757 C(CSS) Q 5.84 rh701942n00 2376 – 3C 454.3 0.859 C(CDQ) Q 7.06 rp900339n00 21267 – 3C 455 0.5427 II Q 4.97 rh701941n00 2284 – 3C 465 0.0293 I LERG 4.91 rh800715 61933 – Column 3 lists the source structure classification; most sources are FRI or FRII (Fanaroff & Riley 1974). A C in this column indicates compact or core-dominated structure; such objects are subdivided into compact steep-spectrum (CSS) or core-dominated, flat-spectrum quasars (CDQ) according to whether their low-frequency spectral index () is greater or less than 0.5. Letters in column 4 represent optical class; LERG indicates a low-excitation radio galaxy [by the definition of Laing et al. (1994); see the text], NLRG a narrow-line radio galaxy, BLRG a broad-line radio galaxy and Q a quasar. The data in these two columns are taken from Laing & Riley, in preparation. Galactic neutral hydrogen column densities, in column 5, are taken from Elvis, Lockman & Wilkes (1989), Danly et al. (1992), Lockman & Savage (1995), and Murphy et al. (1996) where available (mostly for quasars) and otherwise interpolated from Stark et al. (1992). The second character of the ROR number (in column 6) indicates whether the data used in our analysis were taken with the HRI or PSPC. The offset in column 8 is the distance between the radio core position of the target source and the pointing centre of the observations, where this was significant (i.e. arcmin).
Table 3: Results of radial profile fitting for extended sources Source Luminosity Source Background dof Core Central surface Counts in Counts in distance radius radiuss radius brightness (10-6 point model model (Gpc) (arcsec) (arcsec) (arcsec) counts s-1 arcsec-2) 3C 28 1.286 64 128 14.57 9 0.67 15 33.0 (H) 29 2040 3C 48 2.61 150 210 6.42 13 0.9 15 12.9 (H) 5892 285 3C 98 0.186 180 240 8.67 7 0.9 100 0.1418 (H) 20 136 3C 215 2.97 150 210 7.68 14 0.9 20 2.494 (H) 3915 301 3C 219 1.138 112.5 150 2.6 8 0.9 30 12.8 (P) 360 129 3C 220.1 4.8 60 90 0.689 6 0.9 13 9.72 (H) 117 152 3C 254 6.02 150 210 14.3 16 0.9 35 5.403 (P) 1474 333 3C 264 0.126 120 180 21.6 14 0.67 10 18.5 (P) 3722 1257 3C 272.1 0.019 100 150 8.96 8 0.9 20 48.06 (H) 84 1301 3C 275.1 4.27 150 210 1.9 12 0.9 25 1.96 (H) 367 81 3C 280 8.95 120 260 – 7 0.67 65 0.16 (P) 43 149 3C 295 3.407 150 210 16.7 12 0.67 8 59.4 (H) 23 675 3C 310 0.333 320 370 7.17 9 0.5 75 0.912 (H) 93 1190 NGC 6109 0.180 60 120 1.45 5 0.9 25 1.01 (H) 59 46 3C 334 4.25 60 120 4.84 9 0.9 20 1.689 (H) 1075 48 3C 346 1.05 180 210 15.5 14 0.67 60 1.60 (P) 767 454 3C 388 0.570 210 240 16.6 14 0.5 13 13.3 (H) 99 2211 3C 449 0.103 700 1000 7.7 11 0.35 35 3.09 (P) 33 1807 An H in column 9 denotes a surface brightness derived from HRI observations; a P denotes PSPC results.
Table 4: Observations and detections of 3CRR sources Source type Observed Detected Total in 3CRR Median 0.2–2.5 keV flux (ergs cm-2 s-1) FRI radio galaxies 20 19 26a 1.3 FRII radio galaxies Low-excitation 4 3 16 – Narrow-line 30 17 76 2.0 Broad-line 7 6 10 7.4 Total 41 26 103b 3.6 Quasars FRII 20 19 30 6.4 Core-dominated 8 6 13 1.5 Total 28 25 43 6.7 All 89 70 172 3.0 a The starburst galaxy 3C 231 (M82) is omitted from the total.
b One unclassified object (4C 74.16), not observed with ROSAT, is included in the total.
Median fluxes tabulated in column 5 take into account non-detections; they are derived from the Kaplan-Meier estimator calculated using asurv, and are presented to assist observers in estimating the detectability of such sources. There are too few detected low-excitation FRII radio galaxies to allow a meaningful calculation.
Table 5: Counts and flux densities for X-ray observations and radio cores Unresolved Source Total Unresolved 1-keV flux (1-kev Approx. 5-GHz core flux (5-GHz Ref. Counts Error Counts Error density (nJy) lum. density, unres. density(mJy) lum. density, W Hz-1 sr-1) size (kpc) W Hz-1 sr-1) 3C 13 45 – 45 – 4.7 18.84 150 0.18 ∗ 23.11 3 3C 20 6 – 6 – 20 17.30 12 2.6 22.43 5 3C 28 7820 370 29 18 5.4 16.91 13 0.4 21.70 1 3C 31 165 17 165 17 63.7 15.79 1.4 92 21.94 1 3C 33 140 30 140 30 24.3 16.49 4.8 24 22.46 1 3C 33.1 26 8 26 8 22 17.46 12 20.4 ∗ 23.36 6 3C 47 1567 41 1567 41 493.0 19.62 96 73.6 24.67 4 3C 48 5999 166 5892 93 1440 19.94 20 896 25.63 7 3C 61.1 8 – 8 – 5 16.85 13 6.0 ∗ 22.86 8 3C 66B 141.6 33 141.6 33 141.0 16.36 1.8 182 † 22.46 9 3C 67 22 9 22 9 30 18.08 79 5.5 23.26 10 3C 79 2 – 2 – 30 17.85 16 10 23.36 1 3C 83.1B 80 30 80 30 27 15.79 2.1 40 21.95 11 3C 84 321465 909 5285 1057 1300 17.13 1.5 59600 † 24.78 12 3C 98 48 27 20 8 5.8 15.28 2.6 9.0 21.46 1 3C 123 216 59 19 7 9.4 17.26 14 100 24.21 22 3C 171 8 – 8 – 4 16.95 15 2.2 22.63 1 3C 181 7 4 7 – 50 19.85 36 6 24.70 2 3C 192 8 – 8 – 5 15.78 4.8 8.0 21.99 1 3C 196 38 10 38 10 20 18.97 140 7 24.30 13 3C 204 134 13 134 13 91.6 19.91 150 26.9 25.12 4 3C 207 444 23 444 23 225 19.77 120 510 † 25.94 2 3C 208 572 26 572 26 92.6 19.91 150 51.0 25.39 4 3C 212 749 31 749 31 110 19.92 140 150 25.81 2 3C 215 3973 231 3915 85 391.0 19.49 22 16.4 23.99 4 3C 216 1152 44 1152 44 105.0 19.41 120 1050 26.23 2 3C 219 480 27 360 32 171 18.31 52 51 23.72 1 3C 220.1 260 70 117 20 23.5 18.67 27 25 24.53 1 3C 220.3 32 – 32 – 9.1 18.38 120 1.0 23.30 26 3C 223 76 19 76 19 18 17.11 43 9 22.78 1 4C 73.08 107 21 107 21 22.1 16.43 20 11.2 ∗ 22.11 14 3C 236 50 23 50 23 7.8 16.45 32 84 23.45 1 3C 241 53 17 53 17 15 19.54 160 3 24.48 1 3C 245 626 34 626 34 166 20.08 140 910 † 26.57 2 3C 247 10 – 10 – 2.0 17.82 29 3.5 23.86 1 3C 249.1 411 23 411 23 659 19.44 79 71 24.38 4 3C 254 1783 53 1474 66 203.0 19.80 130 19 24.58 2 3C 263 3070 83 3070 83 606.0 20.15 28 157 25.39 4 3C 263.1 144 27 144 27 32.0 19.12 31 3.2 23.91 18 3C 264 4848 87 3722 97 486.0 16.86 7.6 200 22.47 15 3C 266 11 – 11 – 4.0 18.71 150 0.6 23.60 1 3C 268.3 6 – 6 – 7 17.60 20 130 24.80 1 3C 268.4 69 11 69 11 79 20.11 36 50 25.60 2 3C 270.1 1010 42 1010 42 84.40 20.23 160 190 † 26.26 2 3C 272.1 1288 68 84 21 26 13.92 0.27 180 20.77 1 A1552 9 – 9 – 7 16.30 28 27 ∗ 22.81 25 3C 274 115338 875 6134 97 1080 † 15.84 0.37 4 22.48 1 3C 275.1 405 31 367 24 106 19.23 26 130 † 25.16 2 3C 277.2 11.4 7.3 11.4 7.3 1.96 17.83 130 0.36 ∗ 22.89 3 3C 280 157 80 43 13 1.7 18.04 140 1.0 23.60 1 3C 284 50 16 50 16 10 17.38 66 3.2 22.80 1 3C 288 750 60 750 60 154 18.59 67 30 23.80 1 3C 289 14 7 14 7 3.1 18.28 32 0.5 23.30 1 3C 293 10 5 10 5 6.6 15.68 3.7 100 22.85 1 3C 294 47 13 47 13 3.3 19.00 38 1.0 24.00 16 3C 295 693 77 23 20 5.3 17.73 23 3 ∗ 23.30 17 3C 296 234 30 234 30 57.8 16.05 2.0 77 22.18 1 3C 299 16 – 16 – 1.7 17.04 20 1.0 22.70 18 3C 303 1005 40 1005 40 317.0 18.38 10 150 24.01 1 3C 309.1 984 36 984 36 256 20.12 140 2350 26.86 2 3C 310 1212 276 93 15 28 16.46 4.3 80 22.90 1 Table 6: continued Unresolved Source Total Unresolved 1-keV flux (1-kev Approx. 5-GHz core flux (5-GHz Ref. Counts Error Counts Error density (nJy) lum. density, unres. density(mJy) lum. density, W Hz-1 sr-1) size (kpc) W Hz-1 sr-1) 3C 318 21.8 – 21.8 – 55.0 19.26 130 90 25.28 1 3C 324 52 23 52 26 6.6 18.86 35 0.14 ∗ 22.91 3 3C 326 17 7 17 7 3.6 16.04 30 13 22.56 1 3C 325 84 25 84 25 21 18.99 31 2.4 23.83 5 3C 330 19.2 – 19.2 – 13.0 18.30 110 0.74 22.90 5 NGC 6109 85 28 59 13 12 15.57 2.5 28 21.92 1 3C 334 1046 41 1075 38 342.0 19.73 26 111 25.09 4 3C 338 3515.6 76.6 59.23 22.06 17.50 15.74 2.5 105 22.50 1 3C 343 8.7 – 8.7 – 4.6 18.48 140 300 26.05 21 3C 343.1 22.3 – 22.3 – 12.4 18.61 130 200 25.62 1 NGC 6251 670 33 660 33 369 16.87 2.0 850 23.23 24 3C 346 1130 60 767 36 155 18.20 49 220 24.30 1 3C 345 1706 47 1706 47 496.0 † 19.96 110 8610 † 27.04 2 3C 351 1008 39 1008 39 156.0 18.99 89 6.5 23.49 4 3C 356 14 8 14 8 3.1 18.40 34 1.1 23.70 5 4C 16.49 47 17 47 17 48 19.80 35 16 25.04 23 3C 368 23 8 23 8 3.8 18.54 150 0.14 ∗ 22.85 3 3C 380 1109 37 1109 37 656.0 20.24 120 7447 27.11 2 3C 382 2912.8 55.6 2912.8 55.6 5950.0 18.85 4.7 188 23.33 1 3C 388 1936 266 99 19 18 16.74 7.0 62 23.26 1 3C 390.3 950 32.3 950 32.3 4320 † 18.70 4.6 330 † 23.56 1 3C 433 2.7 – 2.7 – 13 16.71 33 5 22.30 1 3C 442A 316 119 14 5 15 15.54 2.2 2 20.70 1 3C 449 1840 85 33 12 16 15.20 6.3 37 21.57 1 3C 454 4 – 4 – 20 19.70 38 200 26.43 20 3C 454.3 7625 91 7625 91 1350 † 20.79 130 12200 † 27.53 2 3C 455 4 – 4 – 20 18.30 25 1.4 ∗ 23.18 19 3C 465 439 40 439 40 65.8 16.30 2.5 270 22.90 1 5-GHz flux density extrapolated from other radio frequencies.
†Known variability in the marked waveband.
Refer to Table 1 to determine the instrument from which the counts in columns 2–5 are taken. Total counts in column 2 are the net in the source region after background subtraction and include any unresolved component. Columns 6 and 7 list the flux and spectral luminosity density at 1 keV of the unresolved component; the luminosity density values quoted in columns 7 and 10 are the logs to base 10 of the rest-frame spectral luminosity density in W Hz-1 sr-1, calculated assuming and . Column 8 gives the approximate radius, in kpc, of an object that would be unresolved with the appropriate ROSAT detector at the redshift of the source, based on the half-energy radii quoted in section 2. References in column 11 give the source of the 5-GHz core flux density in column 9, and are as follows: (1) Giovannini et al. (1988); (2) Hough & Readhead (1989); (3) Best, Longair & Röttgering (1997); (4) Bridle et al. (1994); (5) Fernini et al. (1997); (6) Leahy, Bridle & Strom (1998); (7) Akujor et al. (1991); (8) Laing & Riley, in preparation; (9) Leahy, Jägers & Pooley (1986); (10) Sanghera et al. (1995); (11) O’Dea & Owen (1985); (12) Noordam & de Bruyn (1982); (13) Reid et al. (1995); (14) Saripalli et al. (1997); (15) Gavazzi, Perola & Jaffe (1981); (16) Strom et al. (1990); (17) Perley & Taylor (1991); (18) Liu, Pooley & Riley (1992); (19) Bogers et al. (1994); (20) Cawthorne et al. (1986); (21) Pearson & Readhead (1988); (22) From MERLIN data of Hardcastle et al. (1997) (23) From maps of Lonsdale, Barthel & Miley (1993) (24) Jones et al. (1986) (25) Owen & Ledlow (1997) (26) Worrall et al. (1994).
Table 7: Correlation strengths and results of linear regression for logarithmic flux-flux relationships Source type Number -value Significance Theil-Sen slope Range Schmitt slope Intercept (per cent) Low High FRI radio galaxies 20 4.390 0.99 0.79 1.24 0.64 -5.68 FRII low-excitation and 34 2.699 99.31 1.06 0.59 1.74 0.56 -5.87 narrow-line radio galaxies All low-excitation and 54 6.188 0.85 0.72 1.01 0.69 -6.13 narrow-line radio galaxies All FRII radio galaxies 41 4.270 1.59 1.22 2.16 1.03 -6.46 FRII quasars 20 2.510 98.79 0.80 0.58 1.13 0.78 -5.24 All quasars 28 3.680 99.98 0.55 0.40 0.73 0.79 -5.45 All sources 89 8.104 0.95 0.86 1.04 0.86 -6.19 -values are derived from the modified Kendall’s test as implemented in asurv. Under the null hypothesis is approximately normally distributed with mean 0 and variance 1. The intercepts quoted are those derived from the Schmitt regression, as the Theil-Sen regression does not allow a derivation of the intercept. The 90 per cent confidence ranges quoted for the Theil-Sen slope are derived from Monte Carlo simulations (see Appendix A) roughly matching the data and are only approximate. The equivalent confidence ranges for the Schmitt slope, not shown, would be similar but larger, as discussed in Appendix A.
Table 8: Correlation strengths and results of linear regression for logarithmic luminosity-luminosity relationships Source type Number -value Significance Theil-Sen slope Range Schmitt slope Intercept (per cent) Low High FRI radio galaxies 20 3.584 99.97 0.99 0.77 1.28 1.16 -10.33 FRII low-excitation and 34 3.609 99.97 1.40 1.02 2.12 1.35 -15.04 narrow-line radio galaxies All low-excitation and 54 5.453 1.20 1.03 1.38 1.28 -13.52 narrow-line radio galaxies All FRII radio galaxies 41 4.031 99.99 1.64 1.33 2.07 1.52 -18.82 FRII quasars 20 4.116 0.50 0.32 0.75 0.69 2.26 All quasars 28 4.776 0.42 0.28 0.57 0.57 5.12 All sources 89 9.467 1.16 1.07 1.26 1.30 -13.69 -values are derived from the modified Kendall’s test as implemented in asurv. Under the null hypothesis is approximately normally distributed with mean 0 and variance 1. The intercepts quoted are those derived from the Schmitt regression, as the Theil-Sen regression does not allow a derivation of the intercept. The 90 per cent confidence ranges quoted for the Theil-Sen slope are derived from Monte Carlo simulations (see Appendix A) roughly matching the data and are only approximate. The equivalent confidence ranges for the Schmitt slope, not shown, would be similar but larger, as discussed in Appendix A.
Table 9: Extended luminosities around 3CRR quasars and FRII radio galaxies with unambiguous extended emission Object Radio galaxy or 2–10 keV lum. Emission line Radius of pressure Ref. X-ray pressure quasar (keV) ( W) pressure (Pa) measurement (kpc) (Pa) 3C 48 0.367 Q 4.9 2.6 3C 215 0.411 Q 4.0 1.3 29 1 3C 220.1 0.61 RG 5.6 4.2 3C 254 0.734 Q 7.7 13 27 2 3C 275.1 0.557 Q 4.8 2.5 27 1 3C 280 0.996 RG 5.0 2.8 3C 295 0.4614 RG 8.0 14 3C 334 0.555 Q 4.4 1.9 27 1 X-ray gas temperature and luminosity (columns 4 and 5) are estimated from the temperature-luminosity relation as discussed in the text. References to emission-line measurements (column 8) are as follows: (1) Crawford & Fabian (1989); (2) Forbes et al. (1990). Pressures in column 9 are calculated from the best-fitting model using the method of Birkinshaw & Worrall (1993).
Table A10: Effects of bias in the distribution and censoring of the variables Data bias Result Slope overestimated Slope underestimated Slope underestimated Slope overestimated 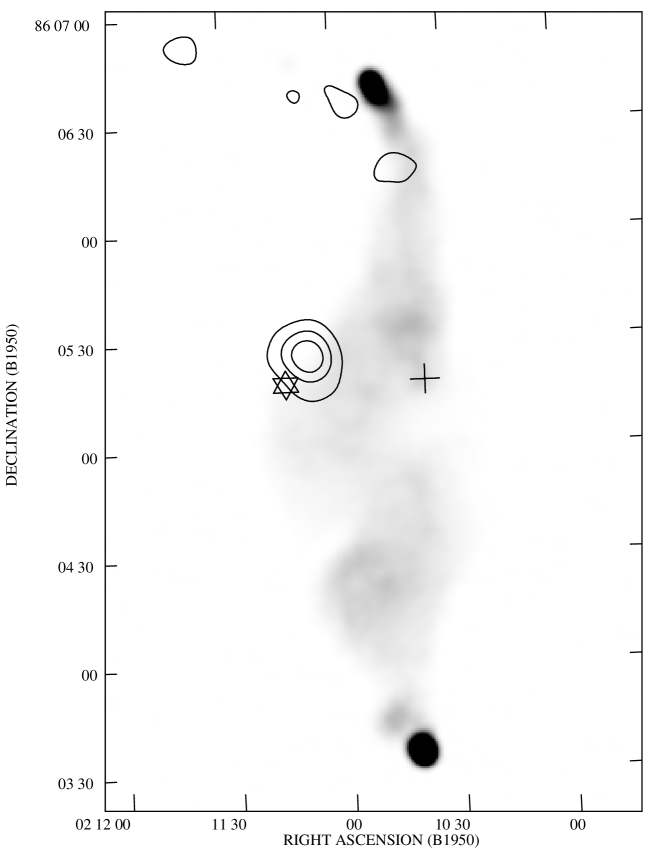
Figure 1: 3C 61.1 in radio and X-ray. The greyscale is a 1.5-GHz radio map (Leahy & Perley 1991) taken from Leahy, Bridle & Strom (1998); the resolution is 3.7 arcseconds and black represents 100 mJy beam-1. Contours show the X-ray image smoothed with a arcsec Gaussian, and are at HRI counts arcsec-2. The lowest contour corresponds to the level, calculated as described by Hardcastle et al. (1998c). The cross corresponds to the position of the 2.7-GHz radio core (Laing & Riley, in prep.) and the star to the position on DSS plates of the background object discussed in the text. The offset between the X-ray position and the position of the radio core is too large to be introduced by ROSAT pointing inaccuracies. 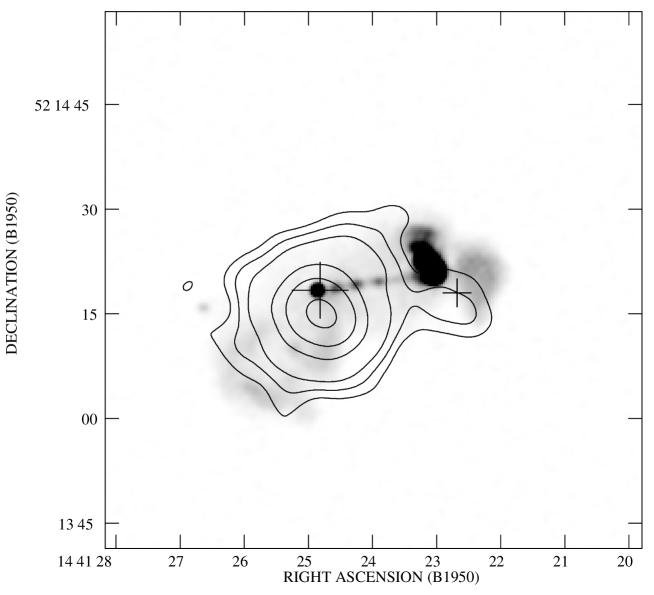
Figure 2: 3C 303 in radio and X-ray. The greyscale is a 1.5-GHz radio map (Leahy & Perley 1991) taken from Leahy, Bridle & Strom (1998); the resolution is 1.2 arcseconds and black represents 20 mJy beam-1. Contours show the X-ray image smoothed with a arcsec Gaussian, and are at HRI counts arcsec-2. The lowest contour corresponds to the level, calculated as described by Hardcastle et al. (1998c). The large cross corresponds to the optical position of the host galaxy (Laing & Riley, in prep.) and the smaller cross to the optical position of the background quasar discussed in the text (Kronberg 1976). The offsets between radio core and X-ray peak, and between the western X-ray peak and either the radio hotspot or the background quasar, are consistent with the absolute positional errors in ROSAT data. 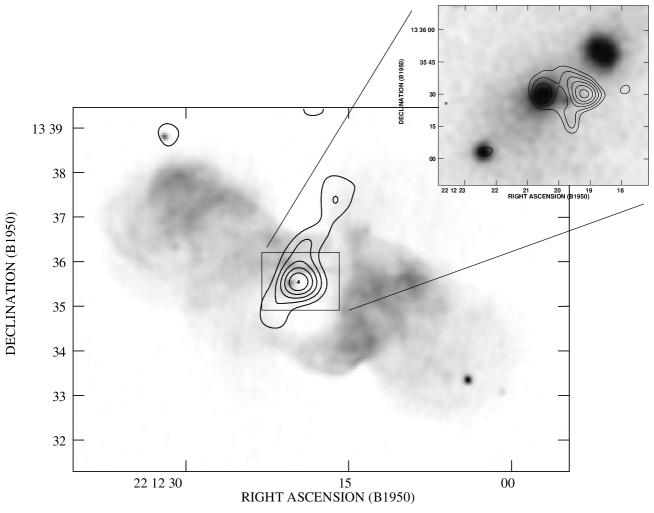
Figure 3: 3C 442A in radio and X-ray. The greyscale is a 1.5-GHz radio map (Comins & Owen 1991) taken from Leahy, Bridle & Strom (1998); the resolution is 7.5 arcseconds and black represents 10 mJy beam-1. Contours show the X-ray image smoothed with a arcsec Gaussian and are at HRI counts arcsec-2. The lowest contour corresponds to the level, calculated as described by Hardcastle et al. (1998c). Inset is an overlay of the X-rays smoothed with a arcsec Gaussian (contour levels at HRI counts arcsec-2, where the lowest level is again ) on the optical image from the Digitised Sky Survey, showing the apparent double X-ray structure. The central galaxy is NGC 7237, that to the NW is NGC 7236. 
Figure 4: Two-point rest-frame 5 GHz to 1 keV radio-X-ray core spectral indices for sources with detected radio cores. Lightly shaded bins occur where there is a radio detection but no X-ray detection and indicate lower limits on the spectral index. 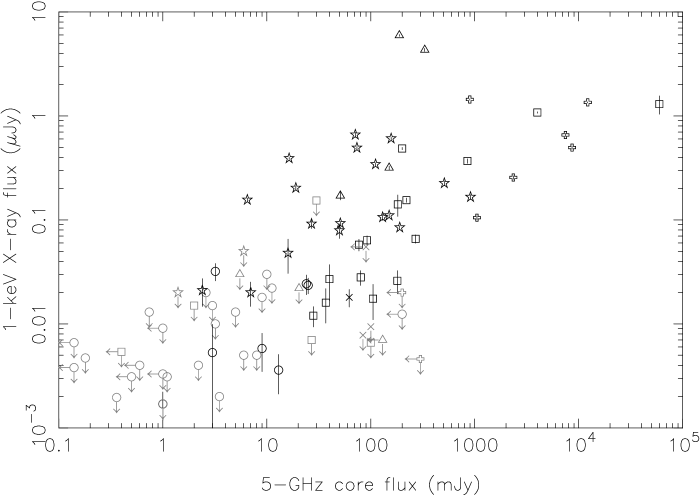
Figure 5: X-ray core vs. 5-GHz radio core flux density. Symbols are as follows; box, FRI radio galaxy; X, low-excitation FRII radio galaxy; circle, narrow-line FRII radio galaxy; triangle, broad-line FRII radio galaxy; star, lobe-dominated (FRII) quasar; cross, core-dominated/compact quasar. Arrows denote limits; points with one or more limits are plotted more lightly so as to make detections easier to see. 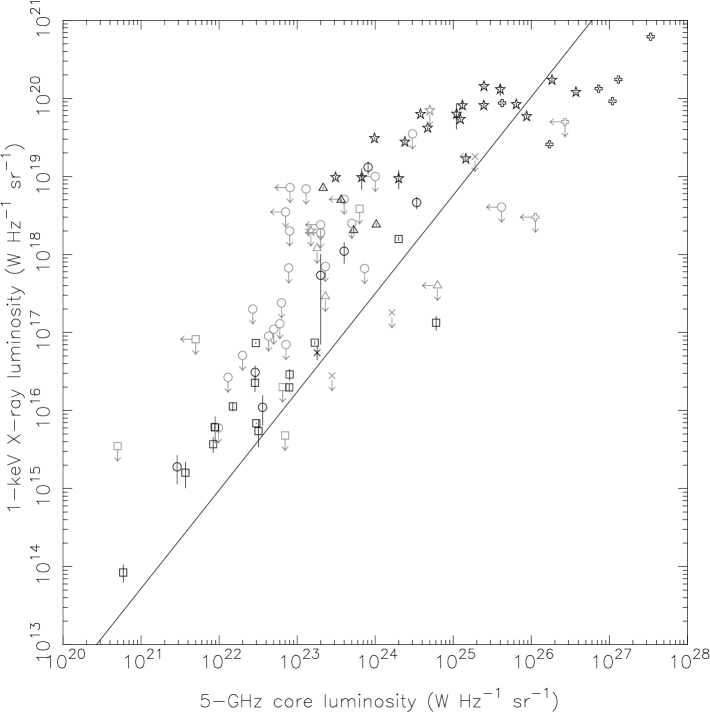
Figure 6: X-ray core luminosity vs. 5-GHz radio core luminosity. Symbols are as follows; box, FRI radio galaxy; X, low-excitation FRII radio galaxy; circle, narrow-line FRII radio galaxy; triangle, broad-line FRII radio galaxy; star, lobe-dominated (FRII) quasar; cross, core-dominated/compact quasar. Arrows denote limits; points with one or more limits are plotted more lightly so as to make detections easier to see. The solid line shows the result of a Schmitt linear regression for the whole sample (see Table 8). 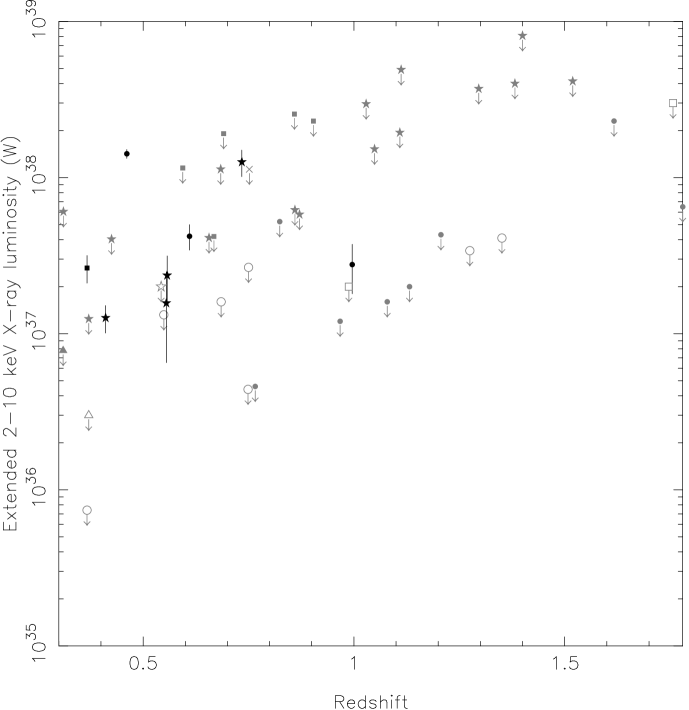
Figure 7: Extended X-ray luminosity vs. redshift for high-redshift objects. Symbols are as follows; circle, narrow-line FRII radio galaxy; triangle, broad-line FRII radio galaxy; star, lobe-dominated (FRII) quasar; box, core-dominated/compact quasar. Arrows denote limits; points with one or more limits are plotted more lightly so as to make detections easier to see. A filled symbol denotes a source which is detected in the X-ray; open symbols are undetected. Only sources where a separation beween pointlike and extended emission has been made are plotted as detections; others are plotted as upper limits. Where a source appears entirely pointlike, simulations (as discussed in the text) are used to calculate an upper limit on the luminosity of an undetected extended component.