Variability of the extreme z=4.72 blazar, GB 1428+4217
Abstract
We report X–ray and radio variability of GB 1428+4217 which confirm its blazar nature. IR observations reveal a powerful optical–UV component, not obscured by dust, which is suggestive of the presence of a billion solar mass black hole, already formed by . A detailed comparison of the broad band spectral properties of GB 1428+4217 with those of nearby blazars shows it to be extreme, but nevertheless consistent with the trend found for nearby sources.
keywords:
quasars:individual (GB 1428+4217) – X-rays:quasars1 Introduction
At redshift , GB 1428+4217 is the most distant X-ray source known (Hook & McMahon 1997; Fabian et al 1997; 1998). Its bright X-ray flux, of about in the 2–10 keV band, and radio flux, of about 100 mJy at 15 GHz, strongly suggest that the object is a blazar pointed toward us. The previous observations did not however clearly show the flux variability which is common to blazars. We have therefore observed GB 1428+4217 again in X–rays with the ROSAT HRI and have monitored it for several months with the Ryle radio telescope. We report here on our discovery of the expected X–ray and radio variability. We also now make a detailed comparison of its properties with those of nearby blazars.
2 ROSAT and Radio variability data
GB 1428+4217 was observed 4 times with the ROSAT HRI during 1997 December and 1998 January. The source is very clearly detected each time and shows significant variability (see Fig. 1 where we include the earlier HRI point from 1996). It varied by a factor of about two over a timescale of two weeks (or less), which corresponds to less than 2.5 days in the restframe of the source. We note that previous ASCA and serendipitous ROSAT detections of the source give a flux consistent with that of 1996 July.


The Ryle Telescope at Cambridge was used to monitor the flux density of GB 1428+422 at 15 GHz on about 50 occasions between 1998 April and December (unfortunately much later than the HRI pointing). These observations, usually of short duration (typically 1 h), were made during gaps in the regular schedule of the telescope. A more detailed description of the observing technique is given in Pooley & Fender (1997). The flux–density scale of the observations was established by a nearby observation of either 3C 48 or 3C 286. Similar datasets have shown that the overall calibration in such cases has an r.m.s. scatter of less than 3 per cent.
In Fig. 2 the flux density of GB 1428+422 is plotted: significant variability can be detected with an amplitude of 40 per cent over about three months, and 15 per cent on timescale of ten days.
We therefore conclude that the significant variability on short timescales detected both in the X–ray and radio bands strongly confirms the identification of GB 1428+4217 with a blazar. In the following we will then consider the variability and spectral properties of this source, and compare them with those of nearby blazars, with the aim to gain insight both on the physics and evolutionary behavior of this class of AGN.
3 Infrared Observations
In addition to the broad band B and R magnitudes (and monochromatic continuum flux at a rest frame wavelength of 1500Å) reported by Hook & McMahon (1998), we present here , and observations. They were carried out on 1997 March 26 with the United Kingdom Infra-Red Telescope (UKIRT) using the InSb array based camera IRCAM3 in the 0.28arcsec/pixel mode with exposure times per waveband of 900 s. The data underwent dark subtraction, flat-fielding, and mosaicing of the dithered images using the Starlink IRCAMDR software. Photometry was carried out using apertures of diameter 5 arcsec calibrated against similarly analyzed standard stars from Casali & Hawarden (1992). In Table 1, we list the observed magnitudes and derived fluxes.
The spectral index over the range covered by the optical and IR data is 0.0 (). This is bluer than the canonical of 0.7 (eg. Fall, Pei & McMahon 1989) which means that there is no evidence for reddening over the rest frame spectral range 1500–4000Å.
| Band | Wavelength | Wavelength | Magnitude | Zeropoint† | Flux |
|---|---|---|---|---|---|
| Observed () | Rest (Å) | ||||
| J | 1.22 | 2140Å | 18.60.1 | ||
| H | 1.63 | 2860Å | 18.00.1 | ||
| K | 2.19 | 3840Å | 17.50.1 |
Notes: Effective wavelengths and zero point fluxes on the -Lyrae magnitude system from Bessel & Brett (1988).
4 Variability constraints
The spectral energy distribution (SED) of this source already pointed towards its identification with a blazar (Fabian et al. 1997, 1998). In particular, Fabian et al. (1998) showed that the (poorly sampled and not simultaneous) SED of GB 1428+4217 can be accounted for as non–thermal synchrotron and inverse Compton emission from a relativistically moving source, forming two broad peaks in , as characteristic of blazars. However, no constraints on its size were available at the time. The X–ray variability timescale inferred from our ROSAT observations sets instead a significant upper limit on the dimension. We therefore re-consider the modeling of the SED and find that a broad band energy distribution and flat X–ray spectrum consistent with the data can still be found adopting a simple homogeneous model. As an example of the results obtained, in Fig. 3 we show the SED from one of the specific models (see caption) proposed by Fabian et al. (1998), where the intrinsic dimensions and Doppler factor are of order cm and , respectively. As already pointed out by Fabian et al. the parameters inferred from the modeling are globally consistent with those deduced for larger samples of blazars at lower redshifts (Ghisellini et al. 1998).
A further hint that beaming is involved is given by the rate of change of luminosity, erg s-2. The simple efficiency limit (Fabian 1979; Brandt et al. 1999) then yields a radiative efficiency for the source 20 per cent if only the luminosity in the ROSAT band is considered, and about ten times higher if one consider the total X–ray luminosity.

5 Broad band spectral energy distribution
A closer comparison can now be made between the spectral properties of GB 1428+4217 and those of nearby blazars. Differences can give important hints on the evolution in the intrinsic or environmental properties of radio–loud AGN.
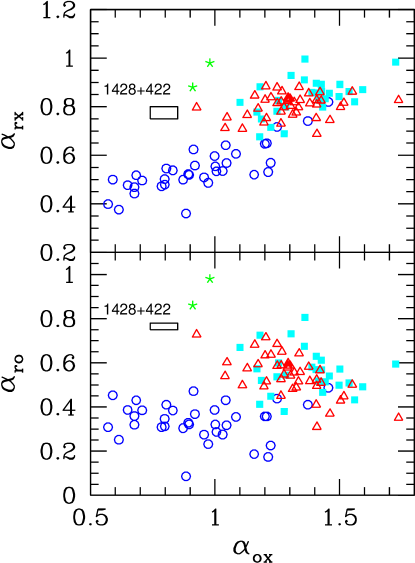
Here we consider as quantitative SED indicators the broad band spectral indices111where the quasar restframe radio, optical and X–ray monochromatic fluxes are calculated at 5 GHz, 5500 Å and 1 keV., , and .
Because of the uncertainties due to the flux variability we estimate the range spanned by , and , by considering the extremes of the observed radio and X–ray flux ranges. The two areas in Fig. 4 are representative of the intervals obtained. In this same figure, the spectral indices derived for GB 1428+4217 are compared with those obtained for complete samples of BL Lac objects and flat spectrum radio quasars (FSRQ; see Fossati et al. 1998 for details). Other two blazars, GB1508+5714 at (Moran & Helfand 1997) and RXJ 1028.6-0844 at (Zickgraf et al. 1997), appear similar to GB 1428+4217, subject to the uncertainty in the necessary optical K-correction for these objects (we adopt an optical spectral index for them of 0.7).
These three sources lie apart from the nearby FSRQ reported. They do however follow the general trends which hold for the entire blazar class. It has been pointed out that if blazars are considered according to their total (and radio) power, then the presence/luminosity in (broad) emission lines correlates with the shape of the SED. In particular, the position in energy of the two broad continuum peaks and their relative intensity (power in the low energy component with respect to that in the high energy one) decrease with increasing total source power. This also translates into an increase of the and spectral indices, and a flattening of the latter at the highest luminosities (see Fossati et al. 1998). Note indeed that GB 1428+4217 follows these trends in the spectral index plane as predicted by its radio power. An interesting consequence is that one would expect the synchrotron peak to be located in the mm band, well below the apparent optical peak of the (sparse) SED shown in Fig. 3.
Although the behaviour of GB 1428+4217, and the other two blazars, fit the blazar scenario just described, the X–ray luminosities of the sources still exceed those predicted by the above correlations; the values of are significantly flatter than expected for the given source powers. Two caveats should however be remembered, namely the critical role of variability when discussing properties of blazars, and the possible influence of selection effects in detecting X–ray emission from GB 1428+4217. Indeed, a similar object with less extreme X–ray luminosity (fully consistent with the trends discussed above) would not have been followed up so readily in the X–ray band. Similar considerations apply for the other two high redshift objects, although we stress that the uncertainties in the (radio, optical and X–ray) spectral slopes of these two sources is large.
We now consider the implication of these results. Within the most widely accepted blazar scenario the two peaks of the SED are interpreted as due to synchrotron (the low energy component) and inverse Compton (the high energy one) processes. Although the nature of the seed photons [internal/synchrotron (SSC) vs external radiation field (EC)] is still not fully settled, evidence has been found that the source power is directly linked to the magnitude of the external radiation field, thus implying the increasing importance of the EC mechanism over the SSC one with increasing power. This also means more effective radiative cooling of electrons (by inverse Compton) - and thus a possible interpretation of the lowering of the energy of particles which emit at the peaks - and an increase in the relative importance of the Compton spectral component (Ghisellini et al. 1998).
If so, GB 1428+4217 (and maybe the other two high redshift quasars) represents a powerful source with an intense (or even extreme) external radiation field. This does not seem to be supported by the lack of very luminous emission lines (the photon field of which could be an important contributor to the external seed field).
However, there is interesting evidence for an intense optical–UV continuum flux, which cannot be easily interpreted as non–thermal emission. It seems plausible that this component (and that responsible for the intense Compton emission) have a nuclear origin. In fact no other radiation field (e.g. any plausible star cluster, or the cosmic microwave background radiation) seems to be energetically relevant. It is possible that this component is analogous to the excess optical–UV emission in nearby quasar and might be ascribed to thermal dissipation from accreting material, which would itself contribute to the local external radiation field.
Independently of its origin it should be stressed that the detection of this optical component sets extremely tight limits to the presence of any dust along the line of sight to this high source.
6 Discussion and conclusions
Evidence for X–ray and radio variability in GB 1428+4217 confirms the blazar nature of this quasar.
Interestingly and perhaps surprisingly, the properties of such an extreme high redshift source seem to fit globally the scenario for low redshift blazars. Although no conclusive evidence of peculiar intrinsic or environmental conditions can be found, there is some indication of even more extreme Compton cooling which might be associated for example with an unusually high external radiation field.
While no conclusions can be drawn on this basis, the issue remains open. Are all high redshift blazars characterized by such high (X–ray) luminosities? In Fig. 5 we show the broad band energy distributions of GB 1428+4217 and the two other radio–loud blazars, GB 1508+5714 and RXJ 1028.6–0844. These are also characterized by a very flat X–ray spectral index and the broad band properties of luminous objects, and at least GB 1508+5714 might share with GB 1428+4217 such an extreme X–ray brightness. Broad band spectral coverage and variability studies of a significant number (possibly a complete sample) of such ‘primordial’ blazars are required.
We finally note that if indeed the detected optical–UV flux can be ascribed to a thermal component produced in the accreting process, a bolometric luminosity of 10 requires the presence of a black hole with billion solar masses, if accreting at the Eddington rate, which has to be formed by (Efstathiou & Rees 1988). Furthermore, one can speculate that if the black hole mass is related to the mass of the galactic bulge according to the relation suggested by Maggorian et al. (1998), a 10 bulge component has also to be present. Clearly the observational confirmation or rejection of these possibilities is of crucial importance for the study of galaxy and black hole formation and their mutual relationship.

Acknowledgments
We thank Gabriele Ghisellini for the use of the code for the homogeneous emission model. The Royal Society (ACF, RGM), the Italian MURST (AC), PPARC (KI) and the NASA LTSA Program (WNB) are thanked for financial support. This research was supported in part by the National Science Foundation under Grant No. PHY94-07194 (AC).
References
Bessell M.S., Brett J.M., 1988, PASP, 100, 1134
Brandt W.N., Boller Th., Fabian A.C., Ruszkowski M., 1999, MNRAS, submitted
Casali M.M., Hawarden T.G, 1992, JCMT-UKIRT Newsletter, 3, 33
Efstathiou G., Rees M.J., 1988, MNRAS, 230, 5P
Fabian A.C., 1979, Proc. Roy. Soc. A, 336, 449
Fabian A.C., Brandt W.N., McMahon R.G., Hook I., 1997, MNRAS, 291, L5
Fabian A.C., Iwasawa K., Celotti A., Brandt W.N., McMahon R.G., Hook I., 1998, MNRAS, 295, L25
Fall S.M., Pei Y.C., McMahon R.G., 1989, ApJ, 341, L5
Fossati G., Maraschi L., Celotti A., Comastri A., Ghisellini G., 1998, MNRAS, 299, 433
Ghisellini G., Celotti A., Fossati G., Maraschi L., Comastri A., 1998, MNRAS, 301, 451
Hook I.M., McMahon R.G., et al, 1994, MNRAS, 273, L63
Hook I.M., McMahon R.G., 1997, MNRAS, submitted
Magorrian J., et al., 1998, AJ, 115, 2285
Moran E.C., Helfand D.J., 1997, ApJ, 484, L95
Padovani P., Urry C.M., 1992, ApJ, 387, 449
Perlman E.S., et al., 1996, ApJS, 104, 251
Pooley G.G., Fender R.P., 1997, MNRAS, 292, 925
Stickel M., Fried J.W., Kühr H., Padovani P., Urry C.M., 1991, ApJ, 374, 431
Stickel M., Meisenheimer K., Kühr H., 1994, A&AS, 105, 211
Wall J.V., Peacock J.A., 1985, MNRAS, 216, 173
Zickgraf F.-J., Voges W., Krautter J., Thiering I., Appenzeller I., Mujica R., Serrano A., 1997, A&A, 323, L21