Giant Molecular Clouds in the Dwarf Galaxy NGC1569
Abstract
We present CO 10 and 21 observations of the dwarf starburst galaxy NGC 1569 with the IRAM interferometer on Plateau de Bure. We find the CO emission is not spatially associated with the two super star clusters in the galaxy, but rather is found in the vicinity of an HII region. With the resolution of our data, we can resolve the CO emission into five distinct giant molecular clouds, four are detected at both transitions. In the 10 transition the sizes and linewidths are similar to those of GMCs in the Milky Way Galaxy and other nearby systems, with diameters ranging from 40 to 50 pc and linewidths from 4 to 9 km s-1. The (2-1)/(1-0) line ratios range from 0.64 0.30 to 1.31 0.60 in the different clouds. The lower line ratios are similar to those seen in typical Galactic GMCs, while values higher than unity are often seen in interacting or starburst galaxies. We use the virial theorem to derive the CO-H2 conversion factor for three of the clouds, and we adopt an average value of 6.6 1.5 times the Galactic conversion factor for NGC 1569 in general. We discuss the role of the molecular gas in NGC 1569, and its relationship to the hot component of the ISM. Finally, we compare our observations with blue compact dwarf galaxies which have been mapped in CO.
Key Words.:
ISM: molecules – Galaxies: individual: NGC1569 – Galaxies: ISM – Galaxies: starburst – Radio lines: galaxies1 Introduction
NGC1569 (Arp 210, VII Zw 16, UGC3056) is a nearby dwarf galaxy hosting several interesting phenomena related to its starburst, and with an observational history going back to 1789 (see Israel I88 (1988) for a history of the early observations). As is common among dwarf galaxies, it has a low metallicity (12 + log(O/H) = 8.19 0.02; Kobulnicky & Skillman KS97 (1997)). At a distance of only 2.2 0.6 Mpc (Israel I88 (1988)), it is the closest known example of a dwarf starburst galaxy, and so observations of it are essential in interpreting observations of similar objects at greater distances (e.g. the small blue galaxies found in the Hubble Deep Fields).
What has perhaps drawn the greatest attention to NGC1569 is the presence of two super star clusters (SSCs), labeled A and B (Ables A71 (1971) , Arp & Sandage AS (1985)). These clusters have been the subject of recent HST (O’Connell, Gallagher & Hunter OGH (1994); De Marchi et al. DM (1997)) and ground based studies (Prada et al. PGM (1994); Ho & Filippenko HF (1996); Gonzalez Delgado et al. GD (1997)), and are believed to be similar to young globular clusters. Age estimates for the SSCs range from 3 to 10 Myr depending upon assumptions about the star formation history.
Greggio et al. (GTe98 (1998)) have determined from HST WFPC2 images that NGC 1569 has experienced a global burst of star formation 100 Myr in duration that has ended as recently as 5 Myr ago. Vallenari & Bomans (VB (1996)) found evidence for a large burst of star formation roughly 1 yr ago in WFPC images, as well as several much older episodes. It is clear that star formation has had a dramatic effect upon the ISM in NGC1569 through stellar winds and supernovae. Israel & van Driel (IvD (1990)) have found a hole in the HI distribution centered on SSC A, possibly blown out by the stars in the cluster. H emission extends from the disk out to the halo in filamentary structures (Hodge H74 (1974); Waller W91 (1991); Hunter, Hawley & Gallagher HHG (1993); Tomita, Ohta & Saito TOS (1994); Devost, Roy & Drissen DRD (1997)). The dynamical age of the extended, diffuse H emission is consistent with some age determinations of the SSCs (Heckman et al. HDL (1995)). X-ray studies (Heckman et al. HDL (1995); Della Ceca et al. DCG (1996)) have found extended emission spatially associated with the H; together these paint a picture of a hot gaseous phase blowing out of the galaxy, powered by the SSCs.
The cool phase of the ISM in NGC 1569 has been observed by Israel & van Driel (IvD (1990)), Stil & Israel (SI (1998)) and Wilcots et al. (in preparation) in HI with interferometers. Hunter et al. (HTCH (1989)) have combined FIR data from the Kuiper Airborne Observatory and IRAS to study the dust. They find an unusually high dust temperature, for a dwarf irregular galaxy, 34 K, and attribute this to the influence of the recent star formation burst. CO emission has been observed in NGC1569 by Young, Gallagher & Hunter (YGH (1984)), Greve et al. (GBJM (1996)) and Taylor, Kobulnicky & Skillman (TKS (1998)). Mapping with the IRAM 30-m telescope, Greve et al. found CO emission near the SSCs, but not directly at their locations. Instead the CO is spatially associated with a prominent HII region. The spatial resolution of the 30-m telescope is 22′′ at 115 GHz (equivalent to 235 pc) and 11′′ at 230 GHz (equivalent to 120 pc), so it was not possible to resolve individual molecular clouds. Because of this, an extremely high value of the CO-to-H2 conversion rate, 20 times the Galactic value was derived. Such a high value is unlikely, and Greve et al. attributed it to non-standard conditions in the molecular gas due to the proximity of the super star clusters.
NGC 1569 presents an excellent opportunity to study the effects of low metallicity and a starburst upon the molecular ISM. The only similar environment which can be studied in such detail is the molecular gas complex found near 30 Doradus in the LMC. We have imaged the CO emission using the IRAM interferometer on Plateau de Bure, which provides spatial resolution sufficient to distinguish individual giant molecular clouds (GMCs). We examine the physical properties of the GMCs, derive the CO-to-H2 conversion rate, and discuss the role of the molecular ISM in NGC1569 with respect to its star formation history.
2 Observations and Data Reduction
The observations were carried out with the interferometer on Plateau de Bure in several sessions between 21 March and 14 April 1998. The 12CO 10 and 21 transitions were observed simultaneously in a mosaic consisting of four positions separated by 11′′, centered upon the peak in the CO emission detected by Greve et al. (GBJM (1996)). The D and C2 configurations were used, yielding spatial resolutions of 45 39 at 115 GHz and 23 20 at 230 GHz. At the adopted distance of 2.2 Mpc, these spatial resolutions correspond to 45 pc 40 pc and 25 pc 20 pc, respectively The velocity resolutions are 1.6 km s-1 at 115 GHz and 3.3 km s-1 at 230 GHz.
The data were reduced at IRAM with the CLIC and MAPPING packages of GILDAS, using the standard procedures. During the observations the atmospheric water vapor content varied, and was often high enough to influence the 230 GHz observations. The phase calibration was accomplished accurately with the help of the stable phases at 115 GHz, but the amplitude calibration at 230 GHz is only accurate to 40%. The accuracy of the 115 GHz amplitude calibration is 20%. After mapping was completed the data cubes were exported as FITS files to the AIPS package for further analysis.
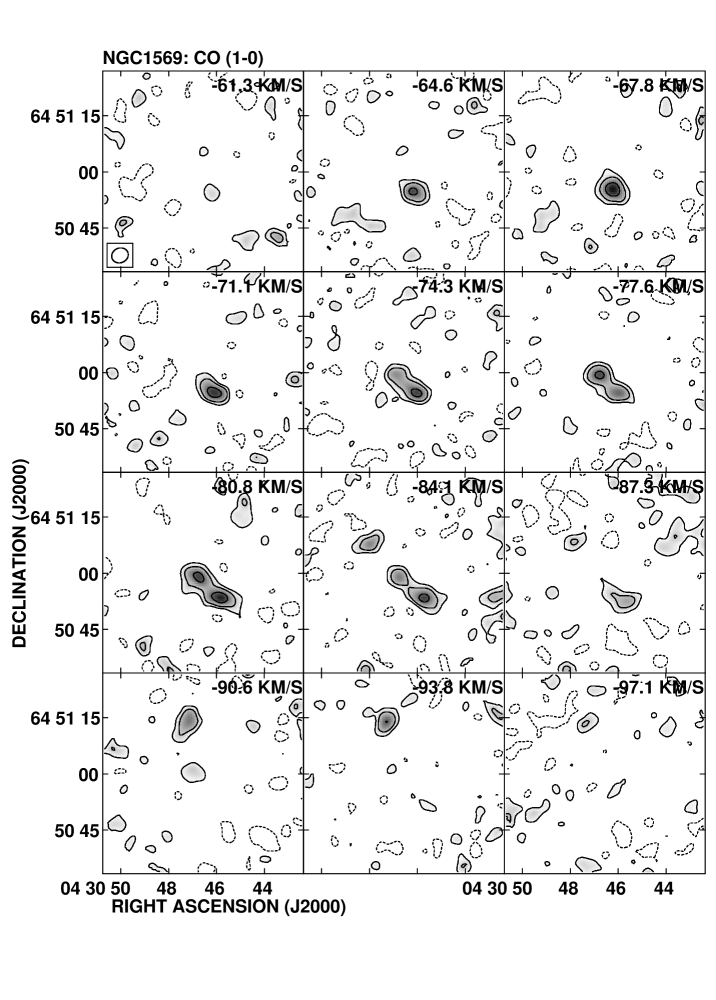
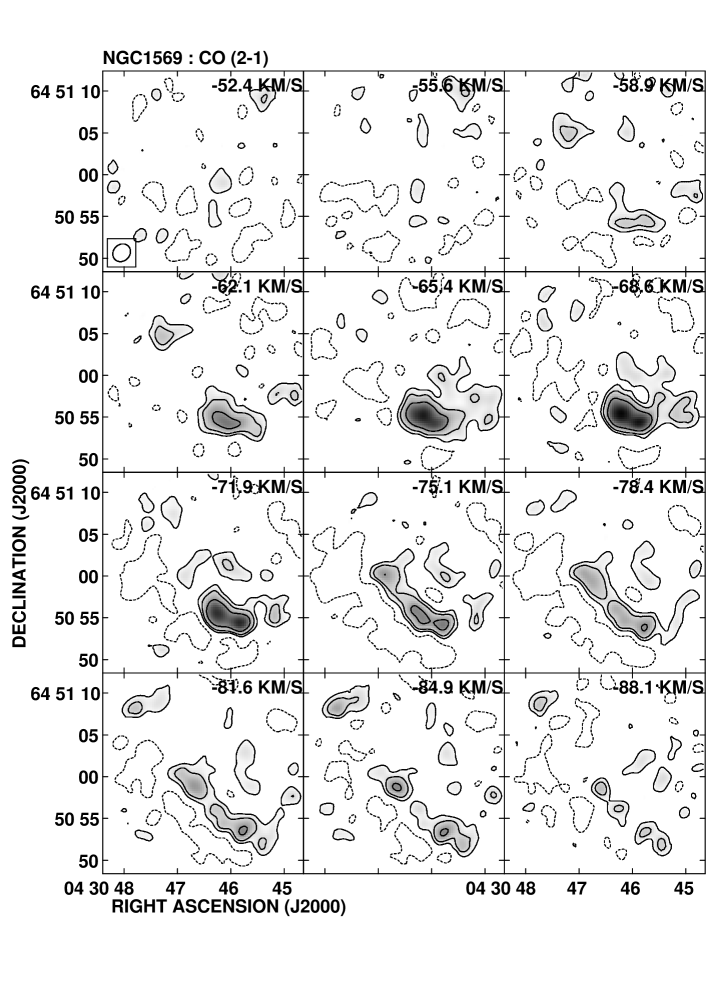
The 115 GHz data have an rms noise of 7.5 mJy/beam in a single channel map, while for the 230 GHz data the rms noise is 6.6 mJy/beam. The channel maps are presented in Figures 1 and 2.
Each data cube was blanked at the 3 level and the resulting blanked data cubes were searched for CO emission. To distinguish genuine emission from noise spikes, additional blanking was done in which only emission present in at least three consecutive channels was retained. The integrated CO emission over the entire map is 3.58 Jy km s-1 in the 10 line, and 5.94 Jy km s-1 in the 21 line. In comparison, Greve et al. (GBJM (1996)) integrated the emission over the inner 22′′ of their map, obtaining 12.5 Jy km s-1 (1.98 K km s-1) and 22.1 Jy km s-1 (2.10 K km s-1) for the 10 line and 21 line, respectively. Our field of view is larger than this, so if we restrict ourselves to the same inner 22, we obtain 2.76 Jy km s-1 and 5.79 Jy km s-1. At 115 GHz, we detect 22% of the flux from Greve et al., and at 230 GHz we detect 26%. This discrepancy is most likely due to the incomplete coverage of the uv plane at the shortest baselines. To check that insufficient sensitivity was not the reason, we assumed that the entire 22′′ region in our 10 map, excluding only the areas covered by the GMCs, was filled with emission 3 channels wide at the 2.5 level, i.e. just below our sensitivity defined above. If this were true, then the total emission should be 3.82 Jy km s-1, and we would have recovered only 72% of this. But even this most extreme scenario still falls short of the 12.5 Jy km s-1 seen by Greve et al. Thus we conclude that the discrepancy is due to the missing short spacings. This lack of short spacings means that our observations do not detect diffuse gas which is distributed over large scale lengths, but only the dense gas which has accumulated into giant molecular clouds. Our results will therefore only be applicable to the structures we see, and not to the global distribution of CO in NGC1569.
3 Results
3.1 Cloud Diameters, Line Widths and Line Ratios
Table 1: Observed Properties of GMCs in NGC1569
| GMC | (2000) | (2000) | D90 | Dfwhm | vfwhm | vcenter | S(CO) |
|---|---|---|---|---|---|---|---|
| (pc) | (pc) | (km s-1) | (km s-1) | (Jy km s-1) | |||
| 10 | |||||||
| 1+2 | 04 30 46.1 | +64 50 55 | 110 57 | 70 44 | 24.1 | –75.7 | 2.12 |
| 3 | 04 30 46.6 | +64 50 58 | 72 57 | 61 35 | 8.8 | –79.3 | 0.86 |
| 4 | 04 30 47.9 | +64 51 08 | 75 45 | 55 33 | 3.9 | –85.0 | 0.19 |
| 5 | 04 30 47.2 | +64 51 14 | 81 56 | 55 37 | 5.7 | –92.1 | 0.41 |
| 21 | |||||||
| 1 | 04 30 45.8 | +64 50 54 | 41 34 | 31 24 | 11.3 | –68.7 | 1.98 |
| 2 | 04 30 46.1 | +64 50 55 | 47 38 | 37 28 | 13.1 | –69.1 | 2.28 |
| 3 | 04 30 46.7 | +64 50 59 | 49 26 | 36 21 | 11.4 | –79.9 | 0.83 |
| 4 | 04 30 47.8 | +64 51 08 | 28 21 | 24 16 | 4.9 | –84.9 | 0.23 |
Note to Table 1: The estimated errors on the various properties in the CO 10 data are: diameter 24 21 pc, vfwhm 1.3 km s-1, vcenter 1.3 km s-1, I(CO) 20%. For the CO 21 data the estimated errors are: diameter 13 11 pc, vfwhm 3.2 km s-1, vcenter 3.2 km s-1, I(CO) 40%.
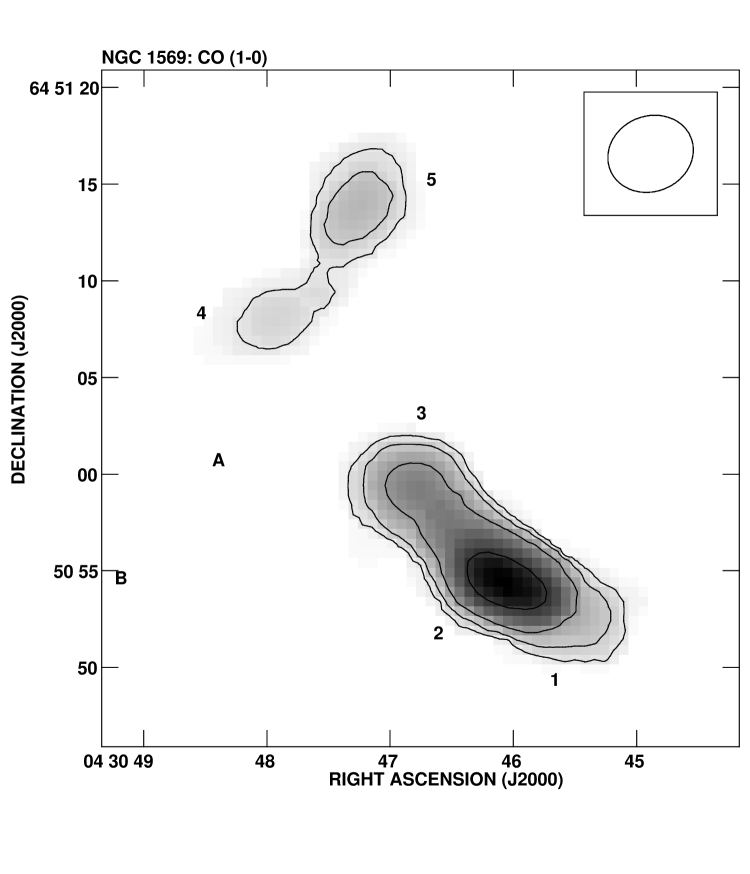
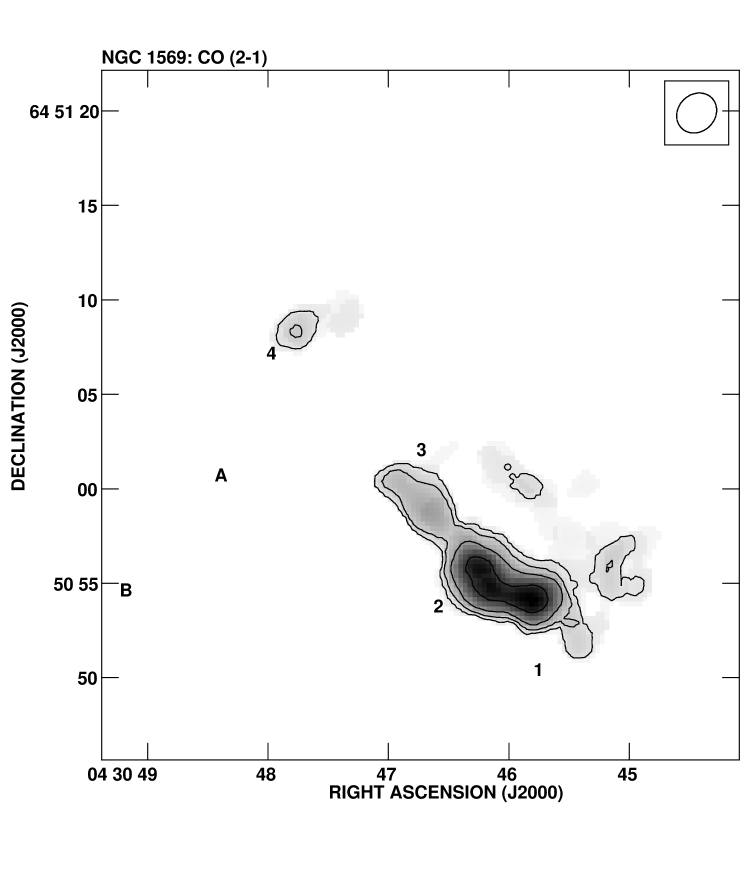
The zeroth moment maps, showing the velocity-integrated emission, are given in Figures 3 and 4. Figure 5 shows the line profiles for the clouds in both CO 10 and 21 emission. Although the CO emission from some giant molecular clouds overlaps spatially, the velocity information shows that several distinct clouds may be distinguished, especially in the 21 data, which have a higher spatial resolution. Four clouds are identified in each data cube, although clouds 1 and 2 from the 21 are merged together by the low spatial resolution in the 10 transition. Cloud 5 from the 10 data falls outside the area covered in the 21 map and thus is not seen. The observed properties of the GMCs are given in Table 1, including the diameter measured at the contour encircling 90% of the flux (used for determining the virial masses), the diameter measured at the half maximum contour (used for comparing with the size-linewidth relation), the FWHM velocity width, the central velocity, and the integrated intensity.

One question to consider is how these GMCs in NGC1569 compare with those from the Milky Way Galaxy, and from other nearby galaxies. Both in the Milky Way and other galaxies, GMCs are observed to follow a size-linewidth relation of the form where is the linewidth, the diameter, and 0.5 (e.g. Larson L81 (1981), Solomon et al. Se87 (1987), Wilson & Scoville WS90 (1990)). Figure 6 plots our clouds in the size-linewidth plane along with clouds observed in M31 (Vogel et al. VBB (1987); Wilson & Rudolph WR (1993)), M33 (Wilson & Scoville WS90 (1990)), SMC (Rubio et al. RLB (1993)), IC10 (Wilson W95 (1995)) and NGC 6822 (Wilson W94 (1994)). The line shows a fit to the points from M33 by Wilson & Scoville (WS90 (1990)) of the form: . Our clouds clearly fall within the range spanned by the clouds from other galaxies.

The CO (21)/(10) line ratio, , is given in Table 2. Greve et al. (GBJM (1996)) determined the line ratios for the inner 22′′ of their single dish map, obtaining 1.1 0.2. This value lies between the extremes that we have determined for the individual GMCs, although our error bars are large enough to include their value. If we integrate only the emission corresponding to the same region as Greve et al., we obtain a line ratio of 1.38, larger than their value, but consistent, given our errors. However, GMCs 1+2 contain most of the emission at both frequencies, so it is likely that the value of Greve et al. is dominated by the combined contribution of these two objects, and that the lower line ratios we obtain for GMCs 3 and 4 are correct.
Table 2: CO (21)/(10) Line Ratios
| GMC | 21/10 |
|---|---|
| 1+2 | 1.31 0.60 |
| 3 | 0.64 0.30 |
| 4 | 0.79 0.36 |
3.2 The CO-H2 Conversion Factor
Under the assumption that the clouds we observe are in virial equilibrium, we may use the virial theorem to calculate the mass within the clouds. Since the mass of GMCs is dominated by molecular hydrogen, comparing the mass thus obtained from the observed CO flux density will give the conversion factor between CO and H2. For this calculation to apply, the clouds must be resolved both spatially and in velocity, otherwise upper limits on the molecular mass of the GMCs are obtained, resulting in lower limits on the conversion factor. Figure 5 shows that the velocity resolution is sufficient, although we will not be able to use the CO 10 data for clouds 1 and 2 because they are blended together at the lower spatial resolution. At a distance of 2.2 Mpc, the spatial resolution at 115 GHz of 45 39 corresponds to 48.0 41.6 pc, while the resolution at 230 GHz of 23 20 is equal to 24.5 21.3 pc.
An important question is whether or not the assumption of virialization is justified. From Figure 6 we conclude that the clouds are similar to GMCs known in the Galaxy and other nearby systems, so if those clouds are virialized, we may reasonably assume that ours are as well. That GMCs in the Milky Way are virialized has often been the subject of vigorous debate. One line of reasoning that argues for virialized clouds has been the tight correlation between virial masses, MVT, and CO luminosities, LCO, where LCO is taken as an indicator of the mass of CO, and hence H2, present in a given cloud (Solomon et al. Se87 (1987)). However, Maloney (M90 (1990)) has argued that this MVT–LCO correlation is simply a result of the observed size-linewidth relation and would exist whether or not the GMCs were in virial equilibrium. In the end, the fact that conversion factors derived with this method generally agree with those derived from independent methods, at least at the high mass end of the GMC distribution ( M☉), suggests that the assumption of virialization is reasonable (Combes C91 (1991)). Both sensitivity and spatial resolution limit our observations to these largest, most massive GMCs, so we will use the viral masses to derive the H2-CO conversion factor.
The virial mass contained in a cloud is given by
| (1) |
where is the velocity width and the diameter of the cloud (MacLaren et al. MRW (1988)). For the diameter, we use the average of the major and minor axes, measured at the contour containing 90% of the flux (D90), and for the velocity width, we use the linewidths in the 10 line. The factor of 190 is appropriate for a spherical distribution with density proportional to . The molecular mass in a given cloud of integrated CO 10 flux density [Jy km s-1] is:
| (2) |
where is the distance to the cloud (Wilson & Scoville WS90 (1990)). This formula uses a Galactic conversion factor of = 2.3 1020 cm-2 (K km s-1)-1 (Strong et al. Se88 (1988)) and includes the helium correction. The CO-H2 conversion factor is then obtained from
| (3) |
Table 3 lists the values for and for the three clouds with adequate spatial resolution to measure the diameters. Also included are the estimated masses of H2. For clouds 1+2 this is obtained using the average conversion factor described below, for clouds 3, 4 and 5 this is simply the virial mass reduced by a factor of 1.36 for the helium contribution.
Table 3: CO-H2 Conversion Factors and Cloud Masses
| GMC | M | ||
|---|---|---|---|
| M☉ | M☉ | ||
| 1+2 | … | … | 10.9 3.8 |
| 3 | 7.2 3.6 | 4.8 1.8 | 3.5 1.3 |
| 4 | 5.9 3.5 | 0.87 0.44 | 0.64 0.32 |
| 5 | 6.7 3.5 | 2.1 0.85 | 1.5 0.63 |
The values for the individual clouds are consistent with each other, given the rather large error bars. The scatter between the values, , is 0.6, smaller than the individual errors, and smaller than the 20% accuracy of the calibration of the CO flux. Combining these two contributions, we adopt 1.5 as the error for the average conversion factor in NGC 1569 instead of using the statistical scatter of the three values, thus = 6.6 1.5. We can compare this with conversion factors calculated with the same method by Wilson (W95 (1995)) for other dwarf galaxies of nearly the same metallicity as NGC 1569. NGC 6822, with 12 + log(O/H) = 8.20, has 2.2 0.8, while IC10, with 12 + log(O/H) = 8.16 has = 2.7 0.5. Thus NGC 1569 has a higher conversion rate than dwarf galaxies of similar metallicity by a factor or 2 to 3.
Israel (I97 (1997)) has used far infrared data from IRAS to determine the conversion factor in several magellanic irregular galaxies, including NGC1569. He obtains = 70 35 for NGC1569, nearly ten times our value. At least two possibilities exist to explain this discrepancy. Our value is only valid for those GMCs in which we detect CO emission, while there may exist regions containing molecular material, but no CO. Thus Israel’s value may be an average over the whole galaxy, including areas where there is no CO emission. Alternately, one or more of the assumptions used by Israel in his determination of the conversion factor may not be valid. For example, his method assumes a constant dust-to-gas ratio everywhere in the galaxy, which may not be the case. Too little is currently known about the distribution of cool dust in dwarf galaxies.
Using our derived conversion factor, the total mass of H2 in the five detected GMCs is (16.5 4.1) 105 M☉, compared to 1.1 M☉ in HI (Reakes R80 (1980)). The mass of a typical single HI clump that can be identified in the map of Israel & van Driel (1990) is of order M⊙, i.e. similar to the mass of the GMCs we find. For comparison, we can use the absolute magnitude (MB = –16.9; Tully T88 (1988)) and an assumed stellar mass-to-light ratio of 1 to estimate the total stellar mass to be M☉. This mass-to-light ratio may be an underestimate, because NGC 1569 has had a recent burst of star formation, but we see that the stellar mass is much larger than the contribution made by the molecular or atomic ISM.
Greve et al. (1996) have not found any CO emission in other regions in NGC 1569, but even if there was some they missed, it is unlikely to account for much more than what is already seen. We conclude that the molecular gas contributes a small fraction by mass to the ISM in NGC 1569. However, it should be noted that the conversion factor we derive should only be applied in a strict sense to the GMCs. The diffuse emission not detected by our interferometric observations may have a different conversion factor, since it will have a different (lower) density, and possibly a different temperature.
We can obtain an order of magnitude estimate of the density of this diffuse gas. Greve et al. argued that the total molecular mass they detected is of the order 2 106 M☉ for an assumed conversion ratio of 4 times the Galactic value. This should give a lower limit to the density, because for diffuse gas self shielding of CO is less efficient and CO will be more easily dissociated. Thus a given mass of H2 will have a higher conversion factor. The interferometer detects 22% of the 10 found by Greve et al., leaving a mass of 1.6 106 M☉ undetected. For a spherical volume of 120 pc radius (Greve et al.), this corresponds to an average density of 10 molecules cm-3.
4 Discussion
4.1 The Physical Conditions of the Molecular Gas
Line ratios are often used as indicators of the physical conditions in the molecular ISM. We will compare the 12CO 21 / 10 line ratios we present in Table 2 with those found for molecular gas in various environments. Sakamoto et al. (Se94 (1994)) have derived this line ratio for the GMCs Orion A and B, obtaining 0.77 and 0.66 respectively, similar to our values for GMCs 3 and 4. Thornley & Wilson (TW (1994)) have obtained a line ratio of 0.67 0.19, averaged over several GMCs in M33. Line ratios significantly higher than unity are often considered indicative of warm, optically thin gas and have been observed in interacting galaxies, or in galaxies with nuclear starbursts (Braine & Combes BC (1992); Aalto et al. Ae95 (1995)). For the starburst system M82, Wild et al. (Wi92 (1992)) find a line ratio of 1.3 0.3. In NGC1569 the GMCs with the highest line ratios (GMCs 1+2) are not significantly nearer to either the SSCs or the closest HII regions in projected separation than the other clouds, so it is unlikely that warming due to star formation is responsible. More likely the line ratios reflect a contrast in the densities of the GMCs.
Because we have data only in the 12CO 10 and 21 transitions, we cannot provide tight constraints on the physical conditions in the CO emitting gas. Generally a line known to be optically thin is necessary for this, such as 13CO 10. Given the low emission in the lines of the much more common 12CO, obtaining 13CO detections is difficult in dwarf galaxies.
However, we can run a series of large velocity gradient (LVG) models and see what ranges of parameter space are consistent with our observed 20/10 line ratios. As input parameters into the models we have a 12CO/H2 abundance ratio of 2 and velocity gradients of 0.2, 0.4, 1.0 and 2.0 km s-1 pc-1. The abundance ratio is simply the standard assumption scaled by 0.2, as the metallicity of NGC1569 is approximately 20% solar.
Because we do not have a third line, such as 13CO 10, the kinetic temperature Tkin and the density, n are degenerate and a large number of solutions may give the same line ratios by trading off temperature versus density. Figure 7 shows the result of one LVG model, where the velocity gradient is 1.0 km s-1 pc-1. For this set of parameters, we see that the gas with the high line ratio will have a narrow set of acceptable values for kinetic temperature ( 150 K), and densities (log n 3.5). For the low line ratio gas, a wide range of acceptable values exists.

The physical conditions in the molecular gas determine the value of the CO–H2 conversion factor. Because the 10 line is optically thick under the conditions found in GMCs, the empirical relationship that permits it to be used as a tracer of H2 mass depends on a very clumpy molecular medium with a low filling factor, where the clumps do not shadow one another. If this is not the case in NGC 1569 and there is substantial shadowing, then this would reduce the derived , which would, in turn, increase the conversion factor.
Alternately, if the GMCs are in a stronger UV radiation field than those in either IC10 or NGC 6822, the CO emission could be reduced due to increased photo-dissociation of the CO molecule relative to those two galaxies. This would also increase the conversion factor. This explanation is consistent with the different natures of these three galaxies. NGC 1569 is a BCD which has had a major burst of star formation in the recent past, which resulted in the two SSCs. The presence of HII regions also indicates that some star formation is currently proceeding. Both IC10 and NGC 6822 are far more quiescent than NGC 1569, although a high concentration of Wolf-Rayet stars in IC10 does indicate a recent star formation episode in that system (Massey & Armandroff MA (1995)). If the increased photoionization is the correct explanation, then we would expect to see enhanced emission in the far infrared and submillimeter lines of CI and [CII] compared to NGC 6822 and IC10. We will discuss what constraints upon the physical conditions in the GMCs are imposed by the observed line ratios in the next section.
4.2 The Relationship Between the Super Star Clusters and the GMCs
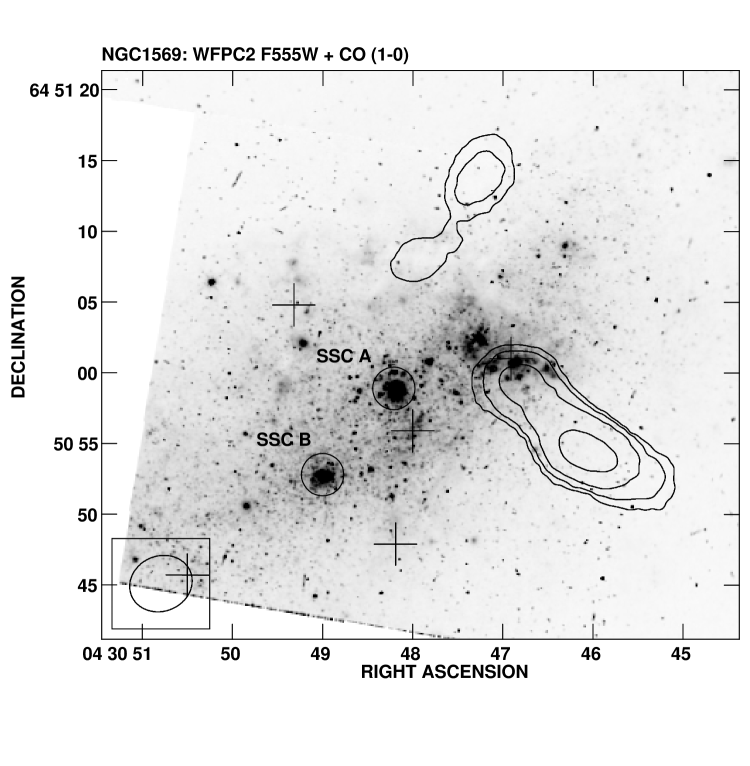
For comparison of the CO emission to the optical component of NGC1569, we obtained an HST WFPC2 image from the data archive of the Space Telescope European Coordinating Facility. Figure 8 shows the CO 10 contours superposed on this image. The F555W filter used corresponds approximately to the V band. Two circles show the positions of the SSCs, and crosses show the positions of HII regions identified by Waller (W91 (1991)). SSC A is near the galaxy center, and about 115 pc east of the nearest GMC, number 3. SSC B lies about 53 pc southeast of SSC A. No molecular gas is directly associated with these clusters. This is to be expected, as these clusters represent very strong star formation episodes approximately 15 Myr ago. Energy input into the ISM from the by-products of star formation (stellar winds and supernovae) may have disrupted the natal clouds responsible for the formation of the SSCs. Indeed, the HI hole, the extended H emission, and the hot X-ray gas all attest to the influence the SSCs have had upon the ISM.
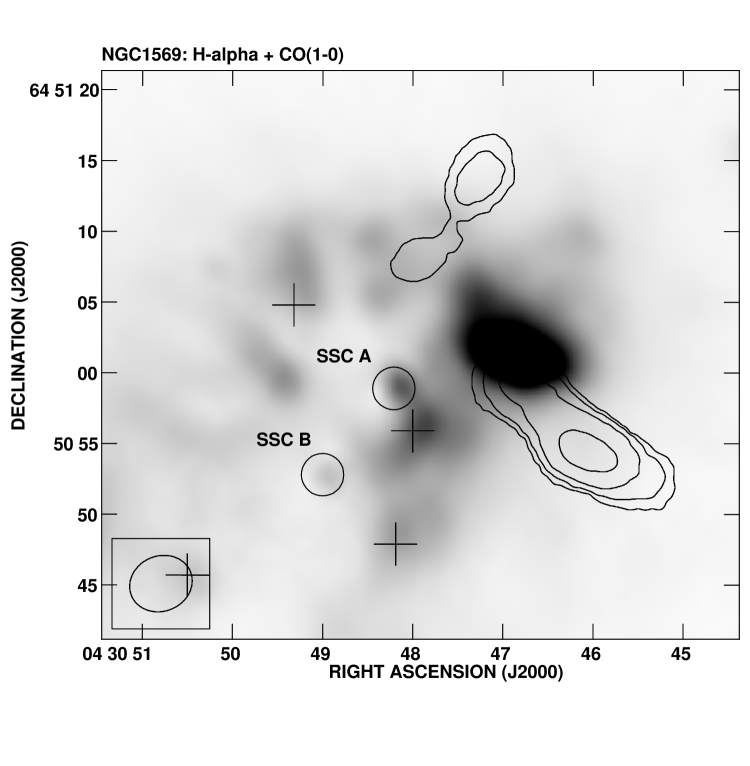
An HII region does fall partially within the contours of GMC 3, although it is impossible to tell from our data if the two are physically associated. In more massive disk galaxies, the scale heights of the cold ISM and the young stellar populations are small enough that a spatial overlap such as is seen here would be sufficient to assume an association between the molecular gas and the HII region. However, due to their shallower gravitational potentials, dwarf galaxies often have thicker disks than do spirals (e.g. Holmberg II, Puche et al. PWBR (1992)). Still, even if NGC 1569 has an HI scale height of 600 pc like Ho II, the height of the molecular gas must necessarily be smaller. Unless they are in a non-equilibrium state kinematically, the ensemble of GMCs must lie in the plane of the galaxy. The velocity dispersion between the clouds (along our line of sight, of course) is 7 km s-1, compared to a global of 72 km s-1 for the HI (Reakes R80 (1980)). The scale height will be approximately proportional to the velocity dispersion (Kellman K72 (1972)), which implies a scale height of pc for the molecular material. With such a low scale height, it is likely that GMC 3 and the HII region are physically close to each other. The spatial relationship between this HII region and the molecular clouds is similar to what is seen in the molecular gas south of 30 Doradus in the LMC (Johansson et al. Je98 (1998)), where an HII region lies along the edge of the molecular gas, partially overlapping.
Prada et al. PGM (1994) have identified a star cluster in this region of H emission and suggested that it might be a SSC in the process of forming. Based upon our observations, we now consider this to be unlikely. The average gas density in the region near this cluster is 200 cm-3, assuming a spherical geometry. Sternberg (S98 (1998)) has argued that the density of molecular gas in the cloud from which the SSCs formed was cm-3, three orders of magnitude higher than what we infer. To recover such a high density through clumping of the molecular ISM would require an unreasonably large volume filling factor of 0.001. We note that 200 cm-3 is only a factor of 30 larger than our lower limit for the density of the diffuse molecular gas.
4.3 The Hot and Cold Phases of the ISM
NGC 1569 is often cited as a case of a dwarf galaxy experiencing a blowout of the ISM due to the effects of a star formation burst. H emission has been found to form a halo of emission around the galaxy, with shell structures discernable (Hunter et al. HHG (1993); Devost et al. DRD (1997)). The radial velocities of as much as 200 km s-1 relative to the systemic velocity suggest expanding superbubbles, and X-ray data find hot (107 K) gas in the interior of these bubbles (Heckman et al. HDL (1995), Della Ceca et al. DCG (1996)). The mass of the hot X-ray gas is 1.2 106 f M☉, where f is the filling factor of the gas. It is reasonable to expect that the violent process of heating the gas and driving it in an outflow would leave some kind of observable signature upon the remaining cold ISM.
The HI hole centered on SSC A discovered by Israel & van Driel (IvD (1990)) could be an example of this. They argue that the data are consistent with a picture in which the formation of the hole began about 107 yr ago, driven by the expansion of supernova remnants. The angular size they measure for the hole is 10., with the result that the GMCs we have imaged lie just outside the hole. The expanding H bubbles have a dynamical age of 107 yr (Heckman et al. HDL (1995)), similar to the age of the HI hole. This provides a limit to the duration of the starburst that created SSC A. Based upon the shape of the non-thermal radio continuum spectrum, Israel & de Bruyn (IdB (1988)) have argued that the star formation burst in NGC 1569 ended about 5 106 yr ago, which would then suggest a burst duration of about 5 106. There are three possible scenarios regarding a connection between the hot and cold phases of the ISM.
-
1.
The GMCs are a direct result of the expansion of the hole in the HI driven by the hot gas. A shell of accumulated material along the edge of the hole might form molecular clouds. Indeed, an expanding shell of CO emission has been detected around the giant HII region 30 Doradus by Cohen et al. (Ce88 (1988)). But in the case of NGC 1569, the GMCs do not form a shell-like distribution around the HI hole, nor do the kinematics of the CO emission indicate an expanding shell, so this scenario is not very likely.
-
2.
Instead of originating in a swept up shell, the GMCs may have collapsed from pre-existing high density material due to the shock of the outflow. The HI maps of Israel & van Driel do show that the peak of the HI column density is west of the SSCs. The lack of molecular gas elsewhere in the vicinity of the SSCs (Greve et al. GBJM (1996)) would be explained if the HI elsewhere did not have a high enough density for GMCs to collapse even with the catalyst of a passing shock. In this case, the GMC formation and subsequent star formation would be a prime example of star formation being triggered by an earlier, nearby star formation event.
-
3.
There is no relationship. The GMCs could predate the star formation burst of about 15 Myr ago that created the SSCs. Molecular clouds will tend to form where the gas density is high. A number of dwarf irregular galaxies without large star formation bursts are known to have irregular, clumpy HI distributions (e.g. Sag DIG, Young & Lo YL (1997); GR8, Carignan et al CBF (1990)), and near such clumps is the natural place to expect molecular gas.
Option 1 is unlikely, for the reasons stated above. Option 2 is more likely, given the relative geometry of the SSCs and the GMCs. An interesting morphological note is the H arm identified by Waller (W91 (1991)). This feature extends about 640 pc from the main part of NGC 1569 and it connects to the galaxy very close to the position of the GMCs and cluster C. A similarly shaped feature occurs in HI, sitting just to the exterior of the H feature. Waller interprets these as the interface between outflowing hot gas and the cool neutral material. The GMCs would then be positioned at the part of this interface region with the highest gas density. This coincidence makes us favor option 2, although the evidence is certainly not conclusive. Further CO observations of otherwise similar dwarfs which lack SSCs will help us to understand this issue. We discuss high resolution CO observations of other BCDs in section 4.4.
If we assume a star formation efficiency (SFE), defined as the fraction of gas mass converted into stars, we can estimate the amount of gas required in the burst that created the SSCs. Sage et al. (Se92 (1992)) have calculated global SFEs for a number of BCDs using H, CO and HI observations. These SFEs are calculated as the star formation rate (from H observations) per gas mass – i.e. the inverse of the gas consumption timescale. To arrive at our definition of SFE, we must multiply by a burst duration, which we will take to be 5 106 yr. Note that implicit in this is the further assumption that the current star formation rate is the same as the average star formation rate during the burst. We will take an average over several BCDs, with the assumption that since they will be at different stages in the development of their star formation episodes, the result will be approximately an average SFE for the duration of a typical burst. Averaging SFEs for the galaxies which most resemble NGC 1569 (which we define as having an HI mass within a factor of 2 of NGC 1569), we obtain 1.9%. If the burst duration is longer than we have assumed, then the SFE will increase, because a larger fraction of the gas mass will have been converted to stars using the average star formation rate. For a duration of 108 yr, the SFE will approach 100%, much higher than is expected. However, burst durations much longer than 5 106 yr conflict with the dynamical age of the HI hole (Heckman et al. HDL (1995)) and the time for the end of the star formation burst (Israel & de Bruyn IdB (1988)).
The SFE derived above compares well with the values of 2.4% and 1.9% determined by counting individual stars in the giant HII regions NGC 595 and NGC 604 in M33 by Wilson & Matthews (WM (1995)). Of course these two are individual giant HII regions, and thus their SFEs are not global values, as come from Sage et al. But the similarity in the SFEs between the two different environment obtained using two different methods suggests that the values are reasonable.
De Marchi et al. (DM (1997)) have estimated the mass of SSC A at 2.8 105 M☉, so a SFE of 1.9% yields an original gas mass (H2 + HI) of 1.5 107 M☉. Wilson & Matthews (WM (1995)) find the ratio of molecular to atomic hydrogen in NGC 595 and NGC 604 to be approximately 1:1, so this would imply an original M of 7.5 106 M☉ for the gas that formed SSC A. This is larger than the 1.7 106 M☉ found in the current GMCs. Of course there is significant diffuse emission that was not detected in our interferometer observations. In the center pointing of Greve et al. (GBJM (1996)) this amounts to nearly a factor of 4.5, so we can estimate a lower limit on the total H2 mass in our field to be 7.7 106. This is similar to the estimate for the gas that created SSC A. Thus there is sufficient gas present now to explain the SSCs, but distributed over an area 200 pc in diameter. This extended distribution of the gas may explain why we see current star formation as typical HII regions, but not as newly born SSCs.
4.4 Comparision with Other Galaxies
4.4.1 dIrrs
Several of the irregular galaxies in the Local Group have been observed with high spatial resolution in CO, including the LMC and SMC (each observed with SEST), and IC10 and NGC 6822 (both observed at OVRO). When individual molecular clouds are resolved, they follow a size-linewidth relationship very similar to that of Milky Way GMCs. The clouds seen in these more nearby galaxies tend to be somewhat smaller that those in NGC 1569, e.g. 30 pc diameter in the LMC and SMC (Johansson et al. Je98 (1998); Rubio et al. RLB (1993)). It is likely that higher resolution observations would separate the NGC 1569 clouds into smaller units, as it is known that molecular clouds are clumpy and have a low volume filling factor. The number of clumps contained in any arbitrary structure is not as important as whether or not that structure is gravitationally bound, and in virial equilibrium.
4.4.2 BCDs
Except for a few cases, the history of observing CO in BCDs is largely one of non-detections (e.g. Young et al. Ye86 (1986), Israel & Burton IB (1986), Tacconi & Young TY (1987), Arnault et al. ACCK (1988), Sage et al. Se92 (1992), Israel et al. ITB (1995), Taylor et al. TKS (1998) and Gondhalekar et al. Ge98 (1998)). Because BCDs have comparatively high star formation rates, the lack of detections is not likely caused by a lack of molecular gas, which has been a frequent, but false, conclusion in the past. Instead, it is more likely to be attributed to the generally low metallicities of most BCDs (Searle & Sargent SS72 (1972)) leading to a high CO-H2 conversion factor.
Even fewer BCDs have been mapped in transitions of molecular gas. These include NGC4214 (Becker et al. BHBW (1995)), NGC5253 (Turner et al. TBH (1997)), Henize 2-10 (Kobulnicky et al. Ke95 (1995), Baas et al. BIK (1994)), Mrk190 (Li et al. Le94 (1994)) and III Zw 102 (Li et al. 1993b ). We shall discuss these in the remainder of this section to put our results on NGC 1569 into a larger perspective.
NGC4214: Becker et al. (BHBW (1995)) have mapped NGC4214 simultaneously in the 10 and 20 lines of 12CO using the 30-m telescope of IRAM. They detected a large region of emission, about 1000 pc 700 pc in size, near the center of the galaxy. This emission shows structure on scales of 500 pc, which was approximately the resolution limit of those observations. One feature which is well resolved has a virial mass of M☉, larger than what we have seen in NGC1569. Clouds of this size are rare in surveys of Galactic GMCs (e.g. Sodroski S91 (1991); Sanders et al. SSS (1985)), so perhaps these features in NGC4214 are simply collections of unresolved smaller clouds. When observed with a large enough beam, the GMCs we see in NGC1569 do appear as a single large cloud of diameter 150 - 200 pc (Greve et al. (GBJM (1996)).
Becker et al. find a 20/10 line ratio of 0.4 0.1 for NGC4214. Their data have relatively low spatial resolution (13′′ in 12CO 21) and NGC4214 is more than twice as far away as NGC1569. Therefore their line ratio represents not a value for an individual cloud, but an average over multiple clouds belonging to a molecular cloud complex. In addition, they used a single-dish telescope, so they do not have the problem of missing flux due to a lack of short spacings. It would be interesting to obtain interferometric CO observations of NGC4214 in order to derive line ratios on smaller physical scales than was possible for Becker et al. and see if any dense clouds with high line ratios are present, such as we find in the case of GMC 1+2 in NGC1569.
NGC5253: Turner et al. (TBH (1997)) have mapped NGC5253 with OVRO at resolution of 190 90 pc (for the distance of 4.1 Mpc). Individual GMCs thus are not resolved in this galaxy. The CO distribution is only marginally resolved at best, and is weakly detected. Turner et al. recover approximately one half the flux detected by single-dish observations (e.g. Taylor et al. TKS (1998)). The CO emission is found near the optical center of the galaxy, but directly above it. It also lies perpendicular to the optical major axis, and along a dust lane. Turner et al. suggest that the CO may have been ccreted onto NGC5253 from another system.
Henize 2-10: At a distance of approximately 9 Mpc, He 2-10 is too distant to resolve even molecular complexes, as was done for NGC4214. However, global line ratios have been obtained by Baas et al. (BIK (1994)), who find a 21/10 line ratio of 0.97 0.16. Because of the low spatial resolution of their observations and the large distance of the galaxy, this likely represents an average over different regions of the galaxy, with gas in different physical conditions. Indeed, Baas et al. explain this line ratio, as well as the 32/21 line ratio of 1.34 0.17, as resulting from a two temperature model with a component of the CO emitting gas at a temperature of 10 K, and another at 75 K. Because we only have data in two transitions, we cannot constrain sophisticated models, but we certainly cannot exclude such a two temperature model for the CO emission in NGC1569.
The spatial distribution of 12CO 10 emission in He 2-10 is described by Kobulnicky et al. (Ke95 (1995)), who obtained interferometer observations with OVRO. The peak of the CO emission is located a few arcseconds from the regions of current star formation, which is consistent with what we find in NGC1569. However, He 2-10 has an unusually extended CO distribution, with a spur of CO emitting gas extending southeast from the star forming center of the galaxy. This feature is also reproduced in the HI data. Kobulnicky et al. suggest that He 2-10 is a moderately advanced merger between two dwarf galaxies. He 2-10 has a hole in the HI distribution near the current star-forming regions, but unlike NGC1569, this hole is filled by the bulk of the observed molecular gas, and there is no evidence for an outflow of hot gas from the starburst region.
Mrk190: This galaxy was observed with the OVRO interferometer in the 12CO 10 line by Li et al. (Le94 (1994)). Although the CO emission is only marginally resolved (distance = 17.0 Mpc), Li et al. find evidence that the molecular gas is distributed in a ring centered on the galaxy center. They suggest that starbursts in the central region of the galaxy have acted to clear gas out from this area, in much the same way as is seen in NGC1569. There is, however, no direct evidence for this process in Mrk190, unlike NGC1569. Li et al (1993a) report single-dish observations in multiple transitions of CO for this galaxy. They obtain a 21/10 line ratio of 0.93 0.25, which is roughly consistent with the line ratios for NGC1569.
III Zw 102: Despite its relatively high optical luminosity (MB = -19.2), this galaxy is often included in studies of dwarf galaxies (e.g. Thuan & Martin TM81 (1981)). Li et al. 1993b obtained 12CO 10 maps with OVRO, and also single dish spectra in the 21 and 10 transitions with the IRAM 30-m telescope. The distance to III Zw 102 is large (23.5 Mpc), so structures like GMCs could not be resolved in the observations. They found a 21/10 line ratio of 0.66 0.12, quite similar to what we found for GMCs 3 and 4 although, given the large errors on our line ratios, the value for GMC 1+2 is also consistent. This line ratio for III Zw 102 is measured over the 23′′ beam of the 30-m telescope at 115 GHz. This corresponds to 2.6 kpc within the galaxy, so the line ratio is clearly an average over a large number of GMCs. The distribution of the CO emitting gas is roughly correlated with the star formation as traced by H and radio continuum images, but the peak of the CO emission is offset relative to the peak of the optical emission. This is quite similar to NGC1569, in which we find molecular material associated with HII regions, but not with the SSCs.
5 Summary and Conclusions
We have presented CO 10 and 21 observations of the dwarf starburst galaxy NGC1569 obtained with the IRAM millimeter interferometer. We confirm the result of Greve et al. (GBJM (1996)) that the molecular gas is not associated with the super star clusters in NGC1569, but instead with nearby HII regions. The major results of our study are:
-
1.
The CO emission is resolved into a number of individual giant molecular clouds. These GMCs have sizes and linewidths similar to the more massive GMCs in the Milky Way Galaxy, and to those in other Local Group galaxies. The 21/10 line ratios of the GMCs in NGC1569 range from 0.64 0.30 to 1.31 0.60. The lower values are similar to what is typically seen in the Milky Way GMCs, while the higher values are similar to what is observed in starburst galaxies.
-
2.
The CO-H2 conversion factor is found to be 6.6 1.5 times the Galactic value by applying the virial theorem to 3 of the GMCs detected in NGC 1569. This is approximately three times higher than is found for NGC6822 and IC 10, two dwarf irregular galaxies in the Local Group with nearly the same metallicity as NGC1569. This difference may due to a stronger UV radiation field in NGC1569 compared to the dwarf irregulars. Sensitive observations of cooling lines like CI and CII, expected to be enhanced in the presence of strong photo-dissociation, are called for to decide this matter. NGC1569 has recently experienced a strong burst of star formation which formed the two super star clusters, and still has a number of HII regions.
-
3.
The GMCs are observed to be just outside the edge of the HI hole surrounding SSC A. This hole is thought to be a region swept clear of cold gas by the observed outflow of hot X-ray emitting gas. It is possible that shocks from this process may have contributed to the formation of the GMCs, although our data do not place any constraints on this scenario.
Acknowledgements.
We thank H. Wiesemeier (IRAM) for his assistance with the data reduction, and D. Devost for providing us with his H image of NGC 1569. We also thank D. Bomans for interesting conversations about NGC 1569, and L. Greggio for a detailed discussion of its star formation history. This work has been supported by the Deutsche Forschungsgemeinschaft under the framework of the Graduiertenkolleg “The Magellanic System and Other Dwarf Galaxies”.References
- (1) Aalto, S., Booth, R.S., Black, J.H. & Johansson, L.E.B. 1995, A&A, 300, 369
- (2) Ables, H.D. 1971, Publ. U.S. Naval Obs. Sec. Ser. XX (IV), 61
- (3) Arnault, P., Casoli, F., Combes, F. & Kunth, D. 1988, A&A, 205, 41
- (4) Arp, H.C. & Sandage, A.R. 1985, AJ 90, 1163
- (5) Baas, F., Israel, F.P. & Koornneef, J. 1994, A&A, 284, 403
- (6) Braine, J. & Combes, F. 1992, A&A 264, 433
- (7) Becker, R., Henkel, C., Bomans, D.J. & Wilson, T.L. 1995, A&A, 295, 302
- (8) Carignan, C., Beaulieu, S. & Freeman, K.C. 1990, AJ, 99, 178
- (9) Cohen, J.G., Dame, T.M., Garay, G. Montani, J., Rubio, M. & Thaddeus, P. 1988, ApJ, 331, L95
- (10) Combes, F. 1991, ARAA, 29, 195
- (11) Della Ceca, R., Griffiths, R.E., Heckman, T.M. & MacKenty, J.W. 1996, ApJ, 469, 662
- (12) De Marchi, G., Clampin, M., Greggio, L., Leitherer, C., Nota, A. & Tosi, M. 1997, ApJ, 479, L27
- (13) Devost, D., Roy, J.-R. & Drissen, L. 1997, ApJ, 482, 765
- (14) Gondhalekar, P.M., Johansson, L.E.B., Brosch, N., Glass, I.S. & Brinks, E. 1998, A&A, 335, 152
- (15) Gonzalez Delgado, R.M., Leitherer, C., Heckman, T. & Cerviño, M. 1997, ApJ, 483, 705
- (16) Greggio, L., Tosi, M., Clampin, M., De Marchi, G., Leitherer, C., Nota, A. & Sirianni, M. 1998, ApJ, 504, 725
- (17) Greve, A., Becker, R., Johansson, L.E.B. & McKeith, C.D. 1996, A&A, 312, 391
- (18) Heckman, T.M., Dahlem, M., Lehnert, M.D., Fabbiano, G. Gilmore, D. & Waller, W.H. 1995, ApJ, 448, 98
- (19) Ho, L.C. & Filippenko, A.V. 1996, ApJ, 466, L83
- (20) Hodge, P.W. 1974, ApJ, 191, L21
- (21) Hunter, D.A., Hawley, W.N. & Gallagher, J.S. 1993, AJ, 106, 1797
- (22) Hunter, D.A., Thronson, H.A., Casey, S. & Harper, D.A. 1989, ApJ, 341, 697
- (23) Israel, F.P. 1988, A&A, 194, 24
- (24) Israel, F.P. 1997, A&A, 328, 471
- (25) Israel, F.P. & Burton, W.B. 1986, A&A, 168, 369
- (26) Israel, F.P. & de Bruyn, A.G. 1988, A&A, 198, 109
- (27) Israel, F.P., Tacconi, L.J. & Baas, F. 1995, A&A, 295, 599
- (28) Israel, F.P. & van Driel, W. 1990, A&A, 236, 323
- (29) Johansson, L.E.B., Greve, A., Booth, R.S., Boulanger, F., Garay, G., De Graauw, Th., Israel, F.P., Kutner, M.L., Lequeux, J., Murphy, D.C., Nyman, L.-A., Rubio, M. 1998, A&A, 331, 857
- (30) Kellman, S.A. 1972, ApJ, 175, 353
- (31) Kobulnicky, H.A., Dickey, J.M., Sargent, A.I., Hogg, D.E., & Conti, P.S. 1995, AJ, 110, 116
- (32) Kobulnicky, H.A. & Skillman, E.D. 1997, ApJ, 489, 636
- (33) Larson, R.B. 1981, MNRAS, 194, 809
- (34) Li, J.G., Seaquist, E.R. & Sage, L.J. 1993a, ApJ, 411, L71
- (35) Li, J.G., Seaquist, E.R., Wang, Z. & Sage, L.J. 1994, AJ, 107, 90
- (36) Li, J.G., Seaquist, E.R., Wrobel, J.M., Wang, Z. & Sage, L.J. 1993b, ApJ, 413, 150
- (37) MacLaren, I., Richardson, K.M. & Wolfendale, A.W. 1988, ApJ, 333, 821
- (38) Maloney, P. 1990, ApJ, 348, L9
- (39) Massey, P. & Armandroff, T.E. 1995, AJ, 109, 2470
- (40) O’Connell, R.W., Gallagher, J.S. & Hunter, D.A. 1994, ApJ, 443, 65
- (41) Prada, F., Greve, A. & McKeith, C.D. 1994, A&A, 288, 396
- (42) Puche, D., Westpfahl, D., Brinks, E., & Roy, J-R. 1992, AJ, 103, 1841
- (43) Reakes, M. 1980, MNRAS, 192, 297
- (44) Rubio, M., Lequeux, J., & Boulanger, F. 1993, A&A, 271, 9
- (45) Sage, L.J., Salzer, J.J., Loose, H.-H. & Henkel, C. 1992, A&A, 265, 19
- (46) Sakamoto, S., Hayashi, M., Hasegawa, T., Handa, T. & Oka, T. 1994, ApJ, 425, 641
- (47) Sanders, D.B., Scoville, N.Z. & Solomon, P.M. 1985, ApJ, 289, 373
- (48) Searle, L. & Sargent, W.L.W. 1972, ApJ, 173, 25
- (49) Sodroski, T.J. 1991, ApJ, 366, 95
- (50) Solomon, P.M., Rivolo, A.R., Barrett, J. & Yahil, A. 1987, ApJ, 319, 730
- (51) Strong, A.W., Bloemen, J.B.G.M., Dame, T.M., Grenier, I. A., Hermsen, W., Lebrun F., Nyman, L.-A., Pollock, A.M.T. & Thaddeus, P. 1988, A&A, 207, 1
- (52) Sternberg, A. 1998, ApJ, 506, 721
- (53) Stil, J.M. & Israel, F.P. 1998, A&A, 337, 64
- (54) Tacconi, L.J. & Young, J.S. 1987, ApJ, 322, 681
- (55) Taylor, C.L., Kobulnicky, H.A. & Skillman, E.D. 1988, AJ, 116, 2746
- (56) Thornley, M.D. & Wilson, C.D. 1994, ApJ, 421, 458
- (57) Thuan, T.X. & Martin, G.E. 1981, ApJ, 247, 823
- (58) Tomita, A., Ohta, K. & Saito, M. 1994, PASJ, 46, 335
- (59) Tully, B.R. 1988, Nearby Galaxies Catalog (Cambridge: Cambridge University Press)
- (60) Turner, J.L., Beck, S.C., & Hurt, R.L. 1997, ApJ, 474, L11
- (61) Vallenari, A. & Bomans, D.J. 1996, A&A, 313, 713
- (62) Vogel, S.N., Boulanger, F. & Ball, R. 1987, ApJ, 321, L145
- (63) Waller, W.H. 1991, ApJ, 370, 144
- (64) Wild, W., Harris, A.J., Eckart, A., Genzel, R., Graf, U.U., Jackson, J.M., Russell, A.P.G. & Stutzki, J., 1992, A&A, 265, 447
- (65) Wilson, C.D. 1994, ApJ, 434, L11
- (66) Wilson, C.D. 1995, ApJ, 448, L97
- (67) Wilson, C.D. & Matthews, B.C. 1995, ApJ, 455, 125
- (68) Wilson, C.D. & Rudolph, A.L. 1993, ApJ, 406, 477
- (69) Wilson, C.D. & Scoville, N. 1990, ApJ, 363, 435
- (70) Young, L.M. & Lo, K.Y. 1997, ApJ, 490, 710
- (71) Young, J.S., Gallagher, J.S. & Hunter, D. A. 1984, ApJ, 276, 476
- (72) Young, J.S., Schloerb, F.P., Kenny, J.D. & Lord, S.D. 1986, ApJ, 304, 443