74 MHz-VLA-Observation of Coma Berenices with Subarcminute Resolution – Observation, Data Reduction, and Preliminary Results
Abstract
We report on an ongoing project to map a region in Coma Berenices with the new 74 MHz receiver system of the VLA. The field is centered on the Coma cluster of galaxies. Coma Berenices has been observed in all VLA configurations, which allowed us to resolve several hundred point sources with 35 arcsecond resolution. We have successfully detected the diffuse emission from the Coma cluster radio halo, radio relic, and radio bridge. Difficulties and strategies of the observation and data reduction are discussed. Preliminary results are given.
1 Scientific Goals
The Coma cluster of galaxies contains one of the largest known radio halos, a prominent radio relic and a so called ‘radio bridge’ between them. Although it is one of the best studied clusters of galaxies, the processes leading to these diffuse radio emissions are not completely understood. The different proposed explanations are well covered by articles of several authors within the proceedings of this conference.
Since the diffuse radio emission has a steep spectral index () and seems to be more extended at lower frequencies, a 74 MHz-VLA observation seemed to be a promising project. The goals are:
-
to get information about the relativistic, low energy electron and magnetic field distribution in the Coma cluster
-
to search for extended emission outside of Coma, possibly connected with the ‘Great Wall’, a galaxy filament which contains the Coma cluster, and which extends over 100 Mpc.
-
to obtain fluxes and spectral indices of sources located in the field.
-
to search for ultra-steep spectrum sources, which would only appear at lowest frequencies.
-
to test and demonstrate the abilities of the new 74 MHz receiver system installed on all 27 VLA antennas. An earlier version installed on eight antennas had been successfully tested only with very bright sources (Kassim et al. 1993). But it was not yet clear how sensitive the system would be, or in our case, whether the faint diffuse emission of a cluster radio halo could be detected.
-
to develop an optimal observing and data reduction strategy for 74 MHz.
Observations in A-, B-, C-, and D-configuration of the VLA have been successfully undertaken. The data analysis is still in progress, but it is clear at the present stage that several of the goals will be accomplished.
2 Very Low Frequency Radio Observation
Simultaneous observations at 74 MHz and at 328 MHz were carried out. The latter frequency gives additional spectral information. It was also chosen to enable calibration by the phase-transfer method in case phase calibration at 74 MHz proved difficult. The details of this method are described in Kassim et al. (1993), who also give a general introduction to observations with the 74 MHz VLA receiver system. It turned out that the phase-transfer method was not necessary, since a sufficient number of strong sources located in the observing field allow for easy self-calibration (Pearson & Readhead 1984) of the 74 MHz data. But this need not to be always true: In the case of recent VLA galactic center observations the phase-transfer method was required to calibrate the 74 MHz data.
We observed in the VLA’s spectral line mode (128 channels for the 74 MHz observation and 64 channels for the 328 MHz observation) for two reasons:
-
radio frequency interference, externally generated by strong natural and artificial emitters and internally generated by the receiver electronics, is strong at low frequencies at the VLA. However it is generally very narrow-band and so the affected channels can be flagged.
-
the total bandwidth of 1.6 MHz leads to excessive bandwidth smearing over our large field of view. Imaging the data in spectral line mode allows to compensate for this.
3 Very Low Frequency Data Reduction
A tutorial for new users of the 74 and 330 MHz systems at the VLA has
been written up by Namir Kassim & Rick Perley. It is available from
http://rsd-www.nrl.navy.mil/7213/lazio/tutorial
and in the calibration sections of the NRAO VLA web pages through:
http://www.nrao.edu/
There are three main complications with low frequency radio observations at the VLA, which are less problematic at higher frequencies: the large primary beam, the impact of the ionosphere, and the strong radio frequency interference. New features of present (AIPS, Miriad), and upcoming software packages (AIPS++) help to deal with these problems.
3.1 Radio Frequency Interference
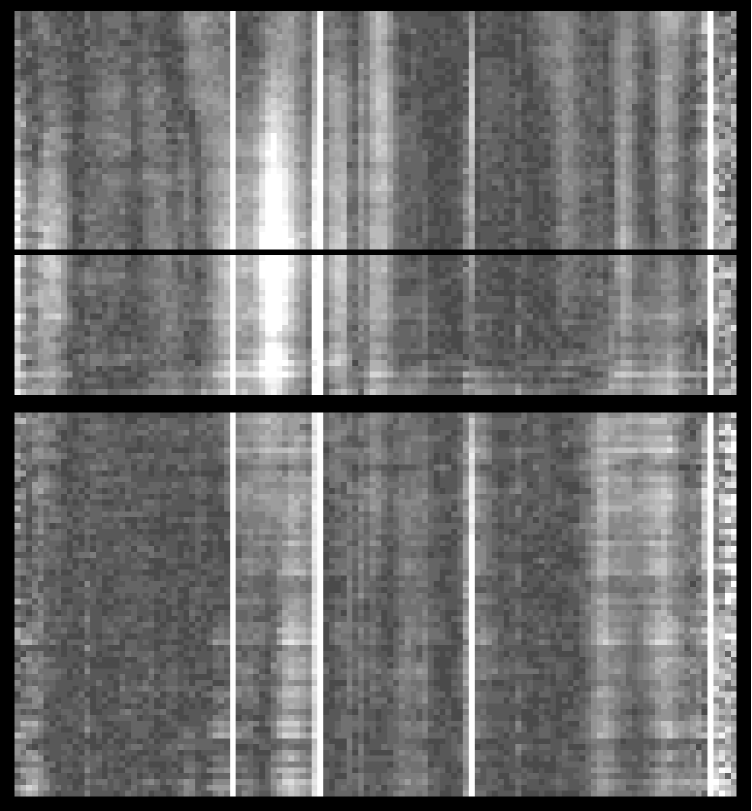
Radio frequency interference (RFI) can be external or internal, but is usually of very narrow bandwidth, so that it is easy to detect in a spectral line data base. The most recent version of AIPS has a new task (FLGIT) which greatly facilitates removal of RFI. In general, RFI is worst for the shortest baselines. An important test for the VLA 74 MHz system is to see if the data taken with compact array configurations can be used, despite the stronger RFI. The B- and C- configuration data from Coma have been successfully reduced. The data for the most compact D-configuration is not yet reduced, so final conclusions cannot be drawn. But the present results look very promising. An example of strongly RFI-affected data can found in Fig. 1.
3.2 Ionospheric Effects
Ionospheric turbulence on size scales of several km enters as time-variable antenna based phase variations, and decorrelates the signals on long baselines for the 74 MHz VLA. This simple fact has prevented high angular resolution and high sensitivity imaging on interferometers working at low frequencies ( MHz) since radio astronomy was developed, and as a result this region remains one of the poorest explored regions of the electro-magnetic spectrum. Hence the recent demonstration that phase self-calibration can correct this is important (Kassim et al. 1993). Self-calibration works robustly for 74 MHz VLA observations since typical fields of view contain numerous strong sources. This requires that the data have a sufficient time resolution. For A-configuration data the time integration interval should not exceed 10 s, and for the more compact configurations correspondingly longer. The same time resolution is required in any case to prevent the peripheral sources becoming smeared out due earth rotation.
Unfortunately, this ionospheric effect is different for the different parts of the image, due to different lines of sight through the ionosphere. Thus some miscalibration for some regions of the primary beam (typically peripheral regions) cannot be avoided. This problem might disappear when direction dependent self-calibration is possible in up-coming reduction software.
Observing at low elevations should be avoided, since the line of sight through the ionosphere is longest. Periods in which the ionosphere is turbulent also might best be removed completely from the database.
Finally, ionospheric refraction has an especially serious effect on the astrometry of 74 MHz VLA images, shifting the field of view though not distorting the brightness distribution (Erickson 1984). Shifts at 74 MHz are typically a few arcminutes and vary on time scales of tens of minutes. Self-calibration has no trouble ‘freezing out’ this refraction but leaves the image with an uncertain absolute position. Fortunately the grid of many tens to hundreds of known sources which normally appear on 74 MHz VLA images allows us to re-register the absolute position quite accurately relative to our angular resolution.
3.3 The Large Primary Beam
The large primary beam is beneficial, since it allows one to map a large fraction of the sky, but it causes several problems:
-
The large primary beam requires mapping of a large field, in order to reduce the sidelobes of strong sources. This requires a high computational effort.
-
The usual (fast) two dimensional fourier transform between UV- and image-plane approximates the sky by a (tangential) plane. For non-coplanar baselines, as with the VLA, this would lead to serious errors for a field of view as large as ours. The solution is either the use of a real three-dimensional code, or to split the field into small facets, which are small enough to let the planar approximation be valid (Cornwell & Perley 1992). We tried both approaches, but since the second method gives good results with a much smaller computational effort, we concentrated on the facet method. We used up to 64 facets, the limit of the present AIPS version111The 15OCT99 version of AIPS allows 512 facets., which are not enought to cover the whole field for A-configuration resolution.
-
The units of the UV-plane are baseline length divided by wavelength. These change over the bandwidth, so that averaging the spectral line data over the whole band prior to imaging leads to radial smearing of sources in image plane. The data therefore must be kept in spectral line mode, in order to suppress this bandwidth-smearing. However, the number of channels can be reduced by averaging, to keep the computational effort tolerable.
-
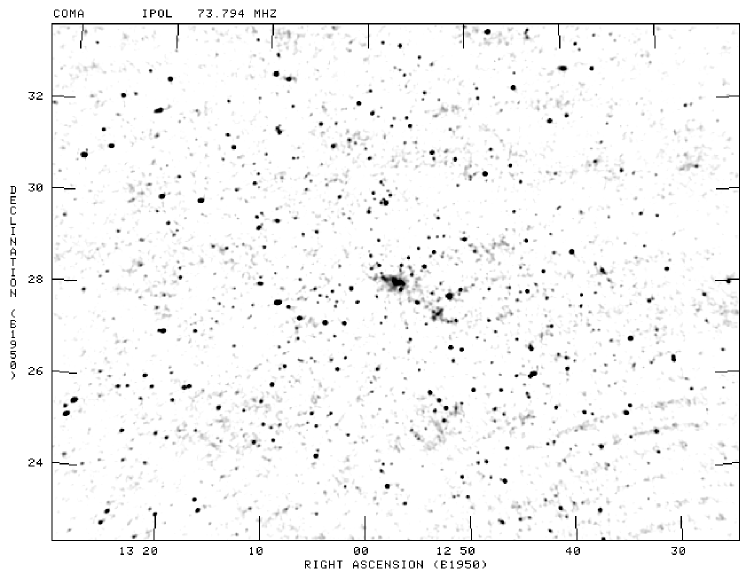
The array is sensitive to sources within a significant fraction of the sky, much larger than the primary beam. In our case Virgo A is located in the sidelobe of the VLA beam. Since the sidelobe pattern is non-axisymmetric, the gains of the telescopes for this source change with time. This makes a mapping and cleaning of the source difficult, with the result that it has large sidelobes all over the image (Fig. 2). We are currently pursuing two strategies in order to remove Virgo A from our dataset:
-
–
The information about the time dependent antenna gains is contained in the data itself. It should be possible to do a full (phase & gain) calibration on a good model of Virgo A, subtract it and go back to the original calibration. This should account for the time varying gains, since they will be estimated during the amplitude calibration.
-
–
Sault & Noordam (1995) have developed a method to remove continuum interference from sidelobe responses from a spectral line dataset. This method might be applicable in our case.
-
–
4 Preliminary Results
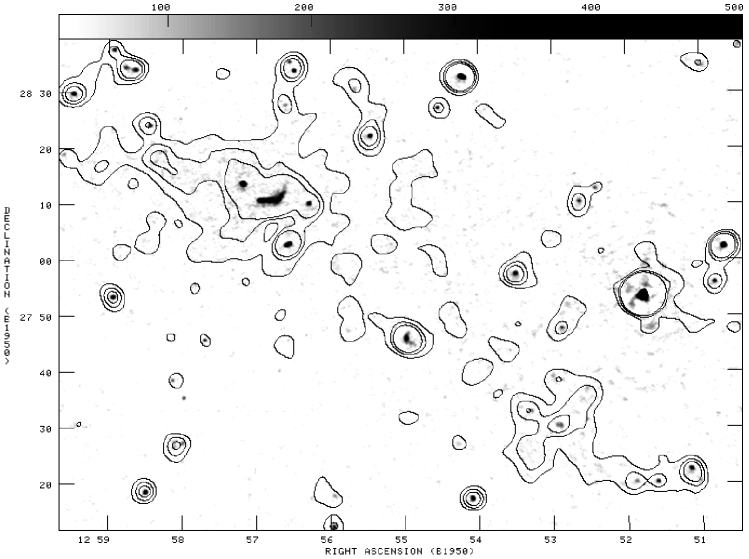
Self calibration of the data over the large field of view of was successful, as can be seen from the image in Fig. 2. A large number of point sources are visible, on the order of several hundred. Diffuse emission from Coma’s radio halo, radio relic and radio bridge was also detected. Combining A-, B-, and C-configuration data leads to a high resolution map, which we show in superposition with a smoothed contour map from the same data in Fig. 3. The theoretical resolution of is has not been achieved yet, but the current resolution of demonstrates the ability of the new VLA receiver system, and the self-calibration procedures to compensate for the ionospheric fluctuations. This map is preliminary and we expect that a further improvement in resolution will be achieved.
The level of noise in the high resolution image is 20 mJy/beam, reached with 12 h integration time in each of the three configurations. For comparison, the brightness of the radio halo is 40 mJy/beam.
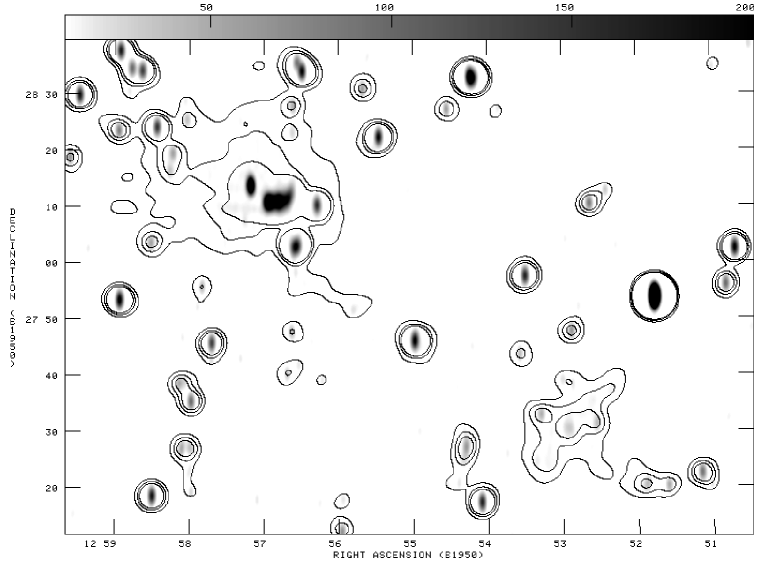
For comparison, we show a map of the 326 MHz emission measured with the Westerbork telescope by Kim et al. (1989). Fig. 4 was prepared in a similar way to Fig. 3. Several of the irregular features of the radio halo of Coma presented in the Westerbork map are confirmed by our 74 MHz observation. Note that diffuse emission on larger scales might still be missing on our 74 MHz map, since the UV-coverage is not complete. With C-configuration data included, we are sensitive to diffuse emission on scales less than . We expect that our D-configuration data will allow us to test for diffuse emission on scales up to . This is very interesting, since it is closer to the diameter of the ‘Great Wall’, a galaxy filament in which Coma is embedded. If there is diffuse low frequency radio emission connected to it, it might show up in this observation.
5 Conclusion and Outlook
We have successfully mapped Coma Berenices at 74 Mhz with 3 VLA configurations, and have data from the most compact one. The preliminary results are very encouraging, but more effort needs to be spent in understanding the artifacts, sidelobes of strong sources, and determining the optimal data reduction strategy. As the required software tools come on line, this low frequency system is now developing into a standard observing band at the VLA. Future increases in computational speed, especially by the use of parallel codes on multiprocessor computers, hopefully will allow a much faster reduction.
Scientific results relevant to the diffuse emission from the Coma cluster of galaxies can be expected soon, since the quality of our data is surprisingly good. Also, the fluxes of the several hundred point sources will be measured, giving us a survey of sources above 100 mJy in the Coma Berenices region with a single telescope pointing.
We hope that this study encourages more research in low frequency radio astronomy.
Acknowledgements.
We gratefully acknowledge Peter L. Biermann, Luigina Feretti, Gabrielle Giovannini, and Bob Hanisch for their work on the observation proposal. We are thankful to Tim Cornwell, Ron Ekers, Bill Erickson, Frazer Owen, Bob Sault and Greg Taylor for help and suggestions. This work took great advantage of recently developed software by Eric Greisen, whom we thank for this and his advice. We especially thank Jim Condon to make it possible to obtain VLA D-configuration data. TAE acknowledges support from the National Science and Engeneering Research Council of Canada (NSERC), the Max-Planck-Institut für Radioastronomie (MPIfR-Bonn) and the Studienstiftung des deutschen Volkes. He further acknowledges the warm hospitality of the Array Operation Center (AOC-Socorro) of the VLA, where most of the data reduction was done up to now. Basic research in radio astronomy at the Naval Research Laboratory is supported by the Office of Naval Research.References
- [1] Cornwell T.J., Perley R.A., 1992, A&A 261, 353
- [2] Erickson W.C., 1984, Journal of Astrophysics and Astronomy 5, 55
- [3] Kassim N.E., Perley R.A., Erickson W.C., Dwarakanath K.S., 1993, AJ 106, 2218
- [4] Kim K.T., Kronberg P.P., Giovannini G., Venturi T., 1989, Nature 341, 720
- [5] Pearson T.J., Readhead A.C.S. 1984, ARA&A 22, 97
- [6] Sault R.J., Noordam J.E., 1995, A&AS 109, 593