A Measurement of the Angular Power Spectrum of the CMB from
Abstract
We report on a measurement of the angular spectrum of the CMB between and made at 144 GHz from Cerro Toco in the Chilean altiplano. When the new data are combined with previous data at 30 and 40 GHz, taken with the same instrument observing the same section of sky, we find: 1) a rise in the angular spectrum to a maximum with K at and a fall at , thereby localizing the peak near ; and 2) that the anisotropy at has the spectrum of the CMB.
Subject headings:
cosmic microwave background — cosmology: observations1. Introduction
It is widely recognized that the characterization of the cosmic microwave background (CMB) anisotropy is essential for understanding the process of cosmic structure formation (e.g. Hu et al. (1997), Bennett et al. (1997), Turner & Tyson (1999)). If some of the currently popular models prove correct, the anisotropy may be used to strongly constrain cosmological parameters (e.g. Jungman et al. (1995), Bond et al. (1998)). Summaries of the state of our knowledge of the CMB (e.g. Bond et al. 1998b (BJK), Page & Wilkinson (1999)) suggest the existence of a peak in the angular spectrum near . In particular, BJK show . Since their analysis there have been additional results at that lend support to their picture (Baker et al. (1999) (CAT), Glanz (1999) (VIPER), Wilson et al. (1999) (MSAM)). Here, we report the results from the TOCO98 campaign of the Mobile Anisotropy Telescope (MAT) which probes from to .
2. Instrument
The MAT telescope, based on the design in Wollack et al. (1997), is described briefly in Torbet et al. (1999) and Devlin et al. (1998) and is documented on the web111Details of the experiment, synthesis vectors, likelihoods, data, and analysis code may be found at http://www.hep.upenn.edu/CBR/ and http://physics.princeton.edu/~cmb/.. In this paper, we focus on results from the two -band (144 GHz) channels. The receivers use SIS mixers designed and fabricated by A. R. Kerr and S.-K. Pan of NRAO and A. W. Lichtenberger of the University of Virginia (Kerr et al. (1993)). The six other detectors in the focal plane are 30 and 40 GHz high electron mobility transistor (HEMT) amplifiers designed by M. Pospieszalski (Pospieszalski (1992), Pospieszalski et al. (1994)).
The mixers, which operate in double sideband mode, are fed with a 25% bandwidth corrugated feed cooled to 4.5 K. The 144 GHz local oscillator (LO) is cavity stabilized and thermally controlled. The cryogenic IF HEMT amplifier, which operates between 4 and 6 GHz, is also of NRAO design. The resultant passband has been measured (Robertson (1996)) to be approximately 138-140 and 148-150 GHz. The total system sensitivity (including atmospheric loading) for each receiver is (Rayleigh-Jeans) with the SIS body operating at K.
The 1 feed (, at the center of the chop) is near the center of the focal plane, resulting in ( sr) while 2 is displaced from the center by 2.9 cm (, ), resulting in ( sr). 1 is polarized with the -field in the horizontal direction and 2 with the field in the vertical direction. No use is made of the polarization information in this analysis.
In the 1997 campaign (Torbet et al. (1999)), a microphonic coupling rendered the -band data suspect. The problem was traced to a combination of the azimuth drive motor and the chopper. The coupling was effectively eliminated for the 1998 campaign. In addition, the chopper amplitude was reduced from 296 to 202 and the frequency reduced from 4.6 Hz to 3.7 Hz. In all other respects, the instrument was the same as for 1997.
The telescope pointing is established through observations of Jupiter and is monitored with two redundant encoders on both the azimuth bearing and on the chopper. The absolute errors in azimuth and elevation are 004, and the relative errors are 01. The chopper position, which is calibrated in the field, is sampled 80 times per chop. When its rms position over one cycle deviates more than 0015 from the average position (due to wind loading), we reject the data.
The analysis uses data between 20 and 200 Hz. These frequencies are well removed from the refrigerator cycle frequency at 1.2 Hz, the chopper frequency, and the Nyquist frequency at 592 Hz. The amplitude of the electronic transfer function varies by % over this band.
3. Observations and Calibration
Data were taken at a 5200 m site222 The Cerro Toco site of the Universidad Católica de Chile was made available through the generosity of Prof. Hernán Quintana, Dept. of Astronomy and Astrophysics. It is near the proposed MMA site. on the side of Cerro Toco (lat = -2295, long = 67775), near San Pedro de Atacama, Chile, from Aug. 26, 1998 to Dec. 7, 1998. For the anisotropy data, the primary optical axis is fixed at az = 20741, el = 4076, = -609 and the chopper scans 612 of sky. We present here the analysis of data from Sept. 3, 1998 to Oct. 28, 1998.
Jupiter is used to calibrate all channels and map the beams. Its brightness temperature is 170 K in -band (Griffin et al. (1986), Ulich et al. (1981)) and the intrinsic calibration error is . We account for the variation in angular diameter. To convert to thermodynamic units relative to the CMB, we multiply by . The error is due to incomplete knowledge of the passbands.
After determining the beam parameters from a global fit of the clear weather Jupiter calibrations, the standard deviation in the measured solid angle is 5.5% for 1 and 4% for 2. Jupiter is observed on average within 2 hours of the prime observing time (approximately 10 PM to 10 AM local). The responsivity varies % over two months. In all, there are Jupiter calibrations in each channel.
To verify the calibration between observations of Jupiter, a 149 GHz tone is coupled to the detectors through the LO port for 40 msec every 200 seconds. Its effective temperature is K. There is good long term agreement between the Jupiter and pulse calibrations. The short-term ( 1 day) calibration is determined with a fit of the pulses to the Jupiter calibrations. The measurement uncertainty in the calibration is 7%.
The total 1 calibration error of 10% for 1 and 9% for 2 is obtained from the quadrature sum of the above sources. In the full analysis, 1 and 2 are combined; thus the uncorrelated component of the error adds in quadrature yielding an error for the combination of 8%.
4. Data Reduction
The data reduction is similar to that of the TOCO97 experiment (Torbet et al. (1999)). We use the terminology discussed there and in Netterfield et al. (1997), though we now use Knox filters (Knox (1999)) (in place of window functions) to determine the -space coverage. For 1 we form the 2-pt through 16-pt synthesized beams and for 2, the 2-pt through 17-pt synthesized beams. In practice, atmospheric contamination precludes using the 2-pt through 4-pt data and the achieved sensitivity renders the 17-pt and higher uninteresting. If there is atmospheric contamination in the 5-pt data, its level is under the 1 sigma error. For the 7-pt and higher, atmospheric contamination is negligible.
The phase of the time ordered data relative to the beam position is determined with observations of Jupiter and the Galaxy. In the analysis, we use the phase for each harmonic obtained when the quadrature signal from the Galaxy is minimized.
A quantity useful in assessing sensitivity to the beam shape is . For SK at , . For TOCO98 at , for 1 and 2.2 for 2. This corresponds to a separation of lobes in the synthesized beam of for 1 and for 2.
As with TOCO97, the harmonics are binned according to the right ascension at the center of the chopper sweep. The number of bins depends on the band and harmonic as shown in Table 1. For each night, we compute the variance and mean of the data corresponding to a bin. These numbers are averaged over the 25 good nights and used in the likelihood analysis.
After cuts based on pointing, the data are selected according to the weather. For each n-pt data set, we find the mean rms of 6.5 sec averages over 15 minute segments. When this value exceeds 1.2 of the minimum value for a given day, the data from that 15 min segment, along with the previous and subsequent 15 min segments are cut. The effect is to keep 5-10 hour blocks of continuous good data in any day, and to eliminate transitions into periods of poor atmospheric stability. Increasing the cut level adds data to the beginning and end of the prime observing time.
The stability of the instrument is assessed through internal consistency checks and we examine it with the distribution of the offset of each harmonic. The offset is the average of a night of data after the cuts have been applied (the duration ranges from 5-10 hours) and is typically of magnitude K with standard deviation K. The offsets for these data were stable over the campaign. The resulting is typically 1-4. For the offsets of the quadrature signal, is typically 1-2. The stability of the offset led to a relatively straightforward data reduction.
To eliminate the potential effect of slow variations in offset, we remove the slope and mean for each night for each harmonic. This is accounted for in the quoted result following Bond et al. (1991).
5. Analysis and Discussion
In the analysis, we include all known correlations inherent in the observing strategy. In computing the “theory covariance matrix” (BJK) which encodes the observing strategy, we use the measured two dimensional beam profiles. From the data, we determine the correlations between harmonics due to the atmosphere. Because the S/N is only 2-5 per synthesized beam, and the noise is correlated between beams, we work with groups of harmonics. This is similar to band averaging, though we use the full covariance matrix so as to include all correlations.
Table 1 gives the results of separate analyses of 1 and 2. Both channels show a fall in the angular spectrum above . The fact that the results agree is an important check as the receivers (other than the optics) are independent. It is not possible to compute 12 directly from the data because of the different beam sizes. The eventual production of a map will facilitate the comparison.
In the full analysis, 1 and 2 are combined. The resulting likelihoods are shown in Figure 1 along with the results of the null tests. Because 1 and 2 observe the same section of sky at different times, some care must be taken in computing the correlation matrices. The correlation coefficients between 1 and 2 due to the atmosphere are of order . The largest off-diagonal terms of the theory covariance matrix are . The quoted results are insensitive to the precise values of the off-diagonal terms of the covariance matrix. The combined analysis affirms what is seen in 1 and 2 individually and shows a peak in the angular spectrum near .
The angular spectrum of the TOCO97 and TOCO98 data agree in the regions of common . We compute the spectral index of the fluctuations by comparing band powers. We find , (including calibration error), where is the weighted mean of the two highest points for TOCO98 and is a similar quantity for TOCO97 (36.5 GHz is the average TOCO97 frequency). For the CMB, . For dust, corresponds to ; for free-free emission corresponds to . Though it is possible for spinning dust grains (Drain & Lazarian (1999)) to mimic this spectrum for our frequencies, the amplitude of this component is small (de Oliveira-Costa et al. (1998)). In addition, the spatial spectrum of diffuse sources like interstellar dust falls as (Gautier et al. (1992)), so the observed peak is inconsistent with our observations at .
The frequency spectral index of unresolved extra-Galactic sources is typically between 2 and 3, inconsistent with the measured index. In addition, the spatial spectrum of sources rises as , inconsistent with our observations at . Moreover, recent analyses (e.g. Tegmark (1999)) estimate the level of point source contamination to be much lower than the fluctuations we observe. We therefore conclude that the source of the fluctuations is the CMB.

We assess the statistical significance of the decrease in for by comparing just the likelihood distributions at (, Fig. 1), for which K, and , for which K (95%). These two distributions are effectively uncorrelated. The point at which is, coincidentally, the lower limit on and the 95% upper limit on . Thus, there is a 0.97 probability that is greater than the 95% upper limit on . In addition, the probability that K (the peak of ) is 0.996. When all the data in Figure 2 are considered, the significance of a decrease in for will be even higher.
The weighted mean of data from TOCO97, TOCO98, and SK between and 250, is K (the second error is calibration uncertainty). This is consistent with, though slightly higher than, the value from the Wang et al. (1999) concordance model plotted in Figure 2, which gives K. In the context of this model, the high favors a smaller (e.g. larger “cosmological constant”) or more baryons.
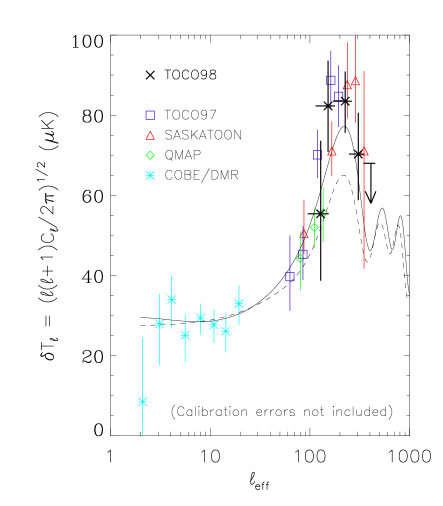
Figure 2 shows results taken over six years and seven observing campaigns and three different experiments. Though a detailed confrontation with cosmological models will have to await a thorough analysis and comparison with other experiments, a straightforward read of the data indicates a rise to K at and a fall at . The data strongly disfavor models with a peak in the spectrum at . Future work will include the analysis of the TOCO98 HEMT and remaining -band data.
References
- Baker et al. (1999) Baker, J. C., Grainge, K., Hobson, M. P., Jones, M. E., Kneissl, R., Lasenby, A. N., O’Sullivan, C. M. M., Pooley, G. Rocha, G., Saunders, R., Scott, P.F., Waldram, E.M. 1999, Submitted to MNRAS, astro-ph/9904415
- Bennett et al. (1997) Bennett, C. L. , Turner, M. S., White, M. 1997, Physics Today, 50, 11, 32
- Bond et al. (1991) Bond, J. R., Efstathiou, G., Tegmark, M., Lubin, P.M., & Meinhold, P.R. 1991, Phys. Rev. Lett., 66, 2179
- Bond (1996) Bond, J. R. 1996 Theory and Observations of the Cosmic Microwave Background Radiation, in “Cosmology and Large-Scale Structure,” Les Houches Session LX, August 1993, ed. R. Schaeffer, Elsevier Science Press
- Bond et al. (1998) Bond, J. R., Efstathiou, G., Tegmark, M. 1998, MNRAS, 50, L33-41
- (6) Bond, J. R., Jaffe, A. H., Knox, L. 1999, Accepted in ApJ, astro-ph/9808264
- de Oliveira-Costa et al. (1997) de Oliveira-Costa, A., Kogut, A., Devlin, M. J., Netterfield, C. B., Page, L. A., Wollack, E. J. 1997 ApJ, 482, L17-L20
- de Oliveira-Costa et al. (1998) de Oliveira-Costa, A., Devlin, M. J., Herbig, T. H., Miller, A.D., Netterfield, C. B., Page, L. A. & Tegmark, M. 1998 ApJ, 509, L77
- de Oliveira-Costa et al. (1998) de Oliveira-Costa, A., Tegmark, M., Page, L. A., Boughn, S. 1998 ApJ, 509, L9
- Devlin et al. (1998) Devlin, M. J., de Oliveira-Costa, A., Herbig, T., Miller, A. D., Netterfield, C. B., Page, L. A., & Tegmark, M. 1998, ApJ, 509, L73
- Drain & Lazarian (1999) Drain, B. T. & Lazarian, A. 1999, astro-ph/9902356, in Microwave Foregrounds, ed A. de Oliveira-Costa & M. Tegmark (ASP:San Francisco)
- Gautier et al. (1992) Gautier, T. N. I., Boulanger, M., Perault, M., Puget, J. L. 1992, AJ, 103, 1313
- Glanz (1999) Glanz, J. 1999. In the “News” section, Science, Vol 283. See also the VIPER web site at http://cmbr.phys.cmu.edu
- Griffin et al. (1986) Griffin, M. J., Ade, A. R., Orton, G. S., Robson, E. I., Gear, W.K., Nolt, I. G., and Radostitz, J. V. 1986, Icarus, 65, 244
- Hu et al. (1997) Hu, W., Sugiyama, N., and Silk, J. 1997, Nature, 386, 37
- Jungman et al. (1995) Jungman, G., Kamionkowski, M., Kosowsky, A., and Spergel, D. N. 1995, Phys. Rev. D., 54, 1332
- Kerr et al. (1993) Kerr, A. R., Pan, S.-K., Lichtenberger, A. W., and Lloyd, F. L. 1993, Proceedings of the Fourth International Symposium on Space Terahertz Technology, pp 1-10
- Knox (1999) Knox, L. 1999, astro-ph/9902046
- Mason et al. (1999) Mason et al. 1999, astro-ph/9903383
- Netterfield et al. (1997) Netterfield, C. B., Devlin, M. J., Jarosik, N., Page, L., & Wollack, E. J. 1997, ApJ, 474, 47
- Page & Wilkinson (1999) Page, L. and Wilkinson, D. T. 1999, Centenary Rev Mod Phys 71, S173
- Pospieszalski (1992) Pospieszalski, M. W. 1992, Proc. IEEE Microwave Theory Tech., MTT-3 1369; and Pospieszalski, M. W. 1997, Microwave Background Anisotropies, ed F. R. Bouchet (Gif-sur-Yvette: Editions Frontirr̀es): 23-30
- Pospieszalski et al. (1994) Pospieszalski, M. W. et al. 1994, IEEE MTT-S Digest 1345
- Robertson (1996) Robertson, T. L., 1996. “Development of a 144 GHz Cryogenic Heterodyne Radiometer Based on SIS Junctions,” Princeton Sr. Thesis (Adv. L. Page)
- Seljak & Zaldarriaga (1998) Seljak, U. and Zaldarriaga, M. 1998. The CMBFAST code is available through http://www.sns.ias.edu/matiasz/CMBFAST/cmbfast.html. See also 1996 ApJ469, 437-444
- Smoot et al. (1997) Smoot, G. F., et al. 1992, ApJ, 396, L1
- Tegmark (1997) Tegmark, M. 1997, PRD, 55, 5895
- Tegmark (1999) Tegmark, M., Eisenstein, D., Hu, W., & de Oliveira-Costa, A. 1999, Submitted to ApJ, astro-ph/9905257
- Torbet et al. (1999) Torbet, E., Devlin, M. J., Dorwart, W. Herbig, T., Nolta, M. R., Miller, A. D., Page, L., Puchalla, J., & Tran, H. 1999, ApJ, 521, L79
- Turner (1999) Turner, M. S., 1999, astro-ph/9904051
- Turner & Tyson (1999) Turner, M. S. and Tyson, J. A. 1999 Centenary Rev Mod Phys 71, S145
- Ulich et al. (1981) Ulich, B. L. 1981, AJ, 86, 11, 1619
- Wang et al. (1999) Wang, L., Caldwell, R. R., Ostriker, J. P. & Steinhardt, P. J. 1999, astro-ph/9901388
- Wilson et al. (1999) Wilson, G. W., et al. 1999, Submitted to ApJ, astro-ph/9902047
- Wollack et al. (1997) Wollack, E. J., Devlin, M. J., Jarosik, N., Netterfield, C. B., Page, L., Wilkinson, D. 1997, ApJ, 476, 440-447
| 1 | 1 | 1 | 2 | 2 | 2 | 1+2 | 1+2 | |
|---|---|---|---|---|---|---|---|---|
| aafootnotemark: | n-pt | bbfootnotemark: | ccfootnotemark: | n-pt | bbfootnotemark: | ccfootnotemark: | bbfootnotemark: | ccfootnotemark: |
| K | K | K | ||||||
| 128(84) | … | … | … | 5 | ||||
| 128(84) | 5,6 | 6 | ||||||
| 192(125) | 7,8 | 7-10 | ||||||
| 256(165) | 9-12 | 11,12 | 95% | |||||
| 384(250) | 13-16 | 95% | 13-17 | 95% | 95% |