Global Star Formation Rates in Disk Galaxies and Circumnuclear Starbursts from Cloud Collisions
Abstract
We invoke star formation triggered by cloud-cloud collisions to explain global star formation rates of disk galaxies and circumnuclear starbursts. Previous theories based on the growth rate of gravitational perturbations ignore the dynamically important presence of magnetic fields. Theories based on triggering by spiral density waves fail to explain star formation in systems without such waves. Furthermore, observations suggest gas and stellar disk instabilities are decoupled. Following Gammie, Ostriker & Jog (1991), the cloud collision rate is set by the shear velocity of encounters with initial impact parameters of a few tidal radii, due to differential rotation in the disk. This, together with the effective confinement of cloud orbits to a two dimensional plane, enhances the collision rate above that for particles in a three dimensional box. We predict . For constant circular velocity (), this is in agreement with recent observations (Kennicutt 1998). We predict a B-band Tully-Fisher relation: , also consistent with observations. As additional tests, we predict enhanced star formation in regions with relatively high shear rates, and lower star formation efficiencies in clouds of higher mass.
Subject headings: galaxies: starburst and spiral — ISM: clouds — stars: formation
1 Introduction
Understanding how the global star formation rates (SFRs) of galaxies and starbursts depend on their physical properties is essential for an understanding of galaxy evolution. Furthermore, such knowledge can also reveal much about the star formation process itself.
Empirically, in disk galaxies (Kennicutt 1989 & 1998, hereafter K89 & K98) and the circumnuclear disks of starbursts (Kenney 1997; Downes & Solomon 1998, hereafter DS98), star formation occurs in regions where the gas disk is unstable to gravitational perturbation growth. This can be expressed as a condition on the surface density of gas:
| (1) |
(Toomre 1964, Quirk 1972), where is the gas velocity dispersion; is a dimensionless constant near unity, to account for deviations of real disks from the idealized Toomre thin disk, single fluid model; is a dimensionless parameter and is the epicyclic frequency:
| (2) |
is the circular velocity at a particular galactocentric radius , and , which is for a flat rotation curve. From the outermost galactic star forming regions, K89 finds , assuming . is expected, because of the destabilizing influence of a stellar disk (Jog & Solomon 1984, Jog 1996). Where , for a certain range of scales, the gas disk is gravitationally unstable, and fragments into bound clouds. When stars form, the energy they release raises and star formation is hypothesized (e.g. Silk 1997) and observed (K89, DS98) to self-regulate, so that .
All star formation is observed to occur in molecular clouds, and the majority in giant molecular clouds (GMCs), with masses (see Blitz & Williams 1999 and McKee 1999 for reviews). However, K89 reported the surprising result that the correlation of SFR with the surface density of molecular gas was much weaker than with the total (atomic + molecular). Uncertainties in CO to conversion may account for some of the poor correlation, however, the data suggest the immediate supply of gas controlling the SFR is both atomic and molecular. This implies the atomic to molecular conversion timescale, , is short compared to the timescale on which star formation is regulated. Spitzer (1978) finds the rate constant for molecule formation on dust grains to be approximately , for typical Galactic interstellar medium (ISM) metallicities. Ignoring destruction processes, a naive estimate of the time to convert a region with , perhaps created from the collision of two atomic clouds, to H2, gives , which is a relatively short timescale.
Where , the SFR is observed to be correlated with gas density. Schmidt (1959) introduced the parameterization of the volume densities , with . By looking at about one hundred different galactic and circumnuclear starburst disk systems, K98 found a similar relation for disk averaged surface densities of gas and star formation, valid over five orders of magnitude in ,
| (3) |
with (figure 1) (however, see Taniguchi & Ohyama 1998). K98 finds the SFR is also correlated with the orbital angular frequency, , via
| (4) |
(figure 2). is measured at the outer radius of the star forming region (see §2.3.2).
Previous theories for explaining these relations fall into two broad categories, based either on the growth rate of gravitational perturbations in a disk or on the triggering of star formation in gas passing through spiral or bar density waves. In this paper we present a third paradigm, in which cloud collisions determine the SFR.
The timescale for perturbation growth can be expressed as (e.g. Larson 1988, 1992; Elmegreen 1994; Wang & Silk 1994), and so . Assuming a constant disk scaleheight, we obtain equation (3) with for local surface densities. However, disk averaged quantities will depend on the radial gas distribution. We can also express . Perturbation growth via swing amplification in a differentially rotating disk grows in a similar manner (e.g. Larson 1988). By assuming star formation self-regulates and keeps constant, Larson (1988) and Wang & Silk (1994) predict , since , for disks with flat rotation curves.
However, these theories neglect the effects of magnetic fields and the viscosity of the ISM. Gammie (1996) finds these significantly reduce the growth rate of non-axisymmetric perturbations for typical Galactic conditions. Furthermore, most Galactic disk stars form in localized, highly clustered regions (Lada, Strom & Myers 1993) in GMCs, and most of the gas in the disk, including most of the bound gas, is not directly involved in the star formation. In GMCs static magnetic fields play a dynamically important role (e.g. McKee 1999, Heiles et al 1993). Their presence sets a critical mass,
| (5) |
(Bertoldi & McKee 1992) for spherical clouds, where and . For the diffuse ISM (Elmegreen 1985; Mestel 1985) with and , we have , which is typical for a GMC. Below this mass gravitational collapse is impossible without ambipolar diffusion, and even for greater masses, there will still be a significant effect. Collapse may also be impeded by turbulent magnetic pressure, generated from energy injected by the first stars to form in a cloud. McKee (1999) has modeled these higher mass clouds as being in approximate hydrostatic equilibrium with low mass star formation providing support. The data supporting the empirical Schmidt laws (equations 3 and 4) are sensitive only to high mass stars. Since collapse mediated by ambipolar diffusion occurs on a timescale, , much greater than the free-fall time, , we conclude it is inaccurate to use the rate of purely gravitational perturbation growth of the disk averaged ISM and ignoring magnetic fields, to predict global SFRs.
The spatial correlation of star formation with large scale spiral structure in some disk galaxies motivates theories for the triggering of star formation during the passage of gas through density waves. Wyse (1986) and Wyse & Silk (1989) propose a SFR law of the form
| (6) |
where is the pattern frequency of the spiral density wave. In the limit of small and for we recover equation (4). The outer radius of star formation is predicted to be the co-rotation radius, in approximate agreement with observations. Increased cloud collision rates and increased perturbation growth rates in the arms, where is locally lowered, have been suggested as the star formation triggering mechanism. These will be further discussed in §2.4. Ho, Filippenko & Sargent (1997) investigate the influence of bar density waves on star formation in the nuclear regions of disk galaxies, finding enhancements in the SFRs of early type spirals. They argue this is due to the bar channeling gas to the central region, however the presence of a bar is neither a necessary nor sufficient condition for nuclear star formation. The wide range in the strength of nuclear HII regions, whether a bar is present or not, suggests that it is not the passage of gas through a density wave which mediates the star formation rate within a particular starburst.
One prediction of these theories is a correlation of SFR with the density wave amplitude. However this is not observed (Elmegreen & Elmegreen 1986; McCall & Schmidt 1986, K89). Furthermore such theories have difficulty explaining star formation in galaxies where there is a lack of organized star formation features, as in flocculent spirals (Block et al 1994; Sakamoto 1996; Thornley & Mundy 1997a and 1997b; Grosbol & Patsis 1998), some of which even contain moderate amplitude density waves as revealed in the near infra-red. GMCs are present and SFRs are similar to those systems where star formation is organized into spiral patterns. This suggests stellar disk instabilities, which create spiral density waves, and gas instabilities, which lead to GMCs and large-scale star formation, are decoupled in the sense that one does not cause the other (K89; Seiden & Schulman 1990). This decoupling highlights the need for a theory which physically motivates the Schmidt Law of equation (4) without the need for coherent density waves.
In this paper we outline such a theory. The SFR, dominated by stars forming in clustered regions, with high mass stars present, is controlled by collisions between gravitationally bound gas clouds, which can be atomic, molecular or both. We find the collision time is a fraction of the orbital period. Collisions create localized, over-dense regions where high mass star formation occurs. The pre-collision clouds are formed relatively quickly by the action of gravitational, thermal or Parker instabilities, growing in regions where . However, their collapse is halted by static and turbulent magnetic pressure support. The latter may be produced by low mass star formation regulated by ambipolar diffusion (e.g. McKee 1989), which does not dominate the global galactic SFR. Thus the rate limiting step for star formation is not the formation of bound clouds, but the compression of these, or parts of these, in cloud-cloud collisions. Therefore at any particular time, most of the bound gas is not undergoing collision induced star formation. There is no specific need for large scale, coherent density waves.
There is some evidence for collision induced star formation in the Galaxy. Scoville, Sanders & Clemens (1986) noted the efficiency per unit mass of H2 for OB star formation decreases significantly with increasing cloud mass over the range to (see also §2.3.3) and concluded the principal trigger for star formation is not an internal mechanism, such as the growth rate of gravitational instability or sequential star formation. Scoville et al suggested the approximately quadratic dependence of the Galactic H II region distribution on the local H2 density (averaged on scales pc) was evidence for cloud collisions causing massive star formation. Detailed observations of individual star forming regions also suggest cloud collisions are an important triggering mechanism (Scoville et al 1986; Maddalena et al 1986; Hasegawa et al 1994; Greaves & White 1991; Womack, Ziurys, & Sage 1993). Clouds with embedded clusters of star formation have broader distributions of optical polarization angles than clouds without star formation (Myers & Goodman 1991). This may indicate accumulation of gas at super-Alfvenic speeds in these star forming regions from the collision of two clouds with distinct magnetic field alignments. Note, the results of Myers & Goodman suggest the enhanced dispersion in polarization angles is more closely associated with the presence of dense gas than with the young stars which subsequently form. Computer simulations of collisions between inhomogeneous clouds (Klein & Woods 1998) reveal the formation of high density clumps embedded in filamentary structures, via a bending mode instability. Such structures are abundant in OMC-1 (Wiseman & Ho 1994, 1996) and Taurus (Ungerechts & Thaddeus 1987). In modeling starbursting systems IC 1908 and NGC 6872, Mihos, Bothun & Richstone (1993) were unable to reproduce observations of enhanced SFRs in regions of high velocity dispersion and circular velocity gradients, where cloud collision rates are high, with traditional, non-collisional prescriptions of star formation.
While there is much evidence for cloud collisions playing an important role in inducing star formation, it is not yet clear if the majority of star formation is triggered by this process. The data supporting equations (3) and (4) are sensitive only to high mass star formation, although the bulk of stars are expected to form in these regions (Lada et al 1993). The theory of collision induced star formation outlined below, requires the initial trigger for most star formation to be a cloud collision. However, subsequent triggering by other processes, such as self-propagating star formation, from the initial site, is not excluded.
The rest of this paper is set out as follows. In §2.1 we set out our preliminary assumptions, and derive results for gas disks, independent of the hypothesis of collision induced star formation. In §2.2 we derive a SFR law of the form in the case of uniform circular velocity, based on star formation from cloud collisions. In §2.3 we compare this law to observations and make predictions of radial SFR profiles, SFR fluctuations due to different shear velocities, dependencies of disk averaged SFR with gas density (Schmidt law) and circular velocity (B-band Tully-Fisher relation) and how the efficiency of star formation depends on cloud mass. Such tests are required to distinguish this theory from those involving the growth rate of gravitational perturbations or triggering by density waves. In §2.4 we examine how large scale spiral density waves affect the collisional theory. Finally, in §2.5 we consider the theory’s application to the circumnuclear disks of starbursts, which make up most of the dynamic range in the data supporting a global Schmidt law (K98).
2 Star Formation from Cloud Collisions
2.1 Preliminary Assumptions
The star forming regions under consideration are thin, self-gravitating disks. Self-regulated star formation (e.g. Silk 1997) enforces the condition . The circumnuclear disks of starbursts (DS98) and the star-forming regions of disk galaxies (K89) satisfy these conditions. For , an overdensity on scales in the critical range leads to a bound object and we assume instabilities drive most of the gas mass into bound clouds. Gravitational, Parker and thermal instabilities have been considered (e.g. Wada & Norman 1999; Burkert & Lin 1999; Elmegreen 1991). The effect of cloud growth via collisional coagulation has also been examined (e.g. Oort 1954; Field & Saslaw 1965; Kwan & Valdes 1987; Das & Jog 1996). Gas in the bound clouds can be either atomic or molecular. In the Milky Way, extended HI envelopes are commonly observed around molecular clouds (e.g. Moriarty-Schieven, Andersson & Wannier 1997; Williams & Maddalena 1996; Elmegreen 1993; Blitz & Williams 1999, §2.3). Although Andersson & Wannier (1993) conclude the HI around low mass () clouds is not gravitationally bound, for larger GMCs (), the situation is probably reversed (Blitz, private communication). In the solar neighborhood the mass in atomic envelopes is similar to the mass in GMCs (Blitz 1990). Thus, out to about 8 or 9 kpc, most of the gas in the Galaxy is in self-gravitating clouds. As gas densities and pressures increase towards the centers of galaxies, the molecular fraction of the gas is expected to increase, until it is almost completely molecular in the circumnuclear disks of starbursts (e.g. Liszt & Burton 1996, DS98).
For simplicity we describe the cloud population with a single, typical mass, . In galactic disks, this approximation is justified by the observed mass spectrum of GMCs in the Milky Way, , with , and with an exponential cutoff above (e.g. Solomon et al 1987). Note, these are only the molecular masses. Most of the gas mass is in the large clouds. Observations suggest circumnuclear disks are clumpy and the typical mass is much larger (DS98). However, there is little evidence for the form of the mass function. For galactic disks we set , while for circumnuclear disks we consider clouds with . The properties and timescales associated with these clouds are shown in Tables (1) and (2).
The cloud radius, , is smaller than its tidal radius, , defined as the radial distance from the cloud’s center, at which the shear velocity, , due to differential galactic rotation, is equal to the escape velocity from the cloud at that distance. The shear velocity of two orbits separated by a radial distance, , is
| (7) |
and so for
| (8) |
is the galactic mass interior to , assuming a spherical distribution. This approximation is valid at larger , when the dark matter halo begins to dominate over the disk mass. For smaller , and particularly for the circumnuclear disks of starbursts, this is not the case. However, for simplicity, we keep this formalism, where is understood to be the “equivalent interior galactic mass”, if the distribution was spherical instead of disk-like. Equation (8) implies for solid body rotation, when and thus . For most of the star-forming circumnuclear and galactic disks rotation curves are flat (DS98; K89), and we have
| (9) |
is of order 100 pc for the fiducial values of in circumnuclear and galactic disks. The relation between and will be discussed in more detail in §2.2.
The dimensions of the clouds are comparable to the scaleheight of the gas disk (e.g. Solomon et al 1987; DS98), and so we describe the cloud distribution with a thin, two dimensional disk. We also assume an approximately axisymmetric distribution, so there is a single value of at any particular . Galaxies with strong spiral arms and thus non-axisymmetric gas distributions will be discussed in §2.4.
We assume the cloud velocity dispersion, , results from a balance of heating via gravitational torquing from non-collisional encounters and cooling via dissipative collisions. Gammie et al (1991) numerically integrated orbits for two-body encounters to obtain
| (10) |
valid for and in approximate agreement with Galactic observations (e.g. Stark & Brand 1989; Knapp, Stark & Wilson 1985; Clemens 1985). For a flat rotation curve, this is approximately the shear velocity of an encounter of impact parameter, . The surface densities of real disks, set by , are such that the effects of many-body interactions may be important. N-body simulations are required to probe these effects. Substituting for in equation (1), we derive the radial distribution of gas,
| (11) |
Note K89, assumed was independent of , which leads to an underestimation of , by factors of a few, in the central galactic regions compared to the case where equation (10) is used instead. This may explain the slight trend of decreasing by factors of a few as one moves towards the centers of galaxies, (K89, figure 11), rather than remaining constant. However, better statistics are required before a proper comparison can be made.
When , the assumption that most of the gas mass is organized in bound clouds breaks down, together with our use of equation (10). The presence of a large scale stellar bar, channeling gas radially inwards, will deplete the gas from certain regions, thus raising . Here we expect little or no star formation. This may be the situation in the inner few kpc of the Milky Way (e.g. Binney et al 1991).
2.2 The Collision Induced SFR
Our principal hypothesis is that cloud collisions, by compressing parts of the clouds, induce the majority of star formation in galactic and circumnuclear disks. However, collisions can also be disruptive. A simple theoretical condition for colliding clouds to remain bound has been given by Larson (1988). Neglecting post-shock cooling, the clouds stay bound if the ram pressure, , is less than the binding pressure, , where and are the cloud volume and surface densities respectively. For typical galactic disk cloud properties in table 1, this implies , which is higher than the mean value for GMCs () by a factor of about five. Realistic clouds are probably more extended, with a gradually decreasing density profile. Interactions in these outer layers reduce the actual relative velocity from the value quoted in table 1. Radiative post-shock cooling reduces the disrupting pressure, and thus also relaxes the above condition. Therefore we expect some collisions to lead to an increase in mass, density and the gravitational potential energy of the clouds involved, and hence the likelihood of faster SFRs.
The outcome of cloud collisions has also been investigated numerically (e.g. Lattanzio et al 1985), but the simulations have usually been unable to resolve the Jeans length, thus violating the numerical Jeans condition (Truelove et al 1997). Furthermore, there has been no systematic attempt to probe the parameter space of cloud collisions, as defined by the angle of collision, impact parameter, Mach number and mass ratio. Magnetic fields have yet to be included. For the idealized cases considered, the results of a collision depend sensitively on the collision parameters (Klein, private communication; Lattanzio et al 1985). We make the simplifying assumption that the fraction of a cloud converted into stars in a typical collision, averaging over the parameter space of possible collisions, is constant.
We consider the thin disk of self-gravitating clouds described in §2.1, where . We hypothesize is, on average, inversely proportional to the collision time, , of these clouds. A fraction, , of each gas cloud is converted into stars in each burst of collision induced star formation. The time between bursts is , where is the fraction of collisions which lead to star formation. Thus,
| (12) |
where is the surface number density of gravitationally bound clouds per unit area of the disk. By numerically solving the equations of motion, Gammie et al (1991, figure 8), found cloud-cloud collisions result from encounters caused by differential rotation, primarily with initial impact parameters of about , and with a spread in values of order 111The length unit used in Gammie et al (1991) corresponds to . For typical GMC parameters in the Galaxy, the associated shear velocity is . This sets the collision rate, together with the cloud surface density, , and the probability of collision, , of these encounters. Note, the random velocity dispersion of the cloud population ( e.g. Stark & Brand 1989) sets the clouds moving on epicycles, but is not the velocity directly influencing the collision rate. The effect of these random motions has been accounted for in the calculations of Gammie et al, since they consider the collision of clouds which are already moving on epicycles. Increasing the random motions increases the initial impact parameters at which most cloud collisions occur, raising the shear velocity and thus the collision rate. We express as
| (13) |
where the first factor of accounts for clouds either catching up with others at larger or being caught up with by clouds at smaller . is the mean free path of a cloud to catch up, or be caught up to, by another. is the shear velocity of an encounter with impact parameter , due to differential rotation.
We evaluate the factor via
| (14) |
As in equation (11), we have used and assumed the velocity dispersion of the gas clouds results from gravitational torquing (Gammie et al 1991) so that , with . So and is constant where is constant. Thus every area element, , of the disk approximately contains the mass of gas, , required to set . Thus, from equation (13),
| (15) |
From Gammie et al (1991) we set . We expect it to scale as . We consider cloud boundaries to be set by pressure confinement from the general ISM pressure, . Following Elmegreen (1989) we have
| (16) |
where and are the stellar surface density and velocity dispersion respectively. The boundary pressure of the self-gravitating clouds is a few times less than the interior cloud pressure, , where . Since implies , and with , we have
| (17) |
Observationally, and have approximately similar spatial distributions, and so from equation (17) we see that , and thus , varies only very slowly with . From here on we take it to be a constant.
2.3 Predictions of Collision Induced Star Formation
2.3.1 Radial Profiles
With high resolution data for , , including atomic and molecular components, and , equation (18) can be directly tested. This is practical for the Milky Way and nearby galaxies, but difficult for circumnuclear disks of starbursts because of their small size. Star formation from cloud collisions is a stochastic process and so statistically significant data sets are required. Properly identifying bound clouds requires atomic and molecular observations, so the masses of both components can be accounted for.
The assumption that the cloud velocity dispersion is caused by gravitational torquing (Gammie et al 1991), also leads to the prediction of (equation 11). Combining this with equation (18) leads to
| (20) |
which is proportional to for constant . If observations of are lacking, then the theory can still be tested using equation (20) and SFR and circular velocity data, for an assumed constant . Note, is, in general, difficult to determine. However surveys of Galactic CO (e.g. Sanders et al 1986) find no strong evidence for systematic variation (Solomon et al 1987; Scoville et al 1987). Furthermore any variation is weakened by being raised to the power in equation (20). If galactic stellar disks have been built up primarily through self-regulated star formation, where , then we also have as an additional prediction.
Several authors have presented radial profiles of and for individual galaxies (e.g. Tacconni & Young 1986; Kuno et al 1995). However, problems of accounting for the varying extinction of the tracers of star formation, such as H and Br make direct comparison difficult. Similarly, where FIR emission is used as a SFR estimator, the heating contributions from young stars, old stars and possible AGN activity must be disentangled. A follow-up paper to K98, (Martin & Kennicutt 2000), will present radial data for many galaxies, accounting for these effects.
One distinct prediction of this theory results from the extra dependence of the SFR on variations in the circular velocity. Statistically, we expect negative velocity gradients in the rotation curve to increase the SFR and positive gradients to decrease it. Regions of solid body rotation will be free of collisions resulting from shearing motions. Thus we expect star formation here to have a different triggering mechanism. These regions provide a good control environment for testing the collisional theory. In general, we expect a positive correlation between the SFR and the velocity dispersion of the clouds. With higher random velocities they move on larger epicycles, and encounters with greater initial impact parameters and greater shear velocities occur, leading to increased collision rates222Complications arise if the likelihood of star formation changes significantly with the increase in relative velocity of the collision. Numerical simulations are required to investigate this effect.. No such prediction is made by the theory of star formation triggered by the rate of gas passage through spiral arms. In a future paper we plan to investigate this question with high resolution BIMA and VLA data.
2.3.2 Disk Averages - Schmidt Law and Tully-Fisher Relation
We also test equation (18) by examining the disk averaged properties of galaxies and starbursts. We note, however, that such tests, while good consistency checks, do not discriminate well between the different theories of how star formation is triggered. We take the area-weighted mean of equation (18) over the whole region of a disk, where and is constant, to obtain
| (21) |
Current observations do not have the spatial resolution to estimate , except for the nearest galaxies. However, K98 presents data revealing a correlation between and , where is the angular rotation frequency at the outer radius, , of the star forming region (figure 2). Since we are considering the flat rotation curve case, we rewrite equation (21) as
| (22) |
For (equation 11) we obtain
| (23) |
where , being the inner radius where the rotation curve is flat. If is uncorrelated with and , then we predict K98’s observed correlation.
Applying equation (23) to the inner 8.5 kpc of the Milky Way, assuming and (see §2.3.3), gives
| (24) |
This is consistent with estimates based on observations of thermal radio emission from HII regions, which give (Güsten & Mezger 1982; McKee 1989). Scaling to a typical starbursting circumnuclear disk, with , and , gives . One of the most uncertain factors in these estimates is . Numerical studies, (Klein, private communication), although not yet incorporating magnetic fields, can constrain this number.
We also predict the form of the B band Tully-Fisher relation, . Assuming we have
| (25) |
where we have evaluated using equation (11) assuming . This result compares favorably with the observed B band exponent of (Burstein et al 1995; Strauss & Willick 1995). The Tully-Fisher relation at longer wavelengths becomes more and more contaminated by light from older stellar populations.
2.3.3 Cloud Star Formation Efficiency
Collision induced star formation predicts a variation in the star formation efficiency, , of GMCs, dependent on their mass. Variations in , resulting from this and other mechanisms, have been considered by a number of authors (e.g. Elmegreen & Clemens 1985; Scoville et al (1986); Pandey, Paliwal & Mahra 1990; Franco, Shore & Tenorio-Tagle 1994; Ikuta & Sofue 1997; Williams & McKee 1997).
Scoville et al (1986) found the ratios of Lyman-continuum luminosity to and number of high luminosity HII regions to , decreased with increasing . They argued this was evidence for collision induced star formation, since, if the collision rate scaled as the cloud surface area (), then the efficiency of star formation per unit cloud mass, , would scale as . However, if a more appropriate mass-size relationship (; Larson 1981) is applied with their reasoning, then no scaling of with is predicted.
Ikuta & Sofue (1997) considered the (radio) luminosity of HII region, rather than simply the number, associated ( pc away in the plane of the sky) with molecular clouds. They found . However, they did not allow for higher mass clouds being larger than smaller ones. The centers of large clouds may be much further than 10 pc away from HII regions associated with their periphery. There is also no comment on the completeness of the data. In particular the HII region sample, being flux limited at , is incomplete below luminosities of for sources in the inner Galaxy333A luminosity of , where is the ionizing luminosity () in units of . For example, Orion A has and . Note, by definition an object with a radio flux of 1 Jy at a distance of 1 kpc has a luminosity of , i.e. there is no factor of ..
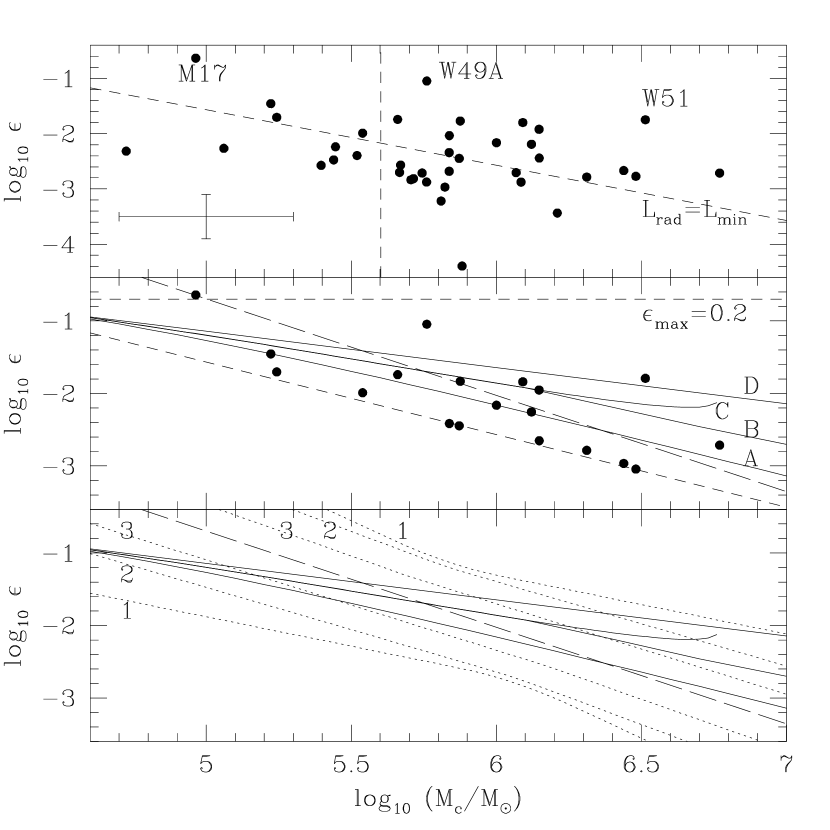
We now revisit the question of how the efficiency, , of star formation depends on cloud mass. Observationally, we measure by summing the radio luminosity, , of HII regions associated with a cloud. This luminosity is converted into a stellar mass using (McKee & Williams 1997). Dividing by then gives . We use the HII region data of Downes et al (1980) and the molecular cloud data of Solomon et al (1987). For each of the 106 HII regions, with resolved distance ambiguity, in the same region as the cloud survey, molecular clouds within pc (i.e. 2 ) on the sky, within the correct radial distance bounds and with relative velocities of are identified. The HII region is associated with the closest cloud, if more than one is identified. With these criteria, 83 HII regions are associated with 39 clouds. This data is shown in figure 3a, with the typical errors shown by the cross.
However, there are also two issues of completeness for the sample. Firstly, as already mentioned, the HII data are incomplete for . We adopt the more conservative limit of , which is shown by the diagonal dashed line in figure 3a. The data below this line are incomplete. Secondly, the molecular cloud data are incomplete for (Williams & McKee 1997). This is shown by the vertical dashed line. Assuming, for a particular , the probability of detection of a cloud is uncorrelated with , we ignore the effect of cloud incompleteness in the following analysis. The total for each cloud is recalculated, now only summing individual HII regions with . This data is shown in figure 3b. The best fit straight line is shown by the long dashed line.
We now compare these observations to theory. We model a cloud of mass , with HII regions, as resulting from a binary collision of two smaller clouds of mass and , with and . The assumption of binary collisions is justified by the paucity of high mass star formation in the total cloud population. Given our lack of understanding of the detailed results of cloud collisions, the assumption that several HII regions, rather than just one, may result from a single collision event is reasonable. (and ) are chosen from the mass spectrum of clouds: , with . Following our original hypothesis applied to equal mass clouds, that, on average, in a collision a constant fraction, , of the total cloud mass forms stars, we assume for unequal mass collisions, the mass of stars formed is . Thus , and the maximum star formation efficiency, , is statistically, achieved for collisions of equal mass clouds (), and is thus independent of . From the data in figure 3b, we set . The observationally determined minimum luminosity, above which the HII region sample is complete, defines a minimum value, , for . Thus . These two constraints meet when , and thus the star formation efficiency data for a complete sample of HII regions associated with clouds will be contained within a triangular region in a diagram of vs. (figure 3b).
The typical value of , , is an average of weighted by the collision rate. This scales with via
| (26) |
in the region where , since from equation (13), we have
| (27) |
and since is approximately independent of , and . Thus and so
| (28) |
Performing an averaging of the distribution of (and thus ) given by equation 26, in logarithmic space, leads to line A in figure 3b.
We also consider three other theoretical models for comparison. Models B and C (stochastic star formation, Williams & McKee 1997) assume a cloud’s star formation rate is linearly proportional to its mass, provided is not exceeded. Model B imposes a mass dependence, at high masses, on by assuming there is a physical limit to the maximum luminosity of OB associations. Model C assumes independent of , and the reason for the observed maximum association luminosity is simply due to sparse sampling of the distribution. By normalizing to the observed Galactic OB association luminosity and molecular cloud mass functions, a probability distribution of association luminosities expected in a cloud of mass , approximately proportional to is predicted. After summing the expected number of associations in a cloud, and then averaging the resulting distribution of at each in logarithmic space, we obtain lines B and C. Finally we consider an unphysical model (D) with a uniform distribution of for clouds of a particular mass.
The four model predictions are shown in figures 3b and 3c. In the latter, we also show the 95% confidence limits444Based on assumption of normal distribution of data about best fit line. The limits on acceptable slopes of fits are shown by the asymptotic limit of these confidence limits. Fits with more extreme slopes but still within the boundaries are also excluded. on the linear best fit from the existing sample (1), a hypothetical sample ten times larger with the same distribution (2), and as for (2) but with individual measurement errors reduced by a factor of two (3). From the existing data, model D is marginally excluded (because of its slope), while A,B,C are all consistent. Although the confidence limits on fitting a non-linear function will differ in detail, figure 3c qualitatively shows that with ten times more data and with modest improvements in measurement accuracy, we can hope to discriminate between these models. Such a sample can be achieved by a survey of radio HII regions in the entire inner Galaxy to fluxes of order . Improving completeness of CO observations of smaller mass GMCs will also improve the statistics. Uncertainties in result from the assumption of virialization and the CO/ ratio. Errors in result in part from distance uncertainties. Direct infra red observations of massive stars may improve estimates of association luminosities.
As a final point of caution, we note that evolutionary effects will cause a cloud’s measured to change. At the onset of star formation will be small, while will increase as the cloud is destroyed by energy injection from its high mass stars. Large enough samples are required to average over this effect.
In summary, collision induced star formation predicts a decrease in the mean cloud star formation efficiency of a complete sample with increasing cloud mass. The decrease occurs since it is much more likely for a large cloud to suffer a collision with a smaller one, because of the cloud mass spectrum. It is the smaller cloud which then determines the amount of resultant star formation. An observational lower limit to HII region luminosities, included in the analysis, implies a constant minimum mass of the smaller cloud, which drives the mass dependence of . Stochastic models predict a similar, but less steep, decline due to the shape of the complete region in the versus parameter space. For stochastic models, at high cloud masses, if is independent of 555A new physical regime may be reached at very high cloud masses in the extreme conditions of circumnuclear starbursting disks, when the ionized gas is no longer able to escape from the cloud. This will have a profound effect on the efficiency of star formation. The analysis of this section can thus only be applied to clouds in “normal” galactic environments., the efficiencies tend towards a constant value. Improved data samples should allow for discrimination between the models.
2.4 Effects of Spiral Density Waves
The theory for collision induced star formation requires modification where there is a tight spatial correlation of star formation with spiral structure. Spiral density waves decrease the local value of , and often in the arm region and in the inter-arm region (e.g. Kuno et al 1995). Two scenarios are possible. In the first, the rate limiting step is the formation of bound clouds, occurring exclusively in the arms, after which the clouds form stars at a fast rate (e.g. via gravitational collapse of magnetically supercritical clouds or through rapid collisions) and all the bound gas is involved in star formation. Equation (6) is then a better description of the galactic SFR. In the second scenario, bound cloud formation is fast and is not the rate limiting step. A reservoir of bound gas clouds exists in the galaxy, including in the inter-arm regions. Spiral arms now act to concentrate the spatial distribution of gas clouds, and the collision rate is enhanced in the arms. The individual collision rate for a particular cloud is still described by equation (13), but the overall SFR is modulated by the length of time the gas clouds spend in the arm region (related to and the width and pitch angle of the arm) and the degree of spatial concentration of clouds in the arm (related to the strength of the spiral density wave).
In M51, which has strong, well-defined spiral arms, there is evidence that the cloud collision times in the arm are short compared to the arm crossing time (Kuno et al 1995), thus favoring the first scenario. However, the similarity of the global star forming properties of galaxies with and without large scale density waves argues against bound cloud formation being controlled exclusively by spiral arms. Deciding which scenario is the correct description, or if both processes operate at some level, requires study of the arm to inter-arm gas distributions and cloud collision timescales in larger samples of galaxies, which exhibit a tight correlation of star formation with spiral arms. Obviously, neither scenario can explain the star formation observed in the galaxies without strong spiral structure.
2.5 Application to Circumnuclear Disks of Starbursts
The and data of the circumnuclear disks of starbursts make up most of the dynamic range for K98’s Schmidt law relationships (figures 1 and 2). However, much less is known about the details of star formation occurring in these regions than in the outer regions of galactic disks.
Downes & Solomon (1998, DS98) present observations and models of 10 circumnuclear disks. Their key findings, relevant to the theory of collision induced star formation are the following: most of the circumnuclear disks are in the flat rotation curve regime666This includes most of the gas mass. Although the data are limited, most of the star formation as traced by the “extreme starburst events” (DS98, table 12) is also in this regime. The mean rotation curve turn over radius is 220 pc, the mean half CO intensity radius is 630 pc and the mean outer disk boundary (used in the disk average analysis of K98) is 1.7 kpc.; ; the disks are thin and modeled without need to invoke large-scale non-axisymmetric features, such as bars or spiral arms; much of the star formation is associated with very large bound gas clouds with maximum masses and sizes ( pc) consistent with their confinement by tidal shear forces. Thus our principal assumptions are met.
The gas disks are predominantly molecular, including the inter-cloud medium, with the gas mass approximately of the dynamical mass. Note, larger gas masses (by a factor of ) are derived if the standard CO/H2 conversion factor for virialized GMCs in normal galaxies is used (as in the analysis of K98). In fact, much of the CO luminosity of the circumnuclear disks comes from the non-virialized molecular inter-cloud medium.
Since and not , the gas is probably not collapsing on the free-fall timescale ( yrs). This is consistent with Downes & Solomon’s estimate that about half the gas is converted into stars over 10 orbital periods ( yrs). This efficiency per orbital period is similar to that of normal galactic disks (K98), motivating a unified theory to describe both regimes. The collision time for a typical cloud mass, which we take to be of order , is a few million years.
The one inconsistency between our theory and the results of DS98, is their estimate that only % of the gas mass is in bound clouds. They base this estimate on observations of HCN which requires densities for excitation. However, the fact that implies that any overdense region on the critical scales will become gravitationally bound. A large fraction of the gas may be at densities less than that required for strong HCN emission, and yet still in bound clouds.
Circumnuclear starburst disks and the star forming regions of normal galactic disks may represent the extremes of a continuous family of states. Our theory of collision induced star formation can be applied in both situations. As one moves inwards from the outer disk, the gas surface densities and the molecular fractions of the bound clouds increase, but self-regulation of star formation maintains . The typical cloud mass, also appears to increase. If this is set by the magnetic critical mass, , of the inter-cloud medium then, from equation (5), must increase as decreases. The typical cloud mass may also be affected by changes in the collision time. This is much shorter ( yrs) in circumnuclear disks than in the typical star-forming locations of normal disks ( yrs), particularly in comparison to the stellar evolutionary and cloud destruction timescales. This may increase in circumnuclear disks to be several times .
3 Conclusions
We have invoked star formation triggered by cloud-cloud collisions to explain global star formation rates in disk galaxies and circumnuclear starbursts. Previous theories based on the growth rate of gravitational perturbations ignore the dynamically important presence of magnetic fields. Theories based on triggering by spiral density waves fail to explain star formation in systems without such waves. Furthermore, observations suggest gas and stellar disk instabilities are decoupled.
Star formation resulting from cloud collisions has been proposed in the past (e.g. Scoville et al 1986), but rejected because of supposedly long collision timescales. However, Gammie et al (1991) show the collision rate of self-gravitating particles in a differentially rotating disk is much larger than that of particles in a box. Collision rates are enhanced because particles collide at the shear velocity of encounters with initial impact parameters of order two tidal radii (typically a few hundred parsecs for GMCs). Gravitational focusing further increases the cross-section. Also, the small scale height of GMCs implies essentially two dimensional interactions in the plane of the disk, increasing the collision rate relative to that for three dimensions. We calculate collision timescales short enough to allow a viable theory of collision induced star formation to be considered.
In summary, in this model, self-gravitating gas disks fragment into bound gas clouds. This process is driven either by gravitational, thermal or Parker instabilities, or the influence of stellar spiral density waves on the gas. These bound clouds, either atomic or molecular, are relatively long-lived, being supported by static and turbulent magnetic pressure. The latter may be produced by dynamically-regulated low mass star formation (McKee 1999). We hypothesize a fraction of cloud collisions lead to compression of localized regions of the clouds. These regions, if magnetically supercritical, collapse rapidly to form stars, including high mass OB stars. The bulk of Galactic disk stars are thought to form via this “burst”-mode (Lada et al 1993). Thus, the rate limiting step for star formation is not the formation of bound clouds, but the compression of these, or parts of these, in cloud-cloud collisions. Therefore at any particular time, most of the bound gas is not actively undergoing star formation.
Specifically, we have considered an idealized, single mass population of gravitationally bound gas clouds, orbiting in an axisymmetric, thin disk. Using the result of Gammie et al (1991) for the cloud velocity dispersion, we predict radial gas distributions, dependent on the Toomre stability parameter (equation 11). Applying our principal hypothesis, that cloud collisions trigger the majority of disk star formation, using the collision cross-section results of Gammie et al (1991) and with the assumption star formation self-regulates (), we predict enhanced cloud collision rates and a SFR law of the form (equation 18). For flat rotation curves (), this result is in agreement with the disk averaged data of K98 (figure 2). Although uncertain, our estimates of the total SFR in the Milky Way and for typical starburst systems are consistent with observations. We predict a B-band Tully-Fisher relation of the form , in agreement with observations (Burstein et al 1995; Strauss & Willick 1995).
This theory is to be further scrutinized to discriminate between it and other star formation mechanisms. To this end we have proposed several tests. We predict statistically enhanced SFRs in regions of large negative circular velocity gradients, where the shear rate is increased, and regions of increased cloud velocity dispersion. Similarly, decrements are predicted in regions of large positive circular velocity gradients, which reduce the amount of shear. Future observations (e.g. Martin & Kennicutt 2000) of SFR, gas and circular velocity profiles of large samples of disk galaxies should allow for statistically significant tests of our proposed SFR law, and in particular the dependence on the circular velocity gradients and cloud velocity dispersion. However, these tests will be complicated by possible variations in the likelihood of collision induced star formation with collision velocity. The results of numerical simulations may be necessary to account for this effect. We also predict star formation efficiency, , linearly averaged, decreases with increasing cloud mass as . Figure 3 shows model predictions for , logarithmically averaged over its distribution, and comparison to observations. Larger and deeper surveys of HII regions and GMCs, including their atomic components, are required to improve the significance of this test.
Undoubtedly our model is an extremely simplified description of the actual star formation process. We have presented an idealized theory in which all star formation is triggered by cloud collisions, however other processes, such as spontaneous star formation, self-triggering and triggering by density waves undoubtedly operate at some level. For the results of the collision induced theory to be valid, we require that the majority of (high mass) star formation is initially triggered by this process. The basic theory needs modification where there is a tight correlation of star formation with large scale density waves, allowing for the duration clouds spend in the density wave, and the degree of spatial concentration.
The theory can be improved by numerical calculation of collision rates in a many body system, rather than relying on simple two body interaction rates. Numerical simulation of cloud collisions (e.g. Klein & Woods 1998) may provide insight into the details of how a magnetically supercritical region can be produced from the collision of two magnetically subcritical clouds. The parameter space for the outcome of collisions with different initial conditions is also being probed by simulation (Klein, private communication). These simulations will constrain the probability, , for star formation to result from typical cloud-cloud collisions.
This theory can be applied to analytic models (e.g. Shore & Ferrini 1995; Silk 2000) and simulations (e.g. Curir & Mazzei 1998; Weil, Eke & Efstathiou 1998) of disk galaxy formation and evolution, for comparison to cosmological SFR data.
References
- (1) Bertoldi, F., & McKee, C.F. 1992, ApJ, 395, 140
- (2) Binney, J., Gerhard, O.E., Stark, A.A., Bally, J., & Uchida, K.I. 1991, MNRAS, 252, 210
- (3) Blitz, L. 1990, The Evolution of the Interstellar Medium, ed. Blitz L., ASP Press: San Francisco, 273
- (4) Blitz, L., & Williams, J.P. 1999, Conf. Proc.: The Physics of Star Formation and Early Stellar Evolution (Crete II), astro-ph/9903382
- (5) Block, D.L., Bertin, G., Stockton, A. et al 1994, A&A, 288, 365
- (6) Burkert, A. & Lin, D.N.C. 1999, submitted to ApJ
- (7) Clemens, D.P. 1985, ApJ, 295, 422
- (8) Curir, A., & Mazzei, P. 1998, New Astr., 4, 1
- (9) Das, M., & Jog, C.J. 1996, ApJ, 462, 309
- (10) Downes, D., Wilson T.L., Bieging, J. & Wink, J. 1980, A&AS, 40, 379
- (11) Downes, D., & Solomon, P.M. 1998, ApJ, 507, 615
- (12) Elmegreen, B.G. 1985, in Protostars & Planets II, eds, Black, D., & Matthews, M., University of Arizona Press, Tucson, 33
- (13) Elmegreen, B.G. 1989, ApJ, 338, 178
- (14) Elmegreen, B.G. 1991, ApJ, 378, 139
- (15) Elmegreen, B.G. 1993, ApJ, 411, 170
- (16) Elmegreen, B.G. 1994, ApJ, 425, L73
- (17) Elmegreen, B.G. & Clemens, C. 1985, ApJ, 294, 523
- (18) Elmegreen, B.G., & Lada, C.J. 1977, ApJ, 214, 725
- (19) Elmegreen, D.M., & Elmegreen, B.G. 1986, ApJ, 311, 554
- (20) Field, G.B., & Saslaw, W.C. 1965, ApJ, 142, 568
- (21) Franco, J., Shore, S.N., & Tenorio-Tagle, G., ApJ, 436, 795
- (22) Gammie, C.F. 1996, ApJ, 462, 725
- (23) Gammie, C.F., Ostriker, J.P., & Jog, C.J. 1991, ApJ, 378, 565
- (24) Greaves, J.S., & White, G.J. 1991, A&A, 248, L27
- (25) Grosbol, P.J., & Patsis, P.A. 1998, A&A, 336, 840
- (26) Güsten, R., & Mezger, P.G. 1982, Vistas Astr., 26, 159
- (27) Hasegawa, T., Sato, F., Whiteoak, J.B., & Miyawaki, R. 1994, ApJ, 429, L77
- (28) Heiles, C., Goodman, A.A., McKee, C.F., & Zweibel, E.G. 1993 in Protostars and Planets III, eds, Levy, E.H., & Lunine, J.I., University of Arizona Press, Tucson, 279
- (29) Ho, L.C., Filippenko, A.V., & Sargent, W.L.W. 1997, ApJ, 487, 591
- (30) Ikuta, C. & Sofue, Y. 1997, PASJ, 49, 323
- (31) Jog, C.J. & Solomon, P.M. 1984, ApJ, 276, 114
- (32) Jog, C.J. 1996, MNRAS, 278, 209
- (33) Kenney, J. 1997, IAU symp., 184
- (34) Kennicutt, R.C. 1989, ApJ, 344, 685
- (35) Kennicutt, R.C. 1998, ApJ, 498, 541
- (36) Klein, R.I., & Woods, D.T. 1998, ApJ, 497, 777
- (37) Knapp, G.R., Stark, A.A., & Wilson, R.W. 1985, AJ, 90, 254
- (38) Kuno, N., Nakai, N., Handa, T., & Sofue, Y. 1995, PASJ, 47, 745
- (39) Kuno, N., Tosaki, T., Nakai, N., & Nishiyama, K. 1997, PASJ, 49, 275
- (40) Kwan, J., & Valdes, F. 1987, ApJ, 315, 92
- (41) Lada, E.A., Strom, K.M. & Myers, P.C. in Protostars and Planets III, eds, Levy, E.H., & Lunine, J.I., University of Arizona Press, Tucson, 245
- (42) Larson, R.B. 1981, MNRAS, 194, 809
- (43) Larson, R.B. 1988, in Galactic and Extragalactic Star Formation, ed. R.E. Pudritz & M. Fich, Dordrecht: Kluwer, 435
- (44) Larson, R.B. 1992, in Star Formation in Stellar Systems, ed. G. Tenorio-Tagle, M. Prieto, & F. Sanchez, Cambridge: Cambridge Univ. Press, 125
- (45) Lattanzio, J.C., Monaghan, J.J., Pongracic, H., & Schwarz, M.P. 1985, MNRAS, 215, 125
- (46) Liszt, H.S., & Burton, W.B. 1996, in Unsolved Problems of the Milky Way, eds. Blitz, L., & Teuben, P., Kluwer: Dordrecht
- (47) Martin, C.L., & Kennicutt, R.C. 2000, in preparation
- (48) McCall, M.L., & Schmidt, F.H. 1986, ApJ, 311, 548
- (49) McKee, C.F. 1999, Conf. Proc.: The Physics of Star Formation and Early Stellar Evolution (Crete II), astro-ph/9901370
- (50) McKee. C.F., & Williams, J.P. 1997, ApJ, 476, 144
- (51) Mestel, L. 1985, in Protostars & Planets II, eds, Black, D., & Matthews, M., University of Arizona Press, Tucson, 320
- (52) Moriarty-Schieven, G.H., Andersson, B.-G., & Wannier, P.G. 1997, ApJ, 475, 642
- (53) Myers, P.C., & Goodman, A.A. 1991, ApJ, 373, 509
- (54) Oort, J.H. 1954, Bull. Astron. Inst. Netherlands, 12, 177
- (55) Pandey, A.K., Paliwal, D.C., & Mahra, H.S. 1990, ApJ, 362, 165
- (56) Quirk, W.J. 1972, ApJ, 176, L9
- (57) Sakamoto, K. 1996, ApJ, 471, 173
- (58) Sanders, D.B., Clemens, D.P., Scoville, N.Z., & Solomon, P.M. 1986, ApJS, 60, 1
- (59) Schmidt, M. 1959, ApJ, 129, 243
- (60) Scoville, N.Z., Sanders, D.B., & Clemens, D.P. 1986, ApJ, 310, L77
- (61) Scoville, N.Z., Yun, M.S., Clemens, D.P., Sanders, D.B., & Waller, W.H. 1987, ApJS, 63, 821
- (62) Seiden, P.E., & Schulman, L.S. 1990, Adv. Phys., 39, 1
- (63) Shore, S.N., & Ferrini, F. 1995, Fund. Cosm. Phys., 16, 1
- (64) Silk, J. 1997, ApJ, 481, 703
- (65) Silk, J. 2000, MNRAS, submitted
- (66) Solomon, P.M., Rivolo, A.R., Barrett, J., Yahil, A. 1987, ApJ, 319, 730
- (67) Spitzer, L. 1978, Physical Processes in the Interstellar Medium, Wiley: New York
- (68) Stark, A.A, & Brand, J. 1989, ApJ, 339, 763
- (69) Taniguchi, Y., & Ohyama, Y. 1998, ApJ, 509, L89
- (70) Thornley, M.D., & Mundy, L.G. 1997a, ApJ, 484, 202
- (71) Thornley, M.D., & Mundy, L.G. 1997b, ApJ, 490, 682
- (72) Toomre, A. 1964, ApJ, 139, 1217
- (73) Truelove, J.K., Klein, R.I., McKee, C.F., Holliman, J.H., Howell, L.H., & Greenough, J.A. 1997, ApJ, 489, L179
- (74) Ungerechts, H., & Thaddeus, P. 1987, ApJS, 63, 645
- (75) Wada, K., & Norman, C. 1999, ApJ, 516, L13
- (76) Wang, B., & Silk, J. 1994, ApJ, 427, 759
- (77) Weil, M.L., Eke, V.R., & Efstathiou, G. 1998, MNRAS, 300, 773
- (78) Williams, J.P., & Maddalena, R.J. 1996, ApJ, 464, 247
- (79) Williams, J.P., & McKee, C.F. 1997, ApJ, 476, 166
- (80) Wiseman, J., & Ho, P.T.P. 1994, in ASP Conf. Ser. 65, Clouds, Cores and Low Mass Stars, ed. D.P. Clemens & R. Barvainis, San Francisco: ASP, 396
- (81) Wiseman, J., & Ho, P.T.P. 1996, Nature, 382, 139
- (82) Womack, M., Ziurys, L.M., & Sage, L.J. 1993, ApJ, 406, L29
- (83) Wyse, R.F.G. 1986, ApJ, 311, L41
- (84) Wyse, R.F.G., & Silk, J. 1989, ApJ, 339, 700
- (85)


| Property | Formula or Source | Galactic disk | Circumnuclear disk |
|---|---|---|---|
| obs./magnetic critical mass | aaDS98 are only able to resolve a few of the largest bound clumps, of mass , in the circumnuclear disks. By analogy with GMCs in normal disks, we take the typical mass to be an order of magnitude less than this maximum. | ||
| observation | bbThis is the mean value of , the inner disk half intensity (of CO flux) radius, from the sample of DS98. | ||
| observation | |||
| observation | ccWe take this fiducial value for consistency with the clouds modeled by Gammie et al (1991). Real clouds of this mass will probably be somewhat more extended, particularly allowing for HI envelopes. | ddIn circumnuclear disks is uncertain. For the calculations which require a definite value, we take pc | |
| Alfven velocity | uncertain | ||
| Process | Formula or Reference | Time (years) | Time (years) |
|---|---|---|---|
| Galactic disk | Circumnuclear disk | ||
| Orbital Period, | |||
| Free-fall, | |||
| Atomic to Molecular, | |||
| Ambipolar diffusionaaNote that the estimate of is based on ionization solely from cosmic rays (see McKee 1999, Eq. 2 & 89). The inhomogeneous nature of interstellar gas clouds means that UV radiation is much more penetrating than in the homogeneous case and that most of the gas mass of clouds is probably at a higher level of ionization and hence subject to longer ambipolar diffusion timescales than the above estimate., | |||
| CollisionbbThis collision timescale is sensitive to the approximation of a cloud population with single cloud mass, . The time between collisions which cause star formation is ., | |||
| Destruction, | Williams & McKee (1997) | uncertain | |
| LifetimeccThis is the lifetime of a gravitationally bound cloud, not explicitly a molecular cloud. Upper limits of years (e.g. Blitz & Williams 1999) are quoted for GMC lifetimes. However, bound clouds, ignoring the atomic/molecular distinction, may live much longer., | |||
| Alfven Crossing, | uncertain | ||
| Impact time, |