The origin and formation of cuspy density profiles through violent relaxation of stellar systems
Abstract
It is shown that the cuspy density distributions observed in the cores of elliptical galaxies can be realized by dissipationless gravitational collapse. The initial models consist of power-law density spheres such as with anisotropic velocity dispersions. Collapse simulations are carried out by integrating the collisionless Boltzmann equation directly, on the assumption of spherical symmetry. From the results obtained, the extent of constant density cores, formed through violent relaxation, decreases as the velocity anisotropy increases radially, and practically disappears for extremely radially anisotropic models. As a result, the relaxed density distributions become more cuspy with increasing radial velocity anisotropy. It is thus concluded that the velocity anisotropy could be a key ingredient for the formation of density cusps in a dissipationless collapse picture. The velocity dispersions increase with radius in the cores according to the nearly power-law density distributions. The power-law index, , of the density profiles, defined as , changes from at intermediate radii, to a shallower power than toward the centre. This density bend can be explained from our postulated local phase-space constraint that the phase-space density accessible to the relaxed state is determined at each radius by the maximum phase-space density of the initial state.
keywords:
galaxies: formation – galaxies: kinematics and dynamics – galaxies: structure – methods: numerical.1 Introduction
Recent Hubble Space Telescope observations (Crane et al. 1993; Ferrarese et al. 1994; Jaffe et al. 1994; Lauer et al. 1995; Byun et al. 1996; Gebhardt et al. 1996; Faber et al. 1997) have revealed that elliptical galaxies do not have constant density cores but have cusps which continue toward the centre until the resolution limit. In addition, it has been found that the density profiles of the cores are divided into two types: one is a shallow cuspy core represented by with for bright elliptical galaxies, and the other is a steep cuspy core described by approximately for faint ones (Merritt & Fridman 1996). Several cosmological simulations, based on a standard cold dark matter scenario, have demonstrated that cuspy density profiles with might be a natural end-product of hierarchical clustering (Dubinski & Carlberg 1991; Navarro, Frenk & White 1996, 1997). Recently, Fukushige & Makino (1997) have pointed out from their high resolution simulation with about particles that the resulting central density profiles of dark matter haloes are steeper than in a hierarchical clustering scenario, and that merging processes among clumps with different binding energies would play a significant role in the formation of such steep density cusps. Moore et al. (1998) have also demonstrated that very high resolution simulations with nearly particles yield steep inner density profiles with (see however Kravtsov et al. 1998). On the other hand, shallower density cusps could be formed through merging between galaxies which individually have a massive central black hole, as shown by Makino & Ebisuzaki (1996). For this kind of merging, Nakano & Makino (1999) have explained why a galaxy that has swallowed a massive black hole leaves a shallow cusp in the centre. However, the physical mechanism to generate steep cusps still remains unsolved.
From the simulations mentioned above, we might conclude that clumps are needed to produce steep cusps while merging between galaxies with massive central black holes is required to generate shallow cusps. However, it might be too early to abandon a simple dissipationless collapse picture, which includes neither clumpiness nor massive central black holes, for the formation of cusps. We know that the collapse of uniform-density spheres results in large constant density cores (van Albada 1982; Fujiwara 1983), while little is known about the details of the collapse of power-law density spheres. Of course, there are cases for the collapse of non-uniform density spheres. For example, Hozumi, Fujiwara & Kan-ya (1996) have carried out collapse simulations of power-law density spheres only in the initial contraction phases in order to demonstrate the predominance of the growth of the tangential velocity dispersion over that of the radial velocity dispersion until the most contracting phase. In addition, Londrillo, Messina & Stiavelli (1991) examined the collapse of generalized Plummer models; their models have large cores, and steep density haloes with or , so that the collapse behaviour over most parts of the system is considered similar to that of a uniform-density sphere. Burkert (1990) paid attention to degenerate cores arising from the dissipationless collapse of spherical stellar systems with different initial density gradients and virial ratios. In another instance, Cannizzo & Hollister (1992) studied the relation between the power-law index of initial density distributions and the final axis ratios of the systems. However, the structures at sufficiently small radii where the density cusps are observed in real galaxies were not a main concern in these examples.
Although many dissipationless collapse simulations have been carried out so far, there has been no sufficiently high resolution to determine fine structures at very small radii, such as density cusps. In addition, the systems in numerical studies were assumed to have isotropic velocity distributions at the beginning. That is, the initial models for dissipationless collapse simulations have never included anisotropic velocity distributions, despite the fact that stellar systems can support velocity anisotropy unlike gaseous systems.
In this paper, we examine the influence of initial velocity anisotropy on the relaxed density profiles in the core, assigning enough resolution to analyse the innermost region, and show that radially anisotropic models could produce different cuspy density profiles. In Section 2, we describe the initial models in which anisotropic velocity distributions are taken into account, and the numerical method. In Section 3, the results of collapse simulations are presented. In Section 4, we explain the resulting density profiles from a viewpoint that the maximum phase-space density accessible to the relaxed system is determined at each radius by that of the initial system. Conclusions are given in Section 5.
2 Models and Method
We carry out collapse simulations of power-law density spheres on the assumption of spherical symmetry. The initial virial ratios, , used are and , where is the kinetic energy, and is the potential energy. According to existing simulations (Polyachenko 1981, 1992; Merritt & Aguilar 1985; Min & Choi 1989; Aguilar & Merritt 1990; Londrillo et al. 1991; Cannizzo & Hollister 1992; Udry 1993) like those studied here, our models would be affected by the radial orbit instability if spherical symmetry were not assumed, because of the small initial virial ratios. However, Aguilar & Merritt (1990) have shown that the origin of the radial orbit instability is different from that of the universal density profile observed in elliptical galaxies, that is, the de Vaucouleurs law in projection (see also Burkert 1993). Therefore, we are allowed to assume spherical symmetry as long as we focus only on the spherically averaged density profiles and related physical quantities of collapsed objects.
The velocity anisotropy is introduced into the initial models by adopting the distribution function, , as
| (1) |
where is the density, is the radial velocity dispersion, and is the tangential velocity dispersion with , , and being the radius, radial velocity, and angular momentum, respectively. We begin with a moderate power-law density profile given by
| (2) |
where is the total mass and is the radius of the sphere. We measure the velocity anisotropy by , where and are the kinetic energies in radial and tangential motions, respectively. In our models, is equivalent to , as is found from equation (1). We take and 10 for each value of the virial ratios.
We use Fujiwara’s (1983) phase-space solver which integrates the collisionless Boltzmann equation directly, with the help of a splitting scheme (Cheng & Knorr 1976). Since this method leads to the results that are not subject to random fluctuations, we can obtain smooth density and velocity dispersion profiles. We employ , where , and are the numbers of mesh points along the radius, radial velocity, and angular momentum, respectively. A logarithmic grid is used in the radial direction. An equal interval grid is assigned to the radial velocity while a quadratic interval is adopted for the angular momentum. The units of mass, , and the gravitational constant, , are taken to be . The unit of length is determined from the relation such that . This choice of leads to approximately the same core sizes for uniform-density spheres with isotropic velocity distributions (Fujiwara 1983). As a characteristic time-scale for the collapse, we adopt the free-fall time, defined by . We obtain for and for in our system of units. The minimum and maximum radii assigned to grid points are set to be and , respectively, for , and and , respectively, for . Test simulations have shown that resulting density and velocity dispersion profiles at small radii do not depend on the replacement of by with more finely divided mesh points in the angular momentum.
Hozumi & Hernquist (1995) and Hozumi (1997) traced the orbits of stars on grid points backward to every suitable time step in order to avoid the numerical diffusion generated by the repeated interpolation required by the splitting scheme. However, we do not adopt this method in our simulations. This is because we are interested not in the details of the phase-space distributions but mainly in low-order moments of the distribution function such as density and velocity dispersion, in addition to saving computational time.
3 Results
We stopped the simulations at for and at for . These times correspond to about . They are, nevertheless, sufficiently long that the resulting cores have relaxed completely. Since our main concern is the core regions, these times satisfy our requirements for analysing the relaxed density and velocity dispersion profiles near those regions. There were practically no escapers for , while about 20 per cent of the total mass with positive energies expanded beyond and escaped for . Consequently, the total energy was conserved to better than 0.39 per cent for all the models with except for the model with in which the total energy within changed by 1.8 per cent owning to a small fraction of escapers. On the other hand, the total energy within changed by at worst 10.7 per cent for all the models with because of a large fraction of escapers.
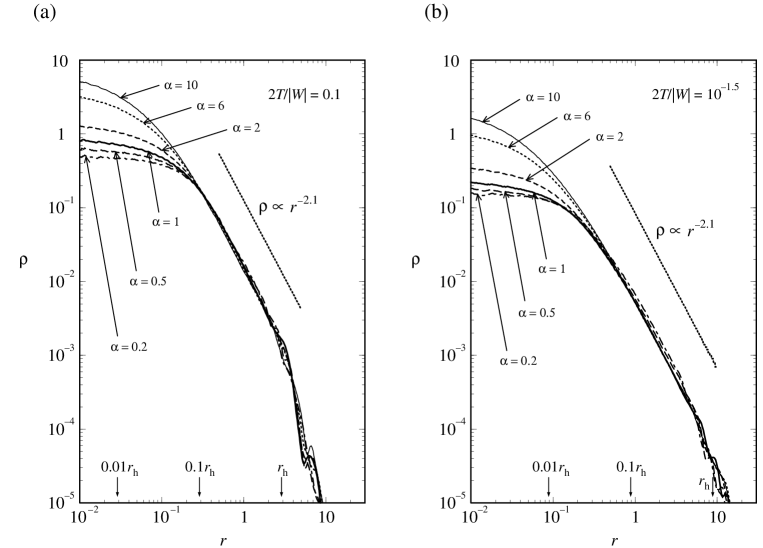
In Figs. 1a and 1b, we show the resulting density profiles for and , respectively. The half-mass radii, , for are about 2.6 to 3.2, while they are about 7.8 to 9.7 for . Thus, our adopted minimum radii correspond to for and for . If the half-mass radius is regarded practically as the effective radius, , of the de Vaucouleurs law, the minimum radii used are sufficiently small and correspond to roughly 10 pc, because is typically 3 kpc for bright ellipticals and is smaller for faint ones (Kormendy 1977). We point out that most galaxies are not well resolved inside to 10 pc according to the data cited in the paper of Gebhardt et al. (1996).
We can see from Fig. 1 that the density distributions at small radii become more cuspy as increases, and that their slope becomes steeper with increasing for both virial ratios. As a result, the core region, specified by a nearly constant density distribution, decreases with increasing . In particular, it is to be noticed that there is no constant density core for the most radially anisotropic models, that is, the models with . On the other hand, the density profiles at intermediate radii are well-approximated by , regardless of the virial ratios and the velocity anisotropy.
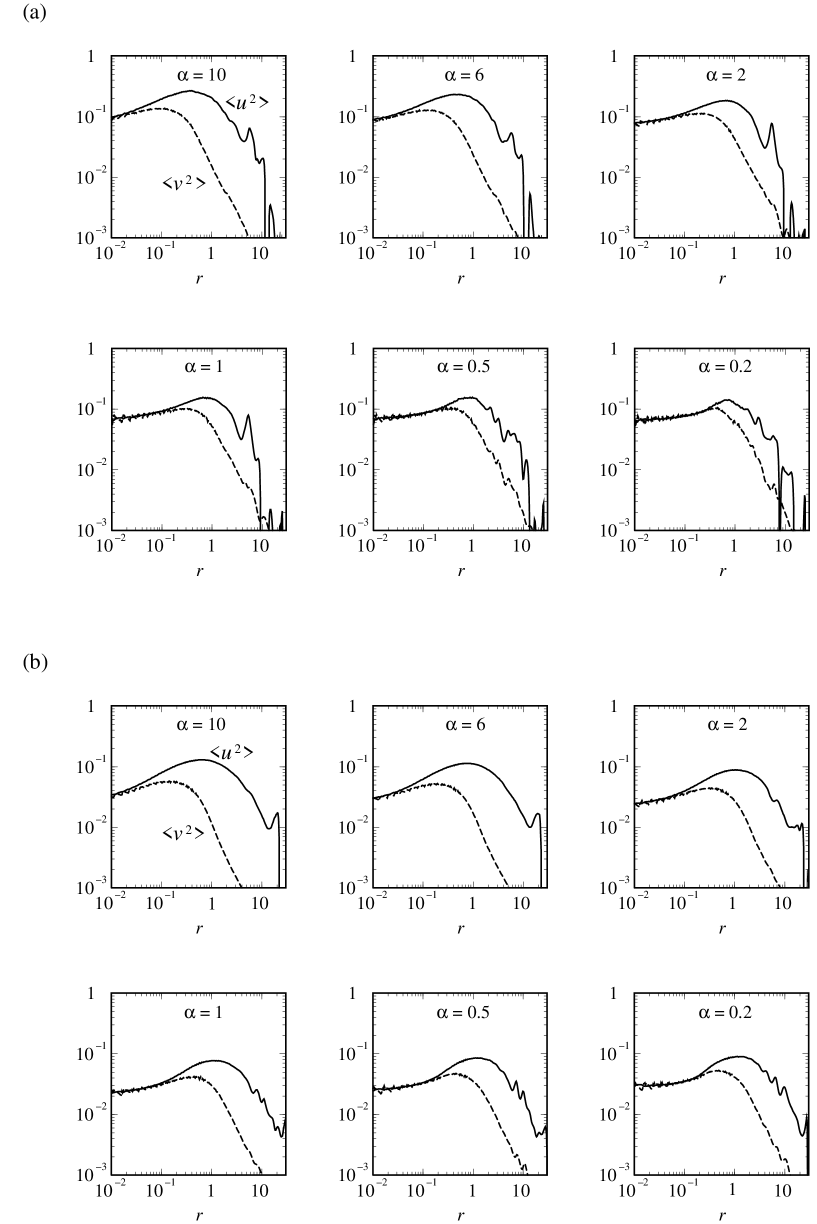
The relaxed velocity dispersion profiles for and are shown in Figs. 2a and 2b, respectively. These figures indicate that the relaxed velocity distributions no longer remain anisotropic in the inner region of the cores even though we begin with a model which has a large velocity anisotropy at all radii. Thus, it seems very difficult to produce and maintain velocity anisotropy in the cores only by gravitational collapse. The isotropic region that roughly corresponds to the core becomes smaller, as the velocity anisotropy increases. It is found from Figs. 2a and 2b that the density of the inner regions necessarily decreases with radius because the velocity dispersions rise with radius in the cores. In particular, for , the velocity dispersions in the cores increase almost linearly with radius in logarithmic scale. Then, the hydrostatic equation requires that the corresponding density profiles should follow a power-law distribution. In reality, as shown by Fig. 2, the imperfect linearity of the velocity dispersion against radius in logarithmic scale does not realize a perfect power-law density distribution.
4 Discussion
4.1 Phase-space constraint
Collisionless stellar systems suffer the constraint that the phase-space density accessible to the relaxed state is less than the maximum phase-space density of the initial state. On the basis of this phase-space constraint, we can explain the density bend which occurs around the edge of the cores.
As far as the core generated through violent relaxation is concerned, the phase-space density does not decrease substantially from the initial value at least for spherically symmetric systems (Fujiwara 1983; Hozumi 1997). Our adopted initial virial ratios are small enough to induce a radial orbit instability, unless spherical symmetry is imposed. Nevertheless, it may be unlikely that the phase-space density in the core suffers a substantial decrease after violent relaxation according to the results of May & van Albada (1984): they have shown that the phase-space density in the core is almost conserved after violent relaxation even for aspherical collapses, although they examined this behaviour only for initially homogeneous density distribution models. The effects of aspherical collapses through the radial orbit instability are left to be investigated as a future problem.
Here, admitting the non-decreasing nature of the phase-space density in the core, we postulate a local phase-space constraint that the maximum phase-space density in the relaxed system is determined by the initial conditions at each radius in the core regions for power-law density spheres. From equation (1), the local maximum phase-space density at the beginning, , is defined by
| (3) |
If the initial density distribution is given by a power law like , the local maximum phase-space density of the initial system is represented in terms of the anisotropic parameter, , and the virial ratio, , by
| (4) |
Notice that equation (4) holds even though depends on radius. The cumulative mass within is . For the special case where is independent of , we find the cumulative mass with phase-space density greater than by solving equation (4) with respect to ,
| (5) | |||||
This equation shows that is independent of , because we have determined from the relation such that . Thus, our discussion described below holds whatever value the virial ratio will be. From equation (5), we obtain the relation between and as
| (6) |
and
| (7) |
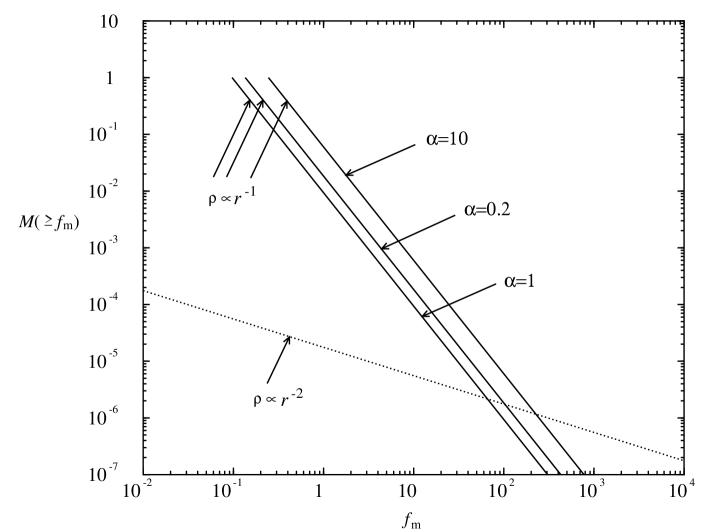
Since our initial models have , equation (6) predicts the relation . The resulting after violent relaxation cannot exceed of the initial system. As the relaxed density distributions show at intermediate radii, regardless of the values of , would hold approximately at such radii. As illustrated in Fig. 3, for large values of there unavoidably emerges a region in which for becomes larger than that for . Since large correspond to small as indicated by equation (4), we find from Fig. 3 that the density profile with cannot continue down to sufficiently small radii owning to the lack of phase-space density. Therefore, the density bend necessarily arises as long as the initial density distribution is shallower than .
As a piece of evidence that the local phase-space constraint is valid, we present in Fig. 4 the plots of phase particles on the radial mesh points at the final state for with , 1, and 10 in the plane. This figure reveals that phase particles with high phase-space density are not scattered in a wide range of radius. Thus, at least in the central region, mixing of high phase-space density particles with low phase-space ones does not occur efficiently through violent relaxation. If we pick out the maximum phase-space density at each radius from that distribution of the phase particles which is shown in Fig. 4, we can obtain, in a practical sense, the local maximum phase-space density, , in the relaxed state. Fig. 5 is depicted in such a way to show the relaxed against near the central region. We can see from this figure that the relaxed is well-approximated by at , although the slope of the model with is closer to rather than . The relation is naturally derived from equation (4) for the density profile which is in fact obtained at intermediate radii in our simulations, though it is precisely . Therefore, our explanation for the density bend based on Fig. 3 is justified qualitatively.
We now turn to the tendency that larger values of result in more cuspy density distributions. When we begin with , equation (6) indicates that is proportional to . This function has a minimum at . Hence, increases with increasing if . This means that for intersects with for with at a larger than that with (see Fig. 3). Thus, can continue down to smaller radii with increasing , provided that the relaxed density profiles at intermediate radii do not change greatly among the models with different values of , as is demonstrated by our simulations. In this way, we can understand that the large models produce nearly cuspy density profiles down to sufficiently small radii.
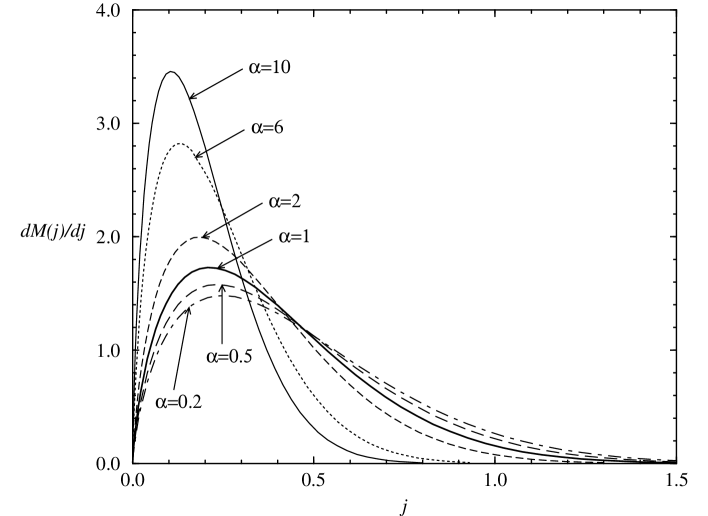
On the other hand, decreases with increasing if . Thus, if , smaller values of should also, in principle, lead to a density bend closer to the centre (see Fig. 3). In reality, this is not the case, as illustrated in Fig. 1. This can be understood from Fig. 6 which shows the fractional mass, , with the angular momentum, , for the initial models. These fractional mass distributions remain unchanged throughout the evolution because spherical symmetry is assumed. Fig. 6 shows that the mass of stars with small values of the angular momentum decreases as decreases for . If the profile could continue down to the very centre, and if most stars would be on circular orbits, would be equal to , where is the reference density at . The values of the imagined are 0.45 for and 0.26 for . For these values of , Fig. 6 indicates that the smaller models contain less stars with small . Since the stars with small values of the angular momentum can pass close to the centre, the deficiency of small stars means that the smaller models cannot populate a sufficient number of stars down to smaller radii. Therefore, the radius of the density bend moves outward as decreases if , even though there is sufficient phase-space density available. If spherical symmetry were not imposed, some degree of mixing in angular momentum could be expected (May & van Albada 1984), and so, might continue down to smaller radii as decreases when .
We can infer from Figs. 1 and 6 that the models with would not suffer the limitation, described above, on the central density distribution arising from the amount of small angular momentum stars. This is because we can explain the shift of the density bend toward smaller radii with increasing simply from the local phase-space constraint like that illustrated in Fig. 3.
We have found that the velocity anisotropy could be effective in the formation of cuspy density profiles. However, it is unclear how the system can acquire such a large radial anisotropic velocity dispersion. It may be difficult to realize a large velocity anisotropy in each stellar system before collapse. In a cosmological situation based on cold dark matter, clumps are first formed and then collapse to merge into a large system. Thus, a system consisting of clumps may have anisotropic velocity dispersions. Therefore, it will be important to study the velocity distribution just after such a system has decoupled from the Hubble flow.
4.2 Relation between initial and final density powers
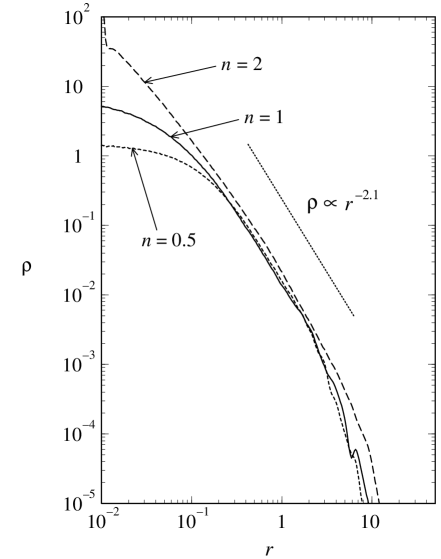
We have found that more radially anisotropic velocity distributions lead to more cuspy density profiles by gravitational collapse. Here, we examine how seriously the initial power index of density distributions influences the final one. We carry out collapse simulations of density distributions with =0.5, 1, and 2, again on the assumption of spherical symmetry using the collisionless Boltzmann code. The anisotropic parameter and virial ratio are chosen to be and , respectively. The other numerical parameters are the same as those used in Section 2. The final density profiles are shown in Fig. 7. The half-mass radii, , are about 2.3 to 3.2. We can see that the density distributions at intermediate radii are well-approximated by , and that initially steeper density distributions result in steeper cuspy density distributions, although the final power-law indices within the radius of the density bends become always shallower than the initial ones. In particular, the density power for the model with remains almost unchanged after the collapse, so that practically no density bend is found. This fact is in good agreement with the results of Burkert (1990), and proves the validity of the local phase-space constraint that we have postulated in the previous subsection, because the relaxed density distribution with can almost continue toward the very centre without the phase-space constraint if the initial density distribution is , as indicated by Fig. 3.
Taking into consideration our results obtained here, the steep cusps with observed in faint ellipticals could originate from the fluctuation spectrum that realizes density distributions with . According to observations, low-luminosity ellipticals that have the steep cusps are isotropic in the sense that they show , where is the ratio of the rotation parameter to the value for an isotropic oblate spheroid flattened by rotation, is the maximum rotation velocity, and is the mean velocity dispersion inside one-half of the effective radius (Kormendy & Bender 1996; Faber et al. 1997). In addition, these ellipticals are rapidly rotating. Unfortunately, we cannot discuss values for our end-products, because our models include no net rotation. Therefore, we will need to investigate the effects of rotation on the steep cusps using three-dimensional collapses in order to make a detailed comparison with observations.
The resulting power-law indices of the density distributions within the radius of the density bend correlate with those of the initial density distributions. The difference in power-law index of the cusps originates from a difference in that of initial density distributions. In cosmological simulations with high resolution, based on a standard cold dark matter scenario, the final density distributions show a rather steep density cusp, such as (Fukushige & Makino 1997; Moore et al. 1998). Probably, this kind of violent relaxation would not produce shallow cusps observed in bright ellipticals, so that we might require a merger between galaxies each of which contains a massive central black hole (Makino & Ebisuzaki 1996; Nakano & Makino 1999). However, if the circumstances for the formation of bright ellipticals are somehow very different from those of faint ellipticals, it is conceivable from our results that bright ellipticals could have been formed from the fluctuation spectrum that corresponds to with approximately.
5 Conclusions
Collapse simulations of power-law density spheres such as with anisotropic velocity distributions have been performed on the assumption of spherical symmetry. We have found that the resulting density profiles are well-approximated by at intermediate radii, regardless of the velocity anisotropy and the virial ratio. However, this universal density profile cannot continue down to sufficiently small radii, and so, the density bends necessarily. We have explained this density bend from the phase-space constraint that the phase-space density accessible to the relaxed system is determined at each radius by the maximum phase-space density of the initial system.
As the radial velocity anisotropy increases, the density profiles of the end-products after violent relaxation become more cuspy. In particular, the extremely radially anisotropic models with have practically no flat cores. Thus, our results imply that the velocity anisotropy could play a substantial role in the formation of the density cusps observed in elliptical galaxies as long as we rely on a simple dissipationless collapse picture. In reality, it will be difficult to produce a large velocity anisotropy in individual systems. Concerning this problem, however, we point out that a system composed of clumps, as can be envisaged in the standard cold dark matter scenario, might have a large velocity anisotropy when it has decoupled from the Hubble expansion. In addition, we have examined the relation between the initial and final power-law indices of the density profiles by performing collapse simulations for models with =0.5, 1, and 2. In these cases, the resulting density profiles at intermediate radii are also well-approximated by , regardless of the initial density power indices. The results show that initially steeper density profiles result in steeper cuspy density profiles. Therefore, the difference in the power index of the cusps between faint and bright elliptical galaxies might arise from the difference in the power index of initial density profiles. In particular, the steep cusps with observed in faint ellipticals could result from initial density distributions with , because such density distributions can avoid the local phase-space constraint.
As a by-product, we have also found that the resulting cores no longer show velocity anisotropy even though we start with a model which has a large velocity anisotropy at all radii. This implies that simple gravitational collapse could have difficulty in generating and maintaining velocity anisotropy in the cores.
Our results shown here are obtained on the assumption of spherical symmetry. If aspherical collapses are allowed, the radial orbit instability that arises from small initial virial ratios might affect the density distributions of end-products. The study of three-dimensional collapses is in progress.
Acknowledgments
We are grateful to Drs. J. Makino and T. Fukushige for enlightening discussion. We are also grateful to the anonymous referee for valuable comments on the manuscript. SH thanks Max-Planck-Institut für Astronomie in Heidelberg for its hospitality during this research. This work was supported in part by the Grant-in-Aid for Scientific Research from the Ministry of Education, Science, Sports and Culture of Japan (09740172).
References
- [Aguilar 1990] Aguilar L.A., Merritt D.R., 1990, ApJ, 354, 33
- [Burkert 1990] Burkert A., 1990, MNRAS, 247, 152
- [Burkert 1993] Burkert A., 1993, A&A, 278, 23
- [Byun 1996] Byun Y.-I., et al., 1996, AJ, 111, 1889
- [Cannizzo 1992] Cannizzo J.K., Hollister T.C., 1992, ApJ, 400, 58
- [Cheng 1976] Cheng C.Z., Knorr G., 1976, J.Comput.Phys., 22, 330
- [Crane 1993] Crane P., et al., 1993, AJ, 106, 1371
- [Dubinski 1991] Dubinski J., Carlberg R., 1991, ApJ, 378, 496
- [Faber 1997] Faber S.M., et al., 1997, AJ, 114, 1771
- [Ferrarese 1994] Ferrarese L., van den Bosch F.C., Ford H.C., Jaffe W., O’Connell R.W., 1994, AJ, 108, 1598
- [Fujiwara 1983] Fujiwara T., 1983, PASJ, 35, 547
- [Fukushige 1997] Fukushige T., Makino J., 1997, ApJ, 477, L9
- [Gebhardt 1996] Gebhardt K., et al., 1996, AJ, 112, 105
- [Hozumi 1997] Hozumi S., 1997, ApJ, 487, 617
- [Hozumi 1996] Hozumi S., Fujiwara T., Kan-ya Y., 1996, PASJ, 48, 503
- [Hozumi 1995] Hozumi S., Hernquist L., 1995, ApJ, 440, 60
- [Jaffe 1994] Jaffe W., Ford H.C., O’connell R.W., van den Bosch F.C., Ferrarese L., 1994, AJ, 108, 1567
- [Kormendy 1977] Kormendy J., 1977, ApJ, 218, 333
- [Kormendy 1996] Kormendy J., Bender R., 1996, ApJ, 464, L119
- [Kravtsov 1998] Kravtsov A.V., Klypin A.A., Bullock J.S., Primack J.R., 1998, ApJ, 502, 48
- [Lauer 1995] Lauer T.R., et al., 1995, AJ, 110, 2622
- [Londrillo 1991] Londrillo P., Messina A., Stiavelli M., 1991, MNRAS, 250, 54
- [Makino 1995] Makino J., Ebisuzaki T., 1996, ApJ, 465, 527
- [May 1984] May A., van Albada T.S., 1984, MNRAS, 209, 15
- [Merritt 1985] Merritt D.R., Aguilar L.A., 1985, MNRAS, 217, 787
- [Merritt 1985] Merritt D.R., Fridman T., 1996, in Buzzoni A., Renzini A., Serrano A., eds, ASP Conf. Ser. Vol. 86, Fresh Views of Elliptical Galaxies. Astron. Soc. Pac., San Francisco, p. 13
- [Min 1989] Min K.W., Choi C.S., 1989, MNRAS, 238, 253
- [Moore 1998] Moore B., Governato F., Quinn T., Stadel J., Lake G., 1998, ApJ, 499, L5
- [Nakano 1999] Nakano T., Makino J., 1999, ApJL, submitted (astro-ph/9906131)
- [Navarro 1996] Navarro J.F., Frenk C.S., White S.D.M., 1996, ApJ, 462, 563
- [Navarro 1997] Navarro J.F., Frenk C.S., White S.D.M., 1997, ApJ, 490, 493
- [Polyachenko 1981] Polyachenko V.L., 1981, SvA Lett., 7, 79
- [Polyachenko 1992] Polyachenko V.L., 1992, SvA, 36, 482
- [Udry 1993] Udry S., 1993, A&A, 268, 35
- [Albada 1982] van Albada T.S., 1982, MNRAS, 201, 939