The Extended Blue Continuum and Line Emission around the Central Radio Galaxy in Abell 2597111Based on observations made with the NASA/ESA Hubble Space Telescope, obtained at the Space Telescope Science Institute, which is operated by the Association of Universities for Research in Astronomy, Inc., under NASA contract NAS 5-26555.
Abstract
We present results from detailed imaging of the centrally dominant radio elliptical galaxy in the cooling flow cluster Abell 2597, using data obtained with the Wide Field and Planetary Camera 2 (WFPC2) on the Hubble Space Telescope (HST). This object is one of the archetypal “blue-lobed” cooling flow radio elliptical galaxies, also displaying a luminous emission-line nebula, a compact radio source, and a significant dust lane and evidence of molecular gas in its center. We show that the radio source is surrounded by a complex network of emission-line filaments, some of which display a close spatial association with the outer boundary of the radio lobes. We present a detailed analysis of the physical properties of ionized and neutral gas associated with the radio lobes, and show that their properties are strongly suggestive of direct interactions between the radio plasma and ambient gas. We resolve the blue continuum emission into a series of knots and clumps, and present evidence that these are most likely due to regions of recent star formation. We investigate several possible triggering mechanisms for the star formation, including direct interactions with the radio source, filaments condensing from the cooling flow, or the result of an interaction with a gas-rich galaxy, which may also have been responsible for fueling the active nucleus. We propose that the properties of the source are plausibly explained in terms of accretion of gas by the cD during an interaction with a gas-rich galaxy, which combined with the fact that this object is located at the center of a dense, high-pressure ICM can account for the high rates of star formation and the strong confinement of the radio source.
Submitted to The Astrophysical Journal
1 Introduction
Rich clusters of galaxies generally contain a diffuse intracluster medium (ICM) having temperatures K and densities cm-3, as inferred from observations at X-ray and other wavebands (e.g., Sarazin (1986); Fabian (1994)). An important question related to the overall physics of the ICM concerns the central regions of clusters ( kpc), where the inferred ICM densities and pressures in some cases are sufficiently high that cooling to K can occur on timescales shorter than the cluster lifetime (e.g., Cowie & Binney (1977); Fabian & Nulsen (1977)). These “cooling flow” clusters often exhibit intense optical emission-line nebulae associated with the centrally dominant (cD) galaxies at their centers, together with blue continuum excess emission, and the strength of these effects appears to correlate with the cooling rate or central pressure of the X-ray emitting gas (Heckman (1981); Hu et al. (1985); Johnstone et al. (1987); Romanishin (1987); Romanishin & Hintzen (1988); Heckman et al. (1989); McNamara & O’Connell (1989), ?, ?; Crawford & Fabian (1992), ?; Allen (1995); McNamara (1997)). The majority of cooling flow cluster cD galaxies are also radio-loud, hosting moderately powerful but relatively compact radio sources Burns (1990).
Several intriguing questions have been posed concerning cDs in cooling flows. For example, one question concerns the energy source for the line emission: the optical line luminosities are generally one to three orders of magnitude higher than would be expected from the X-ray-derived cooling rates, if each proton in the cooling gas experienced only a single recombination (e.g., Heckman et al. (1989); Voit & Donahue (1997)). This has led to the consideration of numerous other potential sources of heating, including photoionization by young stars or the AGN, auto-ionizing shocks, photoionization by X-rays from the ICM, or cosmic-ray heating (e.g., Voit & Donahue (1997) and references therein). Likewise the blue continuum emission is of considerable interest, and suggested possibilities for its origin have included scattered nuclear light, recent star formation, or inverse Compton emission. Finally, a crucial point to investigate concerns the inter-relationships between these various components: the cD elliptical, the emission-line gas, the blue continuum, the radio source, and the surrounding dense high-pressure ICM: how are these related to one another, and do they have underlying common physical relationships?
We present results from a detailed study of a comparatively nearby strong cooling flow cluster, Abell 2597, using images obtained with the Wide Field and Planetary Camera 2 (WFPC2) on board the Hubble Space Telescope (HST). Previous radio and X-ray images have revealed that the cluster contains a moderately luminous radio source ( W Hz-1, Owen et al. (1995); , Voit & Donahue (1997); , Taylor et al. (1999)) embedded in a luminous X-ray halo with ergs s-1 (Crawford et al. (1989); Owen et al. (1992); Sarazin et al. (1995); Sarazin & McNamara (1997)). The host galaxy of the radio source is a cD elliptical containing an extended, luminous emission-line nebula (Heckman et al. (1989); Smith & Heckman (1989); Crawford & Fabian (1992); Voit & Donahue (1997)). The galaxy is remarkable for its “blue lobes” of continuum excess emission that are approximately co-incident with the radio lobes (McNamara & O’Connell (1992), ?). Spatially extended 21-cm H I absorption has also been detected against the radio lobes O’Dea et al. (1994). Although the radio source is comparatively compact (with a size kpc), its power is comparable to that of much larger FR II (“classical double”) sources, suggesting that the dense intracluster medium may play a role in its confinement. The source may be the nearest example of a compact steep-spectrum source O’Dea et al. (1994). Here we present data that fully resolve the blue emission in the lobes and reveal a complex network of emission-line and continuum filaments surrounding the central source.
All distance-dependent quantities in this paper have been calculated assuming km s-1 Mpc-1 and .
2 Observations
We observed A2597 in July 1996 with the HST WFPC2 Camera #3 (WF3) through the F410M filter, with the total exposure time being “CR-split” into three equal, consecutive exposures to facilitate the removal of cosmic rays. This is effectively a narrow-band image, mostly containing flux from the redshifted [O II] 3727 emission line. In this paper we also discuss new work that we have carried out on two archival broad-band images of A2597, taken with the WFPC2 Planetary Camera (PC1) through the F450W and F702W filters (Program ID #6228 in the HST Data Archive; see also Holtzman et al. (1996)). These images contain substantial continuum flux in addition to the redshifted [O II] 3727 and H + [N II] 6548,6583 emission lines, and therefore allow a detailed investigation of the emission-line and stellar continuum properties of this object, when combined with the F410M image. In Table 1 we present further details of the observations and filter characteristics.
| Date | Exposure | Filter | aaThe specifications for the mean central filter wavelength and filter width are given in Table 6.1 of the WFPC2 Instrument Handbook Biretta et al. (1996), where definitions for these quantities are also presented. | aaThe specifications for the mean central filter wavelength and filter width are given in Table 6.1 of the WFPC2 Instrument Handbook Biretta et al. (1996), where definitions for these quantities are also presented. | Detector | Pixel sizebbPixel sizes are from ?). |
|---|---|---|---|---|---|---|
| (s) | (Å) | (Å) | (arcsec) | |||
| 1996 July 27 | 2100 | F410M | 4090.1 | 146.7 | WF3 | 00996 |
| 1995 July 5 | 2500 | F450W | 4519.1 | 956.6 | PC1 | 00455 |
| 1995 July 5 | 2100 | F702W | 6867.8 | 1382.5 | PC1 | 00455 |
Recalibration of the data was performed using the IRAF/STSDAS222The Image Reduction and Analysis Facility (IRAF) is distributed by the National Optical Astronomy Observatories, which is operated by the Association of Universities for Research in Astronomy, Inc., under contract to the National Science Foundation. The Space Telescope Science Data Analysis System (STSDAS) is distributed by the Space Telescope Science Institute. pipeline processing software for WFPC2 (see also Holtzman et al. (1995a), ?), using updated calibration reference files where applicable. The removal of hot pixels with elevated dark currents was investigated using the IRAF/STSDAS task WARMPIX together with a table of hot pixels nearest in time to the observations, although it was found that most of these were adequately removed through the use of the appropriate dark frame.
We verified that no significant alignment shifts were present between the multiple exposures in each of the three filters, before combining them using the IRAF/STSDAS task CRREJ which removes most of the cosmic rays as well as some remaining hot and cold pixels. The cosmic ray and bad pixel removal was checked by examining the residual difference between the cleaned image and each of the two original frames, and interpolations were performed across the remaining defects. Sky subtraction in the broad-band F450W PC1 image was carried out by obtaining a mean value of the sky background in several empty regions of the frame, and subtracting this as a constant value from the entire image. The sky background for the F702W PC1 image was determined by scaling the F450W sky value using the sky count rates presented for these filters in the HST Data Handbook. This was necessary since the extended envelope of the elliptical is more prominent in the F702W image than in the F450W image, thereby precluding an accurate direct determination of the sky background. The sky count rate values (0.0071 and 0.0028 e- s-1 pixel-1 for the F450W and F702W images respectively) were sufficiently low that residual large-scale fluctuations in the images were at levels counts, well within the Poisson noise limits.
The two broad-band images were transformed to F450W and F702W magnitudes, and respectively, in the HST WFPC2 synthetic “VEGAMAG” photometric system, defined in ?), making use of the IRAF/STSDAS SYNPHOT package to obtain accurate photometric parameters for the filters used. Conversions to Johnson B and R magnitudes were not carried out at this point, since substantial differences between the WFPC2 filter response functions and those of the Johnson standard system would introduce photometric errors if significant color variations are present across the galaxy.
3 Morphological Properties
In Figure 1 we present the broad-band F702W PC1 image of A2597. It is clear that the central region of the elliptical is dominated by a complex network of filaments. Some of the filaments appear clumpy and marginally resolved, particularly the arcs extending toward the north-east and the south. There is also some evidence of a dust lane crossing the nucleus, at approximately the same position angle as the major axis of the elliptical. A small object, possibly a companion galaxy, is present to the north of the elliptical, and numerous star clusters are also distributed throughout the elliptical, some of which may be resolved (cf. Holtzman et al. (1996)).
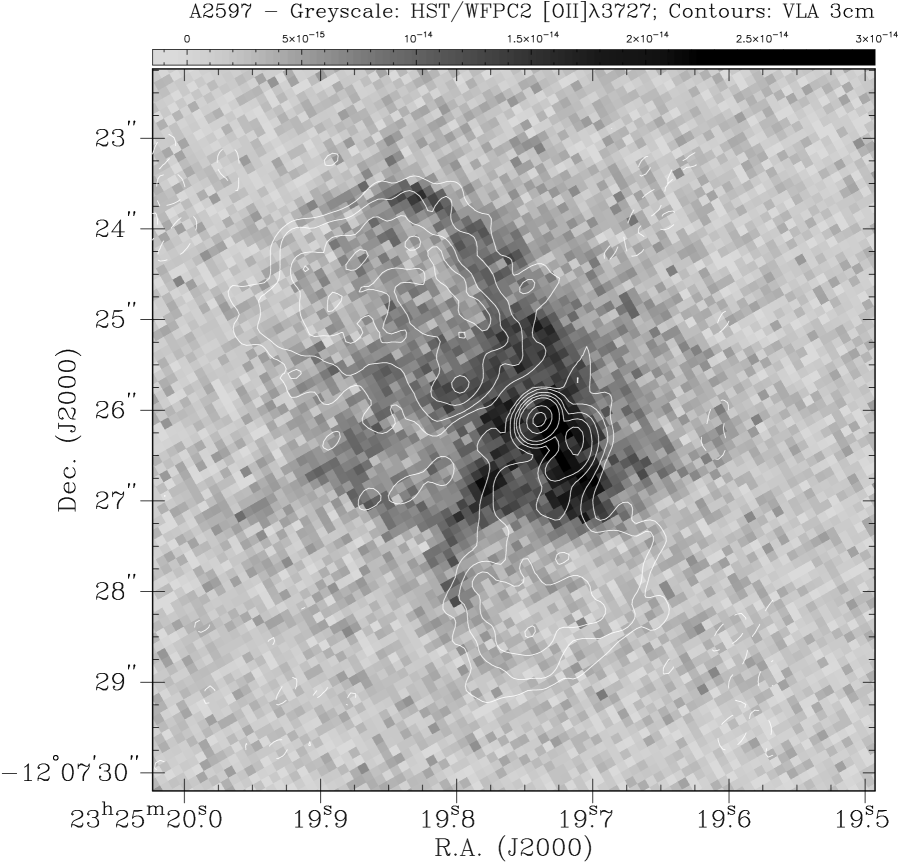
The filamentary structure dominates the narrow-band emission-line image of the galaxy, as shown in our F410M WF3 image presented in Figure 2, which contains the redshifted [O II] 3727 emission. We superpose contours from a 3.5 cm VLA image of the radio continuum emission Sarazin et al. (1995). The radio and optical images were aligned on the basis of the radio core position, which is assumed to coincide with the broad-band optical nucleus of the galaxy. Having aligned the images on this basis alone, it is remarkable that the bright northern filamentary arc follows precisely along the outer contours of the radio lobe. The rest of the northern radio continuum is also apparently associated with lower-level filamentary emission. Although there is less optical filamentation associated with the southern radio lobe, an emission-line filament is present near the eastern edge of this lobe. Closer to the center, there is a bright, compact region of emission immediately south-west of the nucleus, which is co-incident with a radio hotspot as well as an abrupt change in the orientation of the radio lobe. We also note that some of the filamentary structures within the galaxy are apparently unassociated with the radio lobes, particularly the filaments extending away from the nucleus toward the east, and a more diffuse region surrounding the nucleus on the west.
3.1 Separating the Continuum and Emission-Line Features
One of the interesting questions related to the properties of the filaments concerns the relative fractions of continuum and emission-line contributions to their total flux. We have investigated this by comparing the narrow-band F410M image to the broad-band F450W image, both of which contain the redshifted [O II] 3727 emission line but contain different amounts of stellar continuum flux. We used the IRAF/STSDAS package DRIZZLE Fruchter & Hook (1997) to transform the higher-resolution PC1 F450W image to the coarser pixel scale of the WF3 F410M image, also taking into account the differences in orientation angles and geometrical distortions across the chips.
We used the SYNPHOT package to flux-calibrate each of these two images in cgs units (ergs s-1 cm-2 arcsec-2). A fundamental uncertainty inherent in this calibration is the lack of a detailed knowledge of the spectral energy distribution across the filter bandpass at each pixel in the image. Two limiting cases are: (1) monochromatic emission, with all the flux being emitted at one wavelength (appropriate for pixels dominated by a single emission line); (2) a flat spectral energy distribution, specifically with constant flux density per unit wavelength . For each of the two filters, we generated a flux calibration factor for each limiting case using the SYNPHOT task BANDPAR. The difference between the two cases is negligible for the F410M filter () but is of order for the broader F450W filter. Therefore we flux-calibrated the F410M filter using the monochromatic limit, while the F450W filter was calibrated with the flat-spectrum approximation, which is justified by the fact that the flux in this broader filter is dominated by stellar continuum (based on examining the spatially integrated ground-based spectra of Voit & Donahue (1997)). We note however that this approximation may break down for individual pixels with extremely high [O II] 3727 equivalent widths, introducing a maximum error of (for pure line emission), or more likely (for comparable proportions of line and continuum emission).
We then subtracted the flux-calibrated F410M image from the geometrically transformed F450W image to investigate whether the filaments display any residual continuum emission. As described above, the uncertainties in flux calibration due to differences in the filter bandpasses are likely to be , therefore this subtraction provides a reliable indication of the relative contribution of emission-line and continuum emission to the filaments. We found that the extended filaments and arcs around the radio lobes disappeared almost entirely in the subtracted image, and therefore can be considered to consist predominantly of [O II] 3727 line emission. The filaments nearer the galaxy nucleus, however, display a mixture of continuum and line emission and are apparently dominated in some regions by excess blue continuum, which we discuss in more detail in the following section.
3.2 The Blue Continuum Excess
We have used the broad-band PC1 F450W and F702W images to investigate the detailed spatial distribution and morphology of excess blue emission in A2597, which was first discovered in ground-based images by ?) as marginally resolved U I continuum excess aligned along the radio axis. We first matched both PC1 images to a common point-spread function (PSF) by convolving each image with the PSF of the other, having computed the appropriate PSF for each filter band using the HST Tiny Tim software Krist & Hook (1997). The images were then calibrated in the HST VEGAMAG system, after which we calculated the color distribution of the galaxy, which we present in Figure 3. We have also verified that smoothing the HST data to the resolution of the ground-based images reveals a good correspondence between the U-band and F450W blue continuum. The blue emission in Figure 3 is resolved in detail into a number of separate components: (1) a band of extended, intense blue emission around the “base” of the northern radio lobe, immediately north-east of the nucleus; (2) a group of blue point-like features south-west from the southern radio lobe; (3) a blue arc that appears to trace the edge of the southern radio lobe; (4) diffuse blue emission around the radio lobes, and specifically to the north-west of the nucleus.
The possibility that the blue continuum is predominantly due to scattered nuclear light is ruled out on the basis of its low observed polarization McNamara et al. (1998); optical synchrotron or inverse Compton emission are also not feasible since none of the blue continuum sources correspond to strong radio hotspots. The most plausible remaining explanation is that the blue continuum is due to young stars, and in this section we examine various star formation scenarios that may be responsible for producing the extended blue continuum and the isolated blue clusters. In §6 we present a more detailed discussion of the relative plausibility of several possible triggering mechanisms for the star formation, together with various scenarios for the origin of the gas from which the stars are formed.
3.2.1 The Extended and Diffuse Blue Continuum
Our HST images resolve an intense band of blue continuum to the east and north of the nucleus, extending around toward the west, thereby covering a spatial scale of several kiloparsecs (Figure 3). Some less intense blue emission is also associated with the southern radio lobe. Resolving the blue emission allows a more accurate estimate of its intrinsic color and luminosity than was previously obtainable from the ground-based measurements obtained by ?), therefore we use our WFPC2 data to investigate the star formation processes involved.
The intrinsic color of the blue excess is derived from the residual continuum in each band after subtracting the underlying elliptical fit, as described in more detail in §3.3. In that section we also discuss the effects of dust obscuration, which is present in the F702W band as well as F450W. Since the strongest obscuration is confined to a few small localized patches, we are still able to discuss the overall properties of the remainder of the blue continuum excess. Both the F450W and F702W bands are also contaminated by redshifted emission lines, [O II] 3727 and H+[N II] respectively. However, the total integrated flux from the excess blue emission in the F450W image is substantially higher than the flux from the [O II] 3727 emission in that region observed through the F410M filter; this also applies to the comparison between the F702W excess continuum and the H+[N II] flux scaled from the [O II] 3727 flux using the mean H+[N II] / [O II] 3727 ratio for this object. Furthermore, the bulk of the line emission displays little spatial correspondence with the blue continuum. Therefore in this analysis we neglect to first order the contribution from line emission to the continuum color; spatially resolved spectrophotometry would be required to further quantify its contribution. We measure the intrinsic color of the blue excess to be in the range with a surface brightness ranging from mag arcsec-2; the integrated absolute magnitude of the entire extended region of blue continuum excess is (spread over a projected area of kpc2).
We compare the measured properties of the blue continuum to a set of stellar population synthesis models (Charlot & Bruzual (1999), private communication), which have been K-corrected to the redshift of A2597 and calibrated in the HST VEGAMAG system using our HST WFPC2 filter bandpass transmission curves. We find it preferable to retain our measured magnitudes in the VEGAMAG system and compare them with models that have also been calculated in this system, rather than attempting to transform the magnitudes to other systems such as the Johnson/Cousins system, because uncertainties in the color terms can translate into errors of several tenths of a magnitude. The models are shown in Figure 4 and represent two scenarios for star formation: (1) a constant star formation rate (SFR), assuming an invariant IMF; (2) an instantaneous burst of star formation (or “Simple Stellar Population”, SSP). In each case we investigated two standard IMFs for which models were available, namely ?) and ?), each with upper and lower mass cutoffs of 0.1 and 100 respectively. We also examined models of different metallicities, specifically , 0.2 and 0.02. Further details of the model parameterizations are described in Charlot & Bruzual (1991, 1999) and ?). Having calculated HST colors and magnitudes for these various models, we note that the difference between the color evolution of and 0.2 models is minimal for the constant SFR models, thus in Figure 4 we only plot the 0.2 models for the purposes of clarity. For the SSP models, the color evolution is more sensitive to metallicity but is relatively insensitive to the choice of IMF, therefore the SSP models that we plot are for the Salpeter IMF only.
In Table 2 we present the inferred star formation parameters that are required to match the observed range of colors and integrated absolute magnitude of the extended blue continuum distribution, for the various star formation scenarios that we have described. For each model, we tabulate the upper and lower limits of the range of epochs in its evolution that reproduce our observed color. For constant SFR models, the SFR for each of the two epochs is obtained by matching the model to the absolute magnitude. For the instantaneous burst models we tabulate the total mass of stars (an SFR is not physically meaningful in this case since the burst is represented by a delta-function).
We point out that the inferred ages are all highly dependent upon the measured colors, and should therefore be interpreted as upper limits due to the likely presence of reddening across most of the field. For example, a decrease in the intrinsic color by only a further 0.2 magnitudes will yield ages as low as yr for the continuous SFR models, and yr for the instantaneous burst models. However, due to our lack of accurate reddening estimates (precluded by the presence of emission lines in both bands) we are unable to quantify this further.
| Model | (yr) | SFR (/yr) |
|---|---|---|
| Const. SFR: Salpeter: | ||
| 0.2 | ||
| 0.02 | ||
| Scalo: | ||
| 0.2 | ||
| 0.02 | ||
| ) | ||
| Inst. Burst: Salpeter: | ||
| 0.2 | ||
| 0.02 | ||
| Scalo: | ||
| 0.2 | ||
| 0.02 |
Note. — The upper and lower limits of the timescale of each model correspond to the epochs in the model evolution that produce the observed range of colors. For the Constant SFR models, the tabulated SFR is that which is required to match the observed integrated magnitude of the excess blue continuum. For the Instantaneous Burst models, we instead tabulate the total mass of stars since in this model all the star formation occurs at one instant in time. Further details are given in the text.
The southern radio lobe displays substantially less blue emission than the northern lobe. Its color is similar to that of the northern lobe but its flux is much less, with an integrated apparent magnitude of only . Since it is fainter, errors in its measured properties are much more dominated by uncertainties in the underlying continuum, reddening correction, and contributions from line emission, therefore we do not feel justified in carrying out a comparison with star formation models to the same level of detail as the more prominent northern blue excess. We do note, however, one interesting feature of the southern blue emission, namely a blue “arc” that follows the outer contours of the southern lobe, from its western edge around to the south. This is unlikely to correspond to optical synchrotron emission, as the radio contours show no enhanced brightening at the location of the arc, thus the arc may also indicate emission from young stars although our data are of insufficient S/N to quantify this further.
3.2.2 The Isolated Blue Knots
| ID | |||||
|---|---|---|---|---|---|
| (″) | (″) | (mag) | (mag) | (mag) | |
| 1 | |||||
| 2 | |||||
| 3 | |||||
| 4 |
Note. — For each object, the offsets in Right Ascension and Declination ( and respectively) are given in arcseconds relative to the continuum nucleus of the galaxy. The 1 uncertainties on the individual magnitudes and are derived from the count-rate statistics, and are combined in quadrature to yield uncertainties for the color index .
We now discuss a group of four blue clumps, or knots, that are readily apparent south-west of the southern radio lobe. Because of their relative isolation, they can serve as a valuable reference for comparison when discussing the star formation that has occurred north of the nucleus. In the original (unsmoothed) PC1 images they are marginally resolved, with FWHM values in the range . They apparently correspond to the southern U I blue continuum excess reported by ?). These features do not appear to be directly associated with the radio lobe, and in all likelihood they are young star clusters. In Table 3 we present the magnitudes and colors of these objects, calibrated in the HST VEGAMAG photometric system. Our photometric analysis of these objects indicates that their colors are about magnitudes bluer than the surrounding elliptical continuum. As a consistency check, we also carried out photometry of a number of the brighter, redder objects around A2597 in the F702W image, and compared these with the R-band photometry of the same objects presented by ?). We found that the magnitudes typically agreed to within mag, which is quite satisfactory given the uncertainties in the color terms that had been used by ?) to transform their HST magnitudes to the Johnson/Cousins system.
We have compared the colors and magnitudes of the blue clumps to the stellar synthesis models of ?), K-corrected to the redshift of A2597 and calibrated in the HST bandpasses as described in the previous section. Since we are investigating individual clusters in this case, we carry out a comparison only with the instantaneous burst models, with the same range of metallicities and IMFs as for the northern blue continuum. In the lower panel of Figure 4 we plot the evolution in color-magnitude space of three population synthesis models with a Salpeter IMF, metallicities of , 0.2 and 0.02, and total mass , together with the observed colors and magnitudes of the blue clusters. The comparison suggests that the colors of the three bluest clusters are consistent with ages Myr and metallicities above , with ages of the two redder of these three clusters ranging up to a maximum of Myr for masses up to . The reddest of the four clusters is either much older ( yr) with a mass , or otherwise is the same age as the other three, but has higher extinction and/or a metallicity significantly above solar (however, this cluster is fainter than the other three and its properties are not as well constrained). In § 6 we discuss in further detail the implications of the measured properties of the blue continuum regions for various physical mechanisms that can be responsible for triggering the star formation.
3.3 Elliptical Isophote Fits
In order to present a more detailed discussion of the various components that make up the central galaxy, including the filaments, the blue continuum, and possible dust obscuration, it is necessary to model and remove the underlying elliptical stellar continuum distribution. This was done by means of the IRAF/STSDAS task ELLIPSE (based on an algorithm described by Jedrzejewski (1987)), which makes use of iterative sigma-clipping algorithms to reject the possible contribution of non-elliptical components to the fit.
Our data are complicated both by the presence of filaments in emission, and also by apparent dust absorption in the central regions of the galaxy. We initially attempted techniques similar to those described by ?) and ?), involving a number of repeated fits to both the F702W and F450W images, which allows the possibility of correcting for patches of dust obscuration. However, this technique does not easily allow additional corrections for emission features, particularly the line emission from the filaments which is present in both the F450W and the F702W broad-band images of A2597.
Therefore, we obtained the underlying elliptical continuum by fitting isophotes to a near-infrared H-band image of A2597, recently obtained with the F160W filter on NICMOS by ?). This band has the advantage of containing no line emission from the filaments, and also with the effect of dust obscuration being much reduced (although still present). We fitted elliptical isophotes to this image by allowing the flux, ellipticity and position angle of each isophote to vary freely, and using sigma-clipping to reject features deviating by more than 3 from the mean level in each isophote (for example corresponding to stars or clusters, or the dust obscuration region). Inspecting the resulting residual image showed that this model provided a good fit to the overall galaxy profile, with the only significant residuals corresponding to localized features such as clusters or dust absorption patches. Some low-level residual structure on large scales was also present, which is attributed to uncertainties in the flat-fielding applied in the reduction process.
The elliptical model obtained from the NICMOS data was then applied to the F702W and F450W images, by keeping the isophote shape parameters constant (i.e., ellipticity and position angle), but allowing the flux of each isophote to vary freely, and using sigma-clipping as before to remove contributions due to the filaments or dust patches. For isophotes with a semi-major axis we had to allow the isophote shape parameters to vary, since the smaller size of the NICMOS image, together with its low-level flat-field effects, produced inaccuracies in the model at these large radii. However, for isophotes inside this radius the NICMOS isophote shapes provided a very good fit to the F702W and F450W data. Subtracting the resulting model from the input image yielded for each filter a first-iteration residual image which contained most (but not yet all) of the “excess” emission. Because of the substantial contributions in emission from the filaments within the central , we carried out a second iteration, according to the following procedure. Pixels deviating from 0 by more than 3 times the rms value in the residual image were subtracted from the original input image to yield a second input image. New isophotes were then fitted to this image, using the isophote shape parameters from the first iteration and allowing only the flux to vary, and again using sigma-clipping to reject non-elliptical emission features. This yielded a second residual image; repeating this procedure further showed that the process had converged by the second iteration to provide an accurate representation of the underlying elliptical continuum flux distribution, together with the residual emission and absorption features.
In Figure 5 we present the final set of isophotal parameters fitted to the galaxy. The elliptical continuum color index across most of the galaxy is in the range which corresponds to B V , a typical value for gE galaxies (e.g., Carollo et al. (1997)). The color is somewhat redder in the central region, possibly related to the presence of dust. One interesting feature of the galaxy is a change of in the orientation of the major axis, relative to the outer isophotes, for semi-major axis lengths . This also corresponds to an increase in ellipticity toward the center. This change may be due to the presence of dust located on either side of the nucleus, although in the F160W image the change is quite smooth and therefore we cannot rule out the possibility that this may reflect a genuine shift in the underlying light distribution, for example due to a nuclear bar (e.g., Nieto et al. (1992)).
In Figure 6 we present the “residual” filamentary structure in the F702W band, produced by subtracting the elliptical galaxy model from the original image. We also overlay contours representing the VLA 3.5 cm radio continuum image Sarazin et al. (1995). The positive emission features in this image are likely to be dominated by H line emission rather than stellar continuum, based on the fact that the filamentary structures in the F410M image (Figure 2) are dominated by [O II] 3727 emission. The filaments in Figure 6 are sampled with both higher S/N and better spatial resolution than those in Figure 2: the bright arcs are resolved into clumps in several locations, and diffuse emission can be clearly distinguished across the face of the northern radio lobe. In addition, the presence of strong, patchy dust obscuration is evident in a number of locations, particularly to the south-east and to the north of the nucleus. Some weaker obscuration is also present west of the nucleus, just beyond the bright radio hotspot and associated emission-line filaments.
3.4 The Emission-Line Morphology
| Region | |||
|---|---|---|---|
| (ergs s-1 cm-2) | (ergs s-1) | (ergs s-1) | |
| N. arc - upper | |||
| N. arc - lower | |||
| N. lobe face | |||
| N. lobe (total) | |||
| SW knot | |||
| SE arc |
Note. — The [O II] 3727 line fluxes were obtained by summing all the pixels in the corresponding regions on the WF3 F410M image, which is dominated by [O II] 3727 line emission.
The distribution of optical line emission around the northern lobe of the radio source, as displayed in Figures 2 and 6, can be divided into three regions: (1) the bright “upper” arc along the north-west of the lobe; (2) a less distinct “lower” arc around the southern boundary of the lobe; (3) diffuse, lower surface-brightness emission across the face of the radio lobe. The upper arc runs parallel to a bright ridge of enhanced radio emission along the edge of the lobe, both of which display a linear extent of (2.8 kpc). The arcs are dominated by emission-line radiation; the lack of any detected blue continuum emission excludes non-thermal processes such as optical synchrotron emission or inverse Compton scattering. We discuss these features in more detail in §4.
The southern lobe displays a compact knot of high surface-brightness line emission co-incident with the strong radio hotspot immediately south-west from the nucleus. A prominent semi-circular filament of emission is also present SE from the nucleus, along the eastern edge of the southern radio lobe. We find that these features are also dominated by line emission and not continuum radiation. We discuss the southern emission-line features further in §5.
In Table 4 we present the integrated [O II] 3727 fluxes of each of the three northern emission-line regions, together with the total luminosity of emission-line gas surrounding the northern radio lobe, as well as the bright emission-line knot immediately SW from the nucleus and the semi-circular SE arc. We also derive the H luminosities for each of these regions from the measured [O II] 3727 line fluxes by adopting a canonical value of H / [O II] 3727 = 0.23 (uncorrected for reddening), determined from the ground-based spectra of ?). Implicit in this conversion is the assumption that the excitation and extinction properties of the nebula as a whole are also representative of the material associated with each radio lobe; this approximation is necessitated by the current absence of spectra with higher spatial resolution.
4 Interaction between the Northern Radio Lobe and Ambient Gas
A prominent feature of this galaxy is the complex network of emission-line filaments associated with the radio lobes. In this section we examine scenarios in which the northern filaments trace physical interactions between the northern radio lobe and ambient gas. We derive physical parameters of the ionized and neutral gas around the radio lobe, including the neutral fraction and volume filling factor of the gas and its total mass, by combining constraints obtained from our new emission-line data with those from previous observations.
We consider a geometry in which the radio lobe is surrounded by an approximately uniform shell of line-emitting gas (except along the edge furthest away from the nucleus, where no significant emission is detected). This scenario is suggested by the similarities in flux and spatial extent of the upper and lower edge-brightened arcs. Furthermore, the integrated flux of the diffuse emission across the face of the radio lobe (which would include emission both from behind and in front of the lobe) is approximately twice that of the flux in each arc, supporting an edge-brightened geometry for the shell.
Limits on the shell thickness or depth , obtained from the width of the arcs, are thus applicable to the line-emitting gas covering the face of the radio lobe. The width of the bright upper arc is only marginally resolved, covering less than PC1 pixels (130 pc), therefore we retain as a free parameter normalized to a fiducial value of 100 pc. The surface area of diffuse line emission across the face of the radio lobe is arcsec2, thus the volume of the emission-line region in front of the radio lobe is kpc3. Given standard assumptions such as Case B ionization conditions, uniform density emission-line gas, and an edge-brightened shell geometry, our observed H luminosity then provides a combined constraint on the volume filling factor and electron density of the warm ionized gas (with electron temperature ):
| (1) |
We aim to derive the physical properties of the gas by combining this constraint with those obtained from H I observations. ?) observed extended, broad H I absorption ( km s-1) against the northern radio lobe. The kinematic properties are similar to those of the optical line-emitting gas, thus the northern radio lobe would be surrounded by a collection of clouds containing both neutral and ionized gas. In this section we derive physical properties of the gas for the following two plausible scenarios:
-
1.
The H I is co-spatial with the ionized gas, with each H I cloud possessing an ionized “skin” responsible for the line emission (e.g., O’Dea et al. (1994)). In this case the ionized and neutral gas are swept up by the expanding radio lobe into a shell, thereby compressing the gas and determining its kinematics, but not necessarily ionizing it (alternative ionization mechanisms are discussed by Voit & Donahue (1997)). For simplicity, in this scenario we consider the line-emitting gas around the northern lobe to be entirely photoionized by radiation originating from an external source (e.g., the active nucleus, hot stars, or radiation escaping from shocks in another region).
-
2.
The ionized and neutral gas are located in different regions, for example if the northern radio lobe expands into a previously existing ensemble of neutral clouds (tidal debris or material condensed out of the cooling flow), fully ionizing each cloud by means of fast shocks driven into the gas. In this case, the radio lobe would be surrounded by an inner region of mostly ionized gas and an outer region of neutral clouds (see for example the schematic presented in Bicknell et al. (1997)). The ionized gas would contain a mixture of cooling “post-shock” gas together with photoionized “precursor” gas that absorbs ionizing radiation emitted by the shocked gas.
4.1 Scenarios for the Distribution of Neutral and Ionized Gas
4.1.1 Co-Spatial Neutral and Ionized Gas
In this scenario, the neutral and warm ionized components occupy the same region but are represented by different volume filling factors. Parameterizing the depth of the H I absorbing material by thus converts the observed H I column density ( cm-2, O’Dea et al. (1994)) to a combined constraint on the H I density and volume filling factor:
| (2) |
Pressure balance is considered to hold between the neutral gas (spin temperature K), warm ionized gas ( K) and the hot ambient medium ( K). We define to represent the relative masses of neutral and warm ionized gas, and combine this with equations (1) and (2) to obtain the gas densities:
| (3) |
Taking cm-3 Voit & Donahue (1997) to represent the overall line-emitting gas, we obtain the volume filling factor and thus the total mass of neutral and ionized gas in the shell, assuming only that its thickness remains approximately uniform:
| (4) |
If the gas is distributed in the form of approximately spherical neutral clouds with ionized skins, then the above constraints yield the relative extent of the and cloud radius:
| (5) |
We use this, together with the projected surface area of the northern lobe and the H I volume filling factor, to constrain the H I cloud covering fraction and cloud radius:
| (6) |
Combining this with the limits on the covering fraction of the extended H I absorption in front of the northern radio lobe ( O’Dea et al. (1994)) and using our determination of the surface area of line-emitting gas in front of the radio lobe, yields an upper limit on the cloud radius: and corresponding numbers of clouds: A covering fraction of unity is obtained with clouds, with radii pc.
We conclude our description of the physical properties of the gas in this scenario with a calculation of the inferred pressure associated with the gas: dyn cm-2 . This is in very good agreement with the central X-ray pressure dyn cm-2 derived by ?) but is lower than the estimated minimum pressure of the northern lobe, dyn cm-2 (re-calculated with the cosmological parameters used in the present paper), thereby suggesting that the radio lobe is somewhat overpressured with respect to the surrounding gas.
4.1.2 Spatially Distinct Neutral and Ionized Components
An alternative scenario for the distribution of neutral and ionized gas involves expansion of the radio lobe into a more extended region of neutral clouds. Each cloud is fully ionized by the passage of the bowshock, analagous to the scenario envisioned for GPS/CSS radio sources Bicknell et al. (1997). The shell of warm ionized gas around the radio lobe would be surrounded by neutral clouds whose origin may be unassociated with the radio lobe (for example, tidal debris around the host galaxy, or gas condensed from the cluster cooling flow). Line emission is produced by cooling “post-shock” gas downstream from the shocks as well as “precursor” material immediately upstream from the shocks, photoionized by soft X-ray / UV radiation from the post-shock gas. The ionized gas clouds possess a bi-modal density distribution: the post-shock clouds have densities orders of magnitude above those of the photoionized precursor gas, while the relative total line radiation output of the two regions are approximately equal Dopita & Sutherland (1995).
We consider a case in which the expansion velocity of the emission-line shell surrounding the radio lobe is equated with a shock velocity km s-1 (i.e., half of the observed optical linewidth). A relatively uniform expansion speed is suggested by the well-ordered morphology of the emission-line gas. MAPPINGS II models show that the post-shock material in this case cools to gas with a density times greater than the precursor material (Dopita & Sutherland (1996); Koekemoer (1996); Koekemoer & Bicknell (1998)). The electron density measured from the S II ratio by ?) represents an average over all the emission from both regions, thus we use their value together with the ratio of post-shock / precursor line emission to infer a precursor density cm-3. Using our observed H luminosity, together with the relationships for shock and precursor emission, yields a required shock surface area of kpc2 to account for the observed line emission. This compares well with the apparent surface area of the shell ( kpc2) — i.e., the covering fraction of shocks across the emission-line shell would be of order unity for precursor gas of this density. The corresponding spatial scale on which the precursor gas is ionized would be of order pc (depending on its volume filling factor); beyond this distance the gas would remain largely neutral.
4.2 A Comparison of the Energy Budget for Each Scenario
Having calculated the expected physical properties of the gas in each of the two preceding scenarios, we now compare their relative likelihood. In particular, we examine whether the radio lobe can supply the required energy to the surrounding gas.
We begin with the total minimum energy content of the northern radio lobe, ergs, the lower limit on the radio source age yr from the synchrotron loss timescale, and the radio luminosity of the northern lobe ergs s-1 (derived from the observed radio properties by Sarazin et al. (1995), and rescaled to the cosmological parameters used in this paper). We assume a fiducial value of for the conversion efficiency of the total jet kinetic power into radio emission, noting that this value is not well constrained observationally (Eilek (1982); Begelman et al. (1984)), i.e., ergs s-1.
In the first scenario, the energy transfer from the expanding radio cocoon to the gas is predominantly kinetic. Given the cospatial nature of the gas components in this scenario, we equate the expansion speed of the optical line-emitting gas (300 km s-1) with that of the H I. The kinetic energy of the neutral and warm ionized gas components is then:
| (7) |
which is substantially less than the total minimum energy content of the northern radio lobe. In other words, the rate of energy input required to supply this amount of kinetic energy to the combined neutral and warm ionized gas components need only be of the total energy input into the radio lobe, therefore it is feasible that the expansion of the radio lobe can account for the gas kinematics of the northern emission-line filament system.
For the second scenario, we investigate whether the energy input from the lobe expansion can feasibly account for the observed line luminosity through ionization by radiative shocks. If the rate of work done on the ambient medium by the expansion of the lobe corresponds directly to the total luminosity of the fully radiative shocks that are produced, then the resulting H line luminosity can be written in terms of the jet energy flux and shock velocity Bicknell et al. (1997):
| (8) |
where we have equated the shock velocity with the 300 km s-1 expansion velocity of the emission-line shell surrounding the radio lobe. Despite the inherent uncertainties in deriving the radio lobe and jet energetic parameters, this value of is in good agreement with our measured total integrated line luminosity for the northern lobe, presented in Table 4. We note that this does not necessarily imply that shocks are the dominant ionization mechanism in the northern lobe; instead we are stating that shocks, if present, correspond to a set of physically plausible values of parameter space. There is some question whether the overall properties of the entire EELR around A2597 can be explained in terms of shocks, given the constraints on the electron temperature and gas ionization state presented by ?). However, their results apply primarily to the integrated spectrum of the emission-line nebula, to which the northern lobe contributes only of the flux, thus local ionizing mechanisms in this region can readily be accommodated; higher spatial resolution spectra will prove useful in further addressing such questions.
Thus, we have shown: (1) it is energetically feasible that the northern radio lobe can supply the kinetic energy of the surrounding gas, irrespective of the ionization mechanism; (2) if the radio lobe expansion indeed produces auto-ionizing shocks in the gas, then the required shock luminosity and other properties of the gas are in good agreement with the observations.
5 Deflection of the Southern Radio Jet
The bright radio hotspot 05 south-west of the nucleus is a region of great interest since this location corresponds to a sharp change in the direction of the radio jet toward the east, which also appears to dramatically affect the resultant morphology of the entire southern radio lobe. ?) postulated the presence of a dense deflecting clump of cool gas ( K), but the available (ground-based) optical data were of insufficient spatial resolution to verify its existence. Our HST images clearly resolve a knot of high surface-brightness optical line emission associated with the radio hotspot. This object is therefore a highly suitable candidate for conducting a study of the effects of a direct jet / gas cloud interaction. Here we use our images to infer the physical properties of the gas clouds, including their size, mass and density (degree of inhomogeneity).
Two plausible scenarios exist for describing the encounter between the jet and the gas: either the radio jet propagates into a pre-existing region of cool dense gas, or an initially straight jet is deflected as a result of an interaction with one or more gas clouds moving directly into it (for example, due to their orbital motion around the galaxy). The number of free parameters in each case prohibits a discussion of which scenario is more likely. Rather, we examine fundamental physical properties of the gas that would be applicable to either scenario, using considerations based on energetics and momentum transfer, and following similar arguments to those previously presented by ?) and ?).
We consider a non-relativistic jet with fiducial speed km s-1 and kinetic power ergs s-1. The acceleration imparted by the jet to gas approximately at rest is related to the jet momentum flux, thus the minimum gas mass required to significantly deflect the jet over its lifetime (equated to the radio source age yr) is . If the gas cloud volume is approximately spherical (with a diameter given by its transverse dimension, pc), the required mean density of hydrogen nuclei must exceed cm-3.
We next examine the heating of the gas by the jet, using to represent the fraction of which is converted into heat energy. The cloud needs to be dense enough to cool at this rate or faster, otherwise it would be heated to high temperatures and disperse. Writing as the rms average hydrogen number density of the cloud, and the cooling coefficient as ergs s-1 cm3, the balance between the cooling and heating rates requires
| (9) |
Comparing this with suggests that the cloud either exceeds the lower limit on its mass and/or is inhomogeneous. Finally, the rms electron density in the cloud that is required to produce the observed H line luminosity is
| (10) |
The similarity of the densities in equations (9) and (10) might suggest that the deflecting cloud was composed purely of warm ionized gas at K. However, in photoionized gas at these temperatures the cooling coefficient is only ergs s-1 cm3 and such gas could not radiate energy deposited by the jet unless the efficiency of deposition was low, . For typical conditions in photoionized emission line gas, the bolometric luminosity is about 25 times that in H, or ergs s-1, which is much smaller than . Thus, either the efficiency of heating the deflecting cloud is low, or the cloud contains substantial amounts of atomic and/or molecular gas. The latter scenario is supported independently by the recent HST NICMOS detection Donahue et al. (1998) of significant molecular H2 emission co-incident with the knot. Hence, we suggest that the observed properties of this emission-line knot are consistent with the presence of clumps of dense gas sufficiently massive to deflect the jet significantly over the lifetime of the radio source.
6 Implications for Cooling Flows, cD Galaxies and Radio Sources
We have so far demonstrated that the emission-line nebula in the cD elliptical of A2597 displays a close association with the radio source, and that several different properties of the gas are strongly suggestive of direct interactions between the radio lobes and the ambient medium. We have also shown that the blue continuum emission originates in a number of resolved locations within the central few kpc, and does not display a direct spatial correspondence with the emission-line filaments. We have identified a number of regions of recent or on-going star formation that can be modeled either as single-burst populations with ages of several times yr, or as continuous (constant) star formation with ages about an order of magnitude higher. We have also resolved an elongated region of strong dust obscuration immediately south-east of the nucleus, together with evidence of patches of dust in other locations nearby.
In this section we explore the likely physical inter-relationships between these various components in cooling flow clusters, using A2597 as an example. Studies to date suggest that the strength of the blue continuum excess and nebular line emission around cD galaxies in cooling flow clusters increases as a function of the inferred total cooling rate (McNamara & O’Connell (1989); Allen (1995); McNamara (1997) and references therein). Cooling flow cluster cDs possess abnormally high amounts of molecular gas and dust, and display more compact radio morphologies, relative to cD galaxies not associated with cooling flow clusters. Thus, it is crucial to understand the underlying physical connection between the dense, high-pressure ICM surrounding the elliptical, the blue continuum excess, the nebular line strength, the strong dust obscuration, and the radio source. In particular, is the presence of a cooling flow either a necessary and / or sufficient condition to explain these properties of the central galaxy, or do other processes also play a role (e.g., mergers or interactions)? We address this issue by breaking it down into the following questions: (1) what has triggered the recent star formation; (2) what is responsible for triggering the AGN; (3) how are the triggering mechanisms related to the fuel supply in each case, and what is the relationship between the star formation mechanism, the triggering of the radio source, and the presence of a cooling flow?
6.1 What has Triggered the Star Formation?
Generally, star formation in dense molecular clouds is triggered by compression of the clouds resulting from enhanced external pressure, or by deep molecular shocks associated with cloud-cloud collisions. Here we examine the likelihood of various means of inducing these effects to result in the formation of stars.
One triggering mechanism for star formation is direct interactions between the radio jets or lobes and dense gas clouds immediately surrounding them (Rees (1989); Begelman & Cioffi (1989); De Young (1989), ?; Daly (1990)). This scenario invokes the collapse of marginally unstable clouds in the ambient medium, resulting from overpressurization as they are overtaken by the expanding radio cocoon. It predicts that, while star formation is initiated along the radio lobe boundaries, the spatial correlation is short-lived due to differences between the orbits of the stars and the motion of the radio plasma. The relatively mild expansion velocity of the cocoon, compared to the working surface of the jet, prevents disruption of the clouds and facilitates their collapse. The large-scale asymmetry of the blue continuum in A2597 would correspond to an intrinsic asymmetry in the initial distribution of molecular gas clouds. The radio source age in this scenario would have to agree with the ages of the young stars, which we find to be in the range yr from the instantaneous burst stellar model synthesis ages. The lower limit on the radio source lifetime is yr from the synchrotron spectral ageing analysis, but given the uncertainties involved in this derivation the actual radio age can be substantially higher. Thus, from timescale arguments it is plausible that the star formation is triggered by the radio source. This would imply that the radio source is intrinsically old but unable to penetrate the dense surrounding ICM to scales of more than a few kpc.
Star formation in cooling flows is also proposed to occur via pressure-driven collapse of filaments or clouds condensing out of the cooling flow (Fabian et al. (1986); McNamara & O’Connell (1989); Allen (1995)). The inferred cooling flow mass accretion rates for A2597 (Crawford et al. (1989); Edge et al. (1992)) are about two orders of magnitude above our values of the SFR. Such discrepancies are well-known from previous studies of A2597 and other cooling-flow clusters. Possible solutions include erroneous estimates of the SFR, for example due to a time-variable SFR or changing IMFs; or mass deposition into material that does not necessarily form stars. These and other possibilities are discussed in detail by ?); ?); ?); and ?). We do not rule this out as a potential source of fuel for star formation. It does not readily predict, however, the highly asymmetric structure of the blue continuum in A2597. One means of obtaining asymmetry is via subcluster merging activity (e.g., Crawford & Fabian (1992), ?; Daines et al. (1994)). However, A2597 displays little evidence of a recent cluster/subcluster merger, as the X-ray data suggest a relaxed system Sarazin & McNamara (1997). The spatial scale of the blue continuum emission is also one to two orders of magnitude smaller, kpc, compared with the typical cooling radius of kpc at which the stars are expected to form Johnstone et al. (1987). Thus, cooling of the X-ray gas can provide a source of cooler material for star formation, but an additional mechanism appears to be required for triggering the concentrated massive star formation observed in A2597.
This leads us to discuss star formation triggered via accretion of a gas-rich companion galaxy by the elliptical. Galaxy interactions are generally associated with triggering star formation (e.g., Toomre & Toomre (1972); see also Balick & Heckman (1982), and Barnes & Hernquist (1992) for reviews). Detailed n-body/hydrodynamic models show that interactions between ellipticals and small gas-rich galaxies generally lead to gas accretion into the elliptical core Weil & Hernquist (1993), triggering a centrally condensed starburst as well as star formation in the tidal debris (e.g., Mihos & Hernquist (1994a), ?, ?). Such features are observed in a wide range of galaxies, but specifically in large ellipticals (e.g., Strom & Strom (1979); McNamara & O’Connell (1992); Holtzman et al. (1996); Sparks et al. (1997)). The star-forming regions in A2597 show similar characteristics: intense star formation near the galaxy core, with smaller, more isolated blue clusters further out. The primary objection to transporting gas-rich galaxies into the cluster core is that ram-pressure stripping by the hot ICM removes much of the relatively diffuse H I gas (Gunn & Gott (1972); Nulsen (1982)). However, dense clouds of molecular gas and dust have much lower filling factors and higher column densities than the H I component and are less affected by hydrodynamical processes (Kritsuk (1983); Valluri & Jog (1990)). Indeed, studies of the molecular content of galaxies in clusters show no significant dependence on location in the cluster, whereas the H I content decreases substantially toward the cluster core (Kenney & Young (1989); Casoli et al. (1991); Lavezzi & Dickey (1998)). Therefore such an interaction can quite plausibly provide a fresh supply of gas, predominantly molecular. The stellar model ages of yr are also typical of the dynamical timescales involved in such interactions.
Thus, we propose that two plausible triggering mechanisms for the star formation are: (1) related directly to the passage of the radio source, or (2) related to accretion of a gas-rich companion galaxy. If the star formation is modeled in terms of a single burst then the resulting ages are in the range yr — the low end of this range is comparable to the lower limit on the radio source age, thus we associate the single-burst models with triggering by the radio source. If, on the other hand, the star formation is modeled using a constant SFR, then the required ages of the stars are much higher, of order a few times yr. This is too high to be accounted for in terms of radio source triggering, but is consistent with the dynamical timescales typically required for interactions between galaxies. While our current data do not allow us to distinguish further between these two possible triggering mechanisms, we are able to conclude that triggering by the radio source is consistent with a single burst yr ago, while triggering by an interaction corresponds to continuous, on-going star formation over longer timescales up to yr.
6.2 AGN Trigger Mechanism, Fuel Supply, and Origin of the Gas Filaments
Having discussed the star formation trigger mechanism, we now investigate the trigger for the AGN itself. The majority of cD ellipticals in cooling flow clusters are known to host radio-loud sources, compared to a much lower fraction of cD’s in non cooling flow clusters Burns (1990). A number of studies have discussed cooling flows as the primary explanation for the observed nuclear activity and star formation, through accretion of the cooling filaments into the central galaxy (e.g., Cowie et al. (1983); Canizares et al. (1987), Fabian & Crawford (1990)). However, cooling flows need not be the sole mechanism responsible for triggering and fueling the AGN — in particular, the long timescales of a steady cooling flow cannot be reconciled with the comparatively short radio source lifetimes without invoking additional mechanisms to trigger the onset of the radio source. Furthermore, many AGN with similar properties are found in host galaxies not associated with cooling flow clusters.
Thus we are motivated to discuss the plausibility of an additional mechanism which is generally associated with AGN triggering and fueling, namely interactions between galaxies (e.g., Balick & Heckman (1982); Barnes & Hernquist (1992), and references therein). Specifically, “minor mergers” between the host galaxy and a small gas-rich companion are an important means of dumping fuel into the central region (Hernquist & Mihos (1995); Walker et al. (1996); De Robertis et al. (1998)). In such cases the host galaxy retains its original morphology more or less intact, with the primary change consisting of a fresh supply of of stars, gas and dust.
The central elliptical in A2597 displays a number of features characteristic of a recent “minor merger”: (1) substantial dust which appears dynamically unsettled, located predominantly on one side of the nucleus; (2) the extended complex of neutral, ionized and molecular gas, showing strong asymmetries on small scales (the present work) and large scales Heckman et al. (1989); (3) a radio source with an age yr; (4) small galaxies nearby, which if dynamically associated with the cD would have supplied the gas; (5) the clusters of young stars. The high-pressure cluster environment associated with a cooling flow can enhance the star formation to the observed levels and confine the radio source. However, the actual triggering mechanism of the star formation and AGN is plausibly accounted for by this type of interaction, likely with a galaxy containing substantial amounts of molecular gas as discussed in the previous section. When such a galaxy interacts with the central elliptical, some of its surviving molecular material would be disrupted and become visible as atomic/ionized gas, while the remainder is accreted into the core of the cD.
In this scenario one expects comparatively little reddening in the diffuse line-emitting filaments, due to the relatively short sputtering times of dust in the high-pressure surrounding hot gas Draine & Salpeter (1979); any remaining dust is concentrated in regions containing substantial amounts of dense molecular gas. Indeed, we find that the strongest extinction in A2597 is concentrated in the compact, dusty regions immediately adjacent to the nucleus, located in the same vicinity as the molecular H2 emission detected by ?). It is therefore plausible that the observed distribution and physical properties of the dust and gas in A2597 can be accounted for by the capture of an infalling gas-rich galaxy which has retained a significant fraction of its original dense clouds of molecular gas and dust. This would also provide a supply of fuel for the current phase of activity of the AGN. The age of the radio source is somewhat younger than the timescale associated with the interaction, but this likely represents the additional time required to funnel gas into the center of the galaxy, which in numerical simulations typically occurs well into the merger process; alternatively the currently observed radio source may be only the latest in a series of multiple outbursts during the galaxy interaction process. Finally, the location of this object in the center of a dense, high-pressure ICM would account for the enhanced star formation, as well as the apparent strong confinement of the radio source.
7 Summary and Final Comments
In this paper we have presented HST WFPC2 images that spatially resolve some of the most intriguing features of the cD elliptical in A2597:
-
1.
A complex system of emission-line filaments occupies the inner few kpc of the galaxy, displaying a number of close spatial associations with the synchrotron-emitting radio lobes. The morphologies of several of the filaments are strongly suggestive of direct interactions between the radio source and ambient gas. In particular, we find that the detailed physical properties of the line-emitting gas around the northern radio lobe can be described in terms of a shell of neutral and ionized gas that surrounds the expanding radio lobe, and we show that the energetics of this shell can be readily accounted for by energy input from the expanding radio lobe. We also resolve a knot of high surface-brightness line emission approximately co-incident with a radio hotspot to the south-west of the nucleus, and we show that its properties are consistent with those of a dense, inhomogeneous clump of gas ( cm-3, ) sufficiently massive to deflect the radio jet over the lifetime of the radio source and account for the severely disrupted morphology of the southern radio lobe. Finally, the lack of detectable line emission in a number of locations around the radio lobes suggests an intrinsically asymmetric distribution of ambient gas about the galaxy.
-
2.
The excess blue continuum emission is clearly resolved by our HST images into a number of components, specifically an intense band of blue emission associated with the base of the northern radio lobe, as well as blue clusters south-west from the southern radio lobe, and a number of more diffuse regions distributed about the radio lobes. The morphological properties of the blue continuum (together with its low observed polarization, McNamara et al. (1998)) rule out several explanations for its origin, including optical synchrotron or inverse Compton emission, or scattered nuclear light, leaving recent star-forming regions as the most likely remaining possibility. Comparing our photometry with stellar population synthesis models shows that these regions can be modeled either as single-burst populations with ages of several times yr, or as continuous (constant) star formation with ages about an order of magnitude higher, depending upon details of the assumed metallicity and IMF parameters.
-
3.
The strong dust obscuration in the central region is resolved into a number of large clumps, each several hundred pc in size. Most of these are distributed in a region extending away from the nucleus toward the south-east, while another strong clump of obscuration is evident immediately to the north of the nucleus, and some less heavily absorbed regions are present just west of the bright radio / emission-line hotspot in the south. A striking feature of the dust is its strong degree of clumping and highly asymmetric spatial distribution about the galaxy center.
The cD elliptical in the cooling flow cluster A2597 is a complex system: it contains a powerful, compact radio source, surrounded by an extensive network of emission-line filaments with significant amounts of dust and prominent regions of recent or on-going star formation. We suggest that the high-pressure environment associated with the cooling flow is crucial to enhancing the star formation rate to the high levels observed. However, while a steady cooling flow can also provide a source of fuel for the star formation and the AGN, its long timescales are difficult to reconcile with the short radio source lifetime, the substantial amounts of dust and molecular gas in the central few kpc, and the highly asymmetric distribution of the gas, dust and young stars without invoking an additional, more recent mechanism to account for these features.
We propose that a recent “minor merger” or interaction in which the cD accreted gas and dust from a smaller gas-rich galaxy provides a plausible mechanism, specifically in terms of triggering the formation of the radio source and introducing large amounts of molecular gas and dust into the cD elliptical. The observed asymmetry of the gas and dust would indicate that the system is still in the process of virialization, i.e., the event took place within the last yr. This dynamical timescale is also compatible with the timescales derived from the stellar models involving continuous star formation with a constant SFR, i.e., a scenario in which the interaction is responsible for inducing on-going star formation. However, if the star formation is described in terms of a single burst then the models imply ages of the order yr, in which case the star formation would more likely have been triggered by the passage of the radio source. The age of the radio source is substantially less than the galaxy interaction timescale, and this either represents the additional time required to funnel gas into the center of the cD, or otherwise indicates that the present phase of radio activity is the latest in a series of multiple outbursts.
The properties of A2597 are directly tied to the general question of the relationship between galaxy interactions, nuclear activity and star formation. If active galaxies in cooling flows such as A2597 are triggered in the same way as AGN unassociated with cooling flows, then the primary reason for the difference in their properties, specifically the compact radio morphology and enhanced star formation, results from being located at the center of a dense, high-pressure ICM. Better understanding the effect of environment upon star formation would be especially desirable in the context of studying objects in a range of environments at low redshifts, as well as investigating the formation of stars and galaxies at early epochs where the environment is likely to play an important, perhaps dominant, role.
References
- Allen (1995) Allen, S. W. 1995, MNRAS, 276, 947
- Balick & Heckman (1982) Balick, B., & Heckman, T. M. 1982, ARA&A, 20, 431
- Barnes & Hernquist (1992) Barnes, J. E., & Hernquist, L. 1992, ARA&A, 30, 705
- Begelman et al. (1984) Begelman, M. C., Blandford, R. D., & Rees, M. J. 1984, Rev. Mod. Phys., 56, 255
- Begelman & Cioffi (1989) Begelman, M. C., & Cioffi, D. F. 1989, ApJ, 345, L21
- Bicknell et al. (1997) Bicknell, G. V., Dopita, M. A., & O’Dea, C. P. 1997, ApJ, 485, 112
- Biretta et al. (1996) Biretta et al. 1996, WFPC2 Instrument Handbook, Version 4.0 (Baltimore: STScI)
- Bruzual & Charlot (1993) Bruzual, A. G., & Charlot, S. 1993, ApJ, 405, 538
- Burns (1990) Burns, J. O. 1990, AJ, 99, 14
- Canizares et al. (1987) Canizares, C. R., Fabbiano, G., & Trinchieri, G. 1987, ApJ, 312, 503
- Carollo et al. (1997) Carollo, C. M., Franx, M., Illingworth, G. D., & Forbes, D. A. 1997, ApJ, 481, 710
- Casoli et al. (1991) Casoli, F., Boisse, P., Combes, F., & Dupraz, C. 1991, A&A, 249, 359
- Charlot & Bruzual (1991) Charlot, S., & Bruzual, A. G. 1991, ApJ, 367, 126
- Charlot & Bruzual (1999) Charlot, S., & Bruzual, A. G. 1999, in preparation
- Cowie & Binney (1977) Cowie, L. L., & Binney, J. 1977, ApJ, 215, 723
- Cowie et al. (1983) Cowie, L. L., Hu, E. M., Jenkins, E. B., & York, D. G. 1983, ApJ, 272, 29
- Crawford & Fabian (1992) Crawford, C. S., & Fabian, A. C. 1992, MNRAS, 259, 265
- Crawford & Fabian (1993) Crawford, C. S., & Fabian, A. C. 1993, MNRAS, 265, 431
- Crawford et al. (1989) Crawford, C. S., Fabian, A. C., Johnstone, R. M., & Arnaud, K. A. 1989, MNRAS, 236, 277
- Daines et al. (1994) Daines, S. J., Fabian, A. C., & Thomas, P. A. 1994, MNRAS, 268, 1060
- Daly (1990) Daly, R. A. 1990, ApJ, 355, 416
- De Robertis et al. (1998) De Robertis, M. M., Yee, H. K. C., & Hayhoe, K. 1998, ApJ, 496, 93
- De Young (1989) De Young, D. S. 1989, ApJ, 342, L59
- De Young (1995) De Young, D. S. 1995, ApJ, 446, 521
- Donahue et al. (1998) Donahue et al. 1998, in preparation
- Dopita & Sutherland (1995) Dopita, M. A., & Sutherland, R. S. 1995, ApJ, 455, 468
- Dopita & Sutherland (1996) Dopita, M. A., & Sutherland, R. S. 1996, ApJS, 102, 161
- Draine & Salpeter (1979) Draine, B. T., & Salpeter, E. E. 1979, ApJ, 231, 77
- Edge et al. (1992) Edge, A. C., Stewart, G. C., & Fabian, A. C. 1992, MNRAS, 258, 177
- Eilek (1982) Eilek, J. A. 1982, ApJ, 254, 472
- Eilek et al. (1984) Eilek, J. A., Burns, J. O., O’Dea, C. P., & Owen, F. N. 1984, ApJ, 278, 37
- Fabian (1994) Fabian, A. C. 1994, ARA&A, 32, 277
- Fabian et al. (1986) Fabian, A. C., Arnaud, K. A., Nulsen, P. E. J., & Mushotzky, R. F. 1986, ApJ, 305, 9
- Fabian & Crawford (1990) Fabian, A. C., & Crawford, C. S. 1990, MNRAS, 247, 439
- Fabian & Nulsen (1977) Fabian, A. C., & Nulsen, P. E. J. 1977, MNRAS, 180, 479
- Forbes et al. (1995) Forbes, D. A., Franx, M., & Illingworth, G. D. 1995, AJ, 109, 1988
- Fruchter & Hook (1997) Fruchter, A. S., & Hook, R. N. 1997, in Applications of Digital Image Processing XX, Proc. SPIE, Vol. 3164, ed. A. Tescher (SPIE), 120, astro-ph/9708242
- Gunn & Gott (1972) Gunn, J. E., & Gott, J. R. 1972, ApJ, 176, 1
- Heckman (1981) Heckman, T. M. 1981, ApJ, 250, L59
- Heckman et al. (1989) Heckman, T. M., Baum, S. A., van Breugel, W. J. M., & McCarthy, P. 1989, ApJ, 338, 48
- Hernquist & Mihos (1995) Hernquist, L., & Mihos, J. C. 1995, ApJ, 448, 41
- Holtzman et al. (1995a) Holtzman, J. A., et al. 1995a, PASP, 107, 156
- Holtzman et al. (1995b) Holtzman, J. A., Burrows, C. J., Casertano, S., Hester, J. J., Trauger, J. T., Watson, A. M., & Worthey, G. 1995b, PASP, 107, 1065
- Holtzman et al. (1996) Holtzman, J. A., et al. 1996, AJ, 112, 416
- Hu et al. (1985) Hu, E. M., Cowie, L. L., & Wang, Z. 1985, ApJS, 59, 447
- Jedrzejewski (1987) Jedrzejewski, R. I. 1987, MNRAS, 226, 747
- Johnstone et al. (1987) Johnstone, R. M., Fabian, A. C., & Nulsen, P. E. J. 1987, MNRAS, 224, 75
- Kenney & Young (1989) Kenney, J. D. P., & Young, J. S. 1989, ApJ, 344, 171
- Koekemoer (1996) Koekemoer, A. M. 1996, Ph.D. thesis, Australian National University
- Koekemoer & Bicknell (1998) Koekemoer, A. M., & Bicknell, G. V. 1998, ApJ, 497, 662
- Krist & Hook (1997) Krist, J., & Hook, R. 1997, The Tiny Tim User’s Guide, Version 4.4 (Baltimore: STScI)
- Kritsuk (1983) Kritsuk, A. G. 1983, Astrofizika, 19, 471
- Lavezzi & Dickey (1998) Lavezzi, T. E., & Dickey, J. M. 1998, AJ, 115, 405
- McNamara (1997) McNamara, B. R. 1997, in Galactic and Cluster Cooling Flows, ed. N. Soker (San Francisco: ASP Press), 109
- McNamara & Jaffe (1994) McNamara, B. R., & Jaffe, W. 1994, A&A, 281, 673
- McNamara & O’Connell (1989) McNamara, B. R., & O’Connell, R. W. 1989, AJ, 98, 2018
- McNamara & O’Connell (1992) McNamara, B. R., & O’Connell, R. W. 1992, ApJ, 393, 579
- McNamara & O’Connell (1993) McNamara, B. R., & O’Connell, R. W. 1993, AJ, 105, 417
- McNamara et al. (1998) McNamara et al. 1998, in preparation
- Mihos & Hernquist (1994a) Mihos, J. C., & Hernquist, L. 1994a, ApJ, 425, L13
- Mihos & Hernquist (1994b) Mihos, J. C., & Hernquist, L. 1994b, ApJ, 437, 611
- Mihos & Hernquist (1996) Mihos, J. C., & Hernquist, L. 1996, ApJ, 464, 641
- Nieto et al. (1992) Nieto, J.-L., Bender, R., Poulain, P., & Surma, P. 1992, A&A, 257, 97
- Nulsen (1982) Nulsen, P. E. J. 1982, MNRAS, 198, 1007
- O’Connell & McNamara (1989) O’Connell, R. W., & McNamara, B. R. 1989, AJ, 98, 180
- O’Dea et al. (1994) O’Dea, C. P., Baum, S. A., & Gallimore, J. F. 1994, ApJ, 436, 669
- Owen et al. (1995) Owen, F. N., Ledlow, M. J., & Keel, W. C. 1995, AJ, 109, 14
- Owen et al. (1992) Owen, F. N., White, R. A., & Burns, J. O. 1992, ApJS, 80, 501
- Rees (1989) Rees, M. J. 1989, MNRAS, 239, 1P
- Romanishin (1987) Romanishin, W. 1987, ApJ, 323, L113
- Romanishin & Hintzen (1988) Romanishin, W., & Hintzen, P. 1988, ApJ, 324, L17
- Salpeter (1955) Salpeter, E. E. 1955, ApJ, 121, 161
- Sarazin (1986) Sarazin, C. L. 1986, Rev. Mod. Phys., 58, 1
- Sarazin et al. (1995) Sarazin, C. L., Burns, J. O., Roettiger, K., & McNamara, B. R. 1995, ApJ, 447, 559
- Sarazin & McNamara (1997) Sarazin, C. L., & McNamara, B. R. 1997, ApJ, 480, 203
- Scalo (1986) Scalo, J. M. 1986, Fundam. Cosmic Phys., 11, 1
- Smith & Heckman (1989) Smith, R. M., & Heckman, T. M. 1989, ApJ, 341, 658
- Sparks et al. (1997) Sparks, W. B., Carollo, C. M., & Macchetto, F. 1997, ApJ, 486, 253
- Strom & Strom (1979) Strom, S. E., & Strom, K. M. 1979, AJ, 84, 1091
- Sutherland et al. (1993) Sutherland, R. S., Bicknell, G. V., & Dopita, M. A. 1993, ApJ, 414, 510
- Taylor et al. (1999) Taylor, G. B., O’Dea, C. P., Peck, A. B., & Koekemoer, A. M. 1999, ApJ, 512, L27
- Thomas & Fabian (1990) Thomas, P. A., & Fabian, A. C. 1990, MNRAS, 246, 156
- Toomre & Toomre (1972) Toomre, A., & Toomre, J. 1972, ApJ, 178, 623
- Valluri & Jog (1990) Valluri, M., & Jog, C. J. 1990, ApJ, 357, 367
- Voit & Donahue (1997) Voit, G. M., & Donahue, M. 1997, ApJ, 486, 242
- Walker et al. (1996) Walker, I. R., Mihos, J. C., & Hernquist, L. 1996, ApJ, 460, 121
- Weil & Hernquist (1993) Weil, M. L., & Hernquist, L. 1993, ApJ, 405, 142