Abstract
Masses of galaxies are beginning to be measured systematically at redshifts . Such data provide powerful and unique links and clues to theories, simulations, and our understanding of early galaxy formation and evolution. Discriminating masses of different kinds (e.g., dark matter, old stars, HI gas) remains difficult, but a wide variety of techniques for measuring total dynamical masses are being explored and found practical. I highlight three recent optical studies of dynamical masses: 1) the emission line velocity widths of blue galaxies and rotation curves of spirals that trace evolution in the Tully-Fisher relation to ; 2) the absorption line velocity dispersions of early type galaxies in the field and clusters to track evolution in the Fundamental Plane to ; and 3) the kinematics of high redshift () Lyman-drop galaxies to constrain their nature, descendents, and progenitors. The next decade shows promise of an explosive growth in this infant field of measuring masses, especially in having much larger sample sizes, higher precision and S/N, improved techniques and tools, and probes of more diverse kinds of mass.
DYNAMICS OF DISTANT NORMAL GALAXIES
1 UCO/Lick Observatory, Department of
Astronomy and Astrophysics,
University of California, Santa Cruz, CA,
USA.
1 Introduction
For over 20 years since the pioneering surveys of cluster galaxies by Butcher and Oemler [7] and field galaxies by Peterson et al. [29], observations of distant normal galaxies have continually been intensified to probe their formation and evolution. Such explorations started with only photometric data in the form of number counts and colors, as well as clustering statistics and photometric redshifts. Spectroscopic redshifts and other low spectral resolution information, such as star formation rates from [OII] line strengths or age indices from the HK 4000 Å break, soon followed. Even more recently, studies have progressed to include morphologies, sizes, and structures from HST images. The reader is referred to the contribution in this volume by Hammer for an up-to-date overview of the global properties of galaxy evolution.
In the last several years, a new and very powerful dimension has been added to the suite of tools to explore distant galaxies, namely internal kinematics and dynamics (masses). Although the potential was discussed over a decade earlier by Kron [18], only recently have advances in instrumentation and access to larger telescopes allow such programs to be practical.
1.1 Varieties of Mass
Mass is a term whose exact meaning is often unspecified and dependent upon the user and context. Confusion arises because mass, especially in its baryonic forms, come in many varieties. Dark matter, e.g., can be hot or cold, while gas, stars, dust, planets, and black holes can be further divided depending on its location (bulge, disk, halo), time (young or old) or redshift (high or low), color (blue or red) or temperature (hot or cold), different elements or state (e.g., HI, HII, H2, CO, gas, hot or warm dust), etc.
The importance of securing mass measurements for the study of distant galaxy evolution appears obvious. After all, total or dynamical mass is a fundamental physical property of galaxies. And, given that star formation remains a poorly understood physical process, mass possesses much closer and more direct ties to our current theories and simulations of galaxy formation than that from luminosity. Moreover, dynamical mass provides a new, very rich dimension to explore galaxy formation and evolution that is in principle independent of luminosity variations; that is conserved in isolated volumes; and which is likely to be related to the bias in the clustering behavior of galaxies. Mass can be measured for individual galaxies, to yield, e.g., M/L; to assess whether an object is a bursting dwarf; to estimate the fraction of dark matter; or to determine the relative proportions of stars and gas. Due to the diversity of galaxy types and properties, however, masses for statistically complete samples are more likely to reveal convincing, unique, and well characterized evidence for evolution. Such samples are essential to yield, e.g., the evolution in the volume density of galaxies with different velocity widths or M/L, or the clustering amplitude of galaxies as a function of mass or M/L.
Yet, despite their importance and potential, mass measurements for distant galaxies have been sparse. In part this lack of data is due to the greater difficulty in making such observations as compared to redshifts alone. Also, many astronomers have the common perception that mass and light are so tightly correlated for most local galaxies that additional efforts to obtain mass measurements of faint distant galaxies would be redundant and expensive.
1.2 Techniques to Measure Mass
For certain kinds of mass, the radiation itself is a direct measure. Examples include HI from 21cm flux, old stars from rest-frame near-infrared luminosities, or dust mass from submm if the temperature is well constrained. Indirect measures include HI from CO, total stellar mass from light assuming some average M/L, total stellar mass from star formation rates and assumed lifetimes, or mass of gas from column densities and sky coverage as probed by QSO absorption lines. Instead of the masses of various subcomponents, the total mass (dark or luminous) is almost always also desired. A relatively new technique to measure total mass exploits gravitational lensing, which can be applied to individual galaxies or clusters via strong lensing events; to statistical samples of galaxies via galaxy-galaxy weak lensing; or to the large scale mass power spectrum via global weak lensing patterns.
For the vast bulk of galaxies, total masses are estimated from , which assumes viralization and that the observed internal kinematic velocities () and sizes () are reliable tracers of the gravitational potential structure and depth. The kinematics of each galaxy can be extracted via 1-D, 2-D, or 3-D of information.
In the 1-D case of flux versus wavelength, the integrated spectrum of a galaxy is used to extract the velocity widths of emission lines (as studied for HI gas via 21cm observations or for ionized gas in star forming galaxies via optical spectra) or the velocity dispersions of stellar absorption lines (e.g., as used in the Faber-Jackson or Fundamental Plane relations for elliptical galaxies). In general, 1-D optical data are obtained with a single aperture or individual optical fiber for each galaxy.
In 2-D, the addition of spatial resolution along one axis provides rotation curves. The extra dimension yields qualitatively new types of information, such as the radial change in M/L that can reveal the amount of dark matter; the velocity distortions that might be signatures of mergers; or gradients in the velocity dispersion of disks that may reflect the rate of heating by satellites. Most of these measurements are based on long-slit apertures, usually along the major axis of a galaxy.
In 3-D, the remaining angular spatial dimension is added and provides information on the position angle, inclination, possible asymmetries, etc. in the kinematics of a galaxy [2]. The most common optical instruments to extract such 3-D data for distant galaxies include integral field units with bundles of optical fibers, Fabry-Perot systems, and ramped narrow-band filter systems.
2 Overview of Kinematic Studies of Distant Galaxies
Given the difficulty of securing just the redshift, much less any line profile information, distant galaxy spectral surveys of the 1980’s through the early 1990’s relied on relatively low spectral resolution spectrographs, typically with velocity resolutions of 500 to 1000 , which is inadequate for internal kinematic studies of most galaxies. Although 4-m to 6-m class telescopes are able to yield kinematics for brighter galaxies at intermediate redshifts, the vast bulk of distant galaxy kinematic observations has come from the Keck 10-m Telescopes that started operating in 1994. The following subsections highlight the major scientific results from these pioneering efforts.
2.1 Emission Line Kinematics
Unless distant galaxies produce significant gas motions unrelated to their mass or their emission line spatial distribution is unrepresentative of the underlying structure, the widths of emission lines from their integrated spectra should provide a good diagnostic of their gravitational potential. Motivated by three factors: 1) the relatively good resolution of the Low Resolution Imaging Spectrograph (LRIS [28]) of less than 100 ; 2) the availability of high spatial resolution images from the Hubble Space Telescope to derive inclination angles and sizes of galaxies; and 3) the desire to test a number of claims for dramatic evolution of moderate redshift field galaxies, the Deep Extragalactic Evolutionary Probe (DEEP: see URL: http://www.ucolick,.org/∼deep/home.html) team initiated a number of pilot surveys of internal kinematics [17]. One early LRIS survey included 18 apparent spirals brighter than . They were found to have redshifts 0.2 to 0.8 and integrated velocity widths that yielded M/L ratios only about one magnitude brighter than that of local spirals [9]. Due to LRIS being down at the last moment of a scheduled run, another DEEP survey used the only available instrument, the High Resolution Spectrograph (HIRES: [39]) with a velocity resolution of less than 10 on Keck, to observe a sample of 17 very blue, very luminous () compact galaxies with to 23 and redshifts to 0.7 [15]. The surprisingly small velocity dispersions of 30 to 60 for most of these galaxies, along with their small sizes, suggested that they were similar to HII galaxies and perhaps the progenitors of luminous spheroidal galaxies seen locally [11][13]. Similar results were found for a sample of 6 very strong emission-line galaxies in cluster Cl 0024+1654 at [16]. Further LRIS observations of even fainter () compact galaxies found in the flanking fields of the Hubble Deep Field showed that such galaxies are likely to be significant contributors to the star formation rate at high redshifts and that the galaxies with high specific star formation rates (per mass) may be shifting to higher masses at higher redshifts [30][12].
In the meantime, two other groups pushed the limits of 4-m class telescopes with instruments that yielded velocity resolutions of about 50 . One group used the AUTOFIB fiber-optics spectrograph on the AAT to explore the kinematics of 24 blue galaxies with at redshifts [32]. The other group used the Subarcsec Imaging Spectrograph (SIS: [19]) on the CFHT to examine 24 others with and with [26]. Both groups claimed detection of 1 mag to 2 mag of luminosity brightening compared to local counterparts. As previously found [12], the evidence for evolution was particularly strong among compact galaxies [26]. These surveys reveal that the masses of otherwise similarly luminous galaxies (typically near ) span from genuine dwarfs with to bonafide giants with well over . The poor correlation of mass with luminosity found for some, albeit very blue, galaxies justifies the clear need for internal kinematics measurements in the study of distant galaxy evolution.
Finally, we note that even the internal kinematics of the important, but very faint ( 24 to 26 mag), population of Lyman-drop galaxies 111Lyman-drop is preferred over the more popular term of Lyman-break galaxies, since the Ly forest also contributes to the shape of the spectrum. has been studied via velocity widths of their emission lines. A major issue is whether the masses of these galaxies are large, as inferred from theory and their observed strong clustering properties [35], or are low if they are instead star-bursting pre-merger components, starbursting subcomponents within larger-mass halos, or progenitors of genuine dwarf galaxies [24] [36]. The spectral evidence is meager but favors small masses, with emission line widths of generally less than from Ly as measured in the optical [24] or from the more reliable and [OIII] lines that were obtained in the near-infrared [31].
2.2 Absorption Line Velocity Dispersions
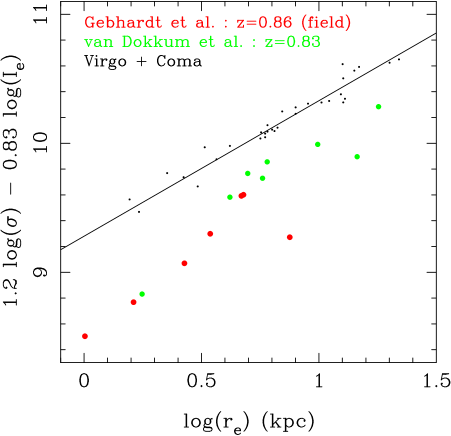
These measures are considerably more difficult than the widths of strong emission lines, due to the need to have high S/N in the continuum. Thus far, absorption line widths have mainly been measured in distant, luminous early-type galaxies. This challenging work typically requires the use of 8-10m class telescopes, moderately good spectral resolution, and a corresponding set of stellar templates for cross-correlations. The handful of studies compare the M/L ratio and Fundamental Plane of distant versus local E/S0 for rich clusters of galaxies [37][38][14][43] and field galaxies [10]. The results are reassuringly consistent, with any changes being a good match to just mild passive luminosity evolution, which predict mag of brightening by redshifts 0.85 (see Fig. 1).
2.3 Spatially Resolved Kinematics
These observations require both good spectral resolution and moderately high spatial resolution in the spectra, as well as information on inclination and position angle of the major axis for each galaxy. Simulations are generally needed to derive such parameters as the terminal velocity, by accounting for seeing, slit width, optical PSF, inclination, etc.
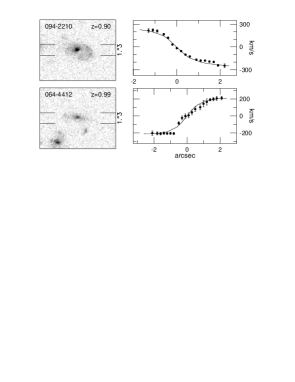
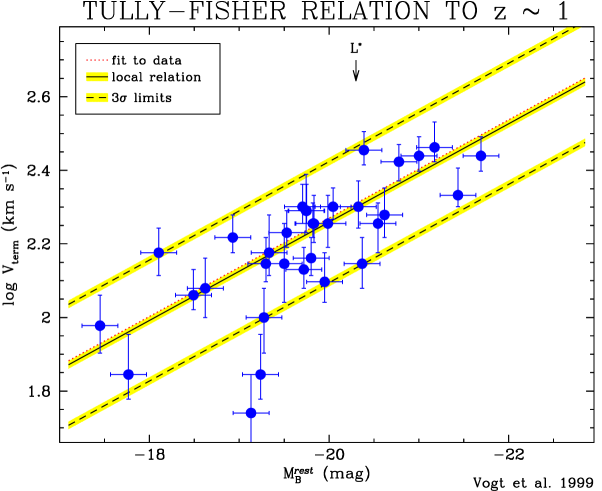
At the lower redshift regime, 4-m to 5-m class programs have already yielded interesting, but apparently inconsistent, results. In one case, the claim is that 40 high-quality rotation curves of spirals with redshifts to 0.4 show no evidence for evolution in the Tully-Fisher relationship between luminosity and velocities after corrections are made for the colors of the galaxies [2] [3] [4] [5]. Another group studied a sample of 22 strong [OII] emitting galaxies with and with the SIS and Multi Object Spectrograph (MOS: [19]) on CFHT [33]. They find nearly 2 mag of luminosity brightening when compared to local samples. At yet higher redshifts to , the Keck Telescope with LRIS has yielded over 30 decent rotation curves for galaxies that appear to be relatively large spirals in HST images [40] [41] [42] (see Fig. 2 for examples). As seen in Fig. 3, there is little, if any, offset ( mag) between this high-redshift sample and that of local Tully-Fisher samples. This result is particularly interesting for two reasons. First, at least some theories predict quite rapid disk evolution [27], while these observations, along with the evidence for little change in the volume density of large disk galaxies [21], appear to suggest otherwise. Second, the stark contrast of the spiral results to the evidence for much stronger evolution among compact galaxies (subsection 2.1) is suggestive of an important, missing component in our understanding of galaxy evolution.
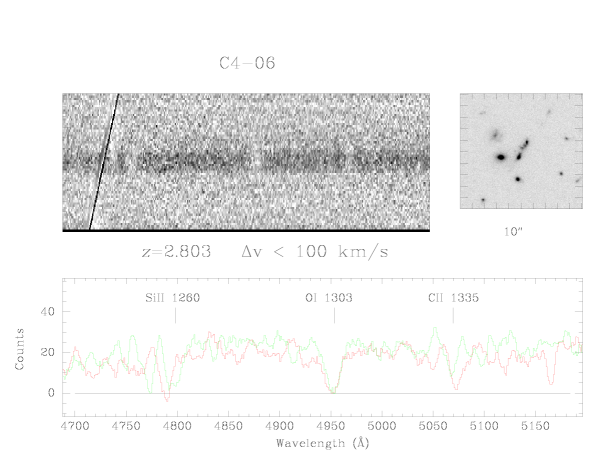
Although Lyman-drop galaxies are generally too small (0.2′′) to yield rotation curves with present ground-based systems, some appear to have multiple or extended components, which then allow spatially resolved kinematics to be gathered. So far, results exist only for two galaxies, with one consistent with a very low mass of less than 10 (see Fig. 4), while the other has a more typical mass of 3 10 for luminous galaxies [25]. Given the unknown inclination of the plane of their relative motions and their true sizes or separations, more data are clearly needed to obtain the needed statistics to assess whether Lyman-drop galaxies are generally large or small mass systems.
3 Future Prospects
The aforementioned pioneering surveys clearly demonstrate the feasibility of acquiring kinematics and dynamics of high redshift galaxies. The resultant scientific conclusions, even if currently tentative and based on limited samples, highlight the potential to extract critical and unique clues to their nature and evolution. The whole field of observing the dynamics of distant galaxies is still in its infancy and will soon experience an explosive growth.
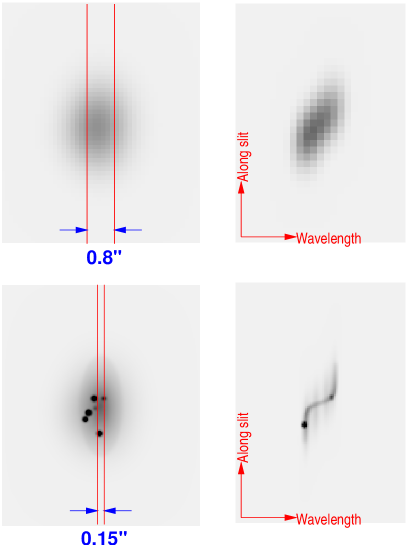
Over the next decade, we will see the completion of several major redshift surveys with high enough spectral resolution to yield internal kinematics. These include the Sloan Digital Sky Survey (SDSS:[23]), which will firmly set the foundation for the local internal kinematic properties of diverse galaxy types; the next phase of DEEP, which will aim for about 50,000 galaxies at [8]; and the VIRMOS survey on the VLT [20], which will access not only the optical but also the near-IR that reaches the rest-frame optical for redshifts beyond . In principle, such kinematic surveys can be used to estimate the masses of galaxies on larger scales than actually observed in the luminous portions of galaxies, by measuring the distribution of relative velocities of galaxy pairs at different separations. More direct measures of dynamical mass on larger scales are likely to come from weak lensing surveys, several of which are already underway; some will take advantage of photometric redshifts to vastly improve the S/N by discriminating between foreground and background sources. Moreover, adaptive optics (see Fig. 5) along with NGST will yield detailed kinematics of very high redshift and even the most compact galaxies. Finally, planned enhancements to submm, mm, and radio telescopes should provide direct measures of the amount and motions of various forms of gas in distant galaxies (a recent example at uses 21cm in absorption [6]).
The science from these large samples of mass measurements for distant galaxies will be revolutionary. Galaxy formation, e.g., will be observed as a physical process involving the hierarchical buildup of mass, rather than the current popular trend of concentrating on galaxy formation as reflected by the star formation rate (SFR), i.e. just the conversion of gas into stars. One diagnostic to explore this merging process includes the evolution of the comoving volume density function (EOCVDF) of mass or velocity; another is to combine the information with luminosity to measure the EOCVDF(M/L). With the advent of high spatial resolution spectroscopy that enables separation of the structure and kinematics of galaxy subcomponents, the EOCVDF(disk mass, M/L, scale-length) or EOCVDF(bulge mass, M/L, size) will be dramatic enhancements to current studies of the Tully-Fisher and Fundamental Plane relations. Adding other dimensions of information such as SFR, chemical abundances, and stellar ages will only add richness and depth to the forthcoming revolution in distant galaxy studies. As emphasized in the introduction, mass comes in diverse forms, so the previous discussion applies also for dark matter, halo, HI, etc. as new telescopes and tools allow discrimination among them.
This revolution will extend even to cosmology. Large-scale structure and bias, e.g., will be characterized and discriminated by mass (mass power spectrum) instead of light. Independent tests of the global geometry can be undertaken by using the Fundamental Plane of ellipticals [1] or via the classical volume tests [22]. The latter is feasible through the EOCVD of quantitities that are expected to be conserved, such as the total baryonic mass (obtained by combining results from X-ray to radio) or the total mass (from gravitational lensing).
Acknowledgements. DEEP was initiated by the Berkeley Center for Particle Astrophysics (CfPA) and has been supported by various NSF, NASA, and STScI grants over the years, including NSF AST-9529098 and STScI AR-07532.01-96. K. Gebhardt, N. Vogt, A. C. Phillips, and J. Lowenthal are especially thanked for providing the figures. I also thank V. Rubin and R. Kron for their encouragement to me in the early 1980’s to explore the dynamics of distant galaxies.
References
- [1] Bender, R., et al. 1998, Astrophys. J. 493, 529
- [2] Bershady, M. A. 1997, PASP Conf. 117, 537
- [3] Bershady, M. A. 1998, PASP Conf. eds D. R. Merrit, M. Valluri, J. A. Sellwood, in press
- [4] Bershady, M. A., Andersen, D., Ramsey, L., Horner, S. 1998, PASP Conf. 152, 253
- [5] Bershady, M. A. 1998, Astro-ph/9812020
- [6] Briggs, F. H., Brinks, E., Wolfe, A. M. 1997, Astron. J. 113, 467
- [7] Butcher, H., Oemler, A. 1978, Astrophys. J. 219, 18
- [8] Davis, M., Faber, S. M. 1998, in Wide Field Surveys in Cosmology p. 333, eds S. Colombi, Y. Mellier, B. Raban: Editions Frontieres
- [9] Forbes, D. A., Phillips, A. C., Koo, D. C., Illingworth, G. D. 1996, Astrophys. J. 462, 89
- [10] Gebhardt, K., et al. 1999, Astrophys. J. , in preparation
- [11] Guzman, R., et al. 1996, Astrophys. J. 460, L5
- [12] Guzman, R., et al. 1997, Astrophys. J. 489, 559
- [13] Guzman, R., et al. 1998, Astrophys. J. 495, L13
- [14] Kelson, D. D., et al. 1997, Astrophys. J. 478, L13
- [15] Koo, D. C., et al. 1995, Astrophys. J. 440, L49
- [16] Koo, D. C., Guzman, R., Gallego, J., Wirth, G. D. 1997, Astrophys. J. 478, L49
- [17] Koo, D. C. 1998, in Wide Field Surveys in Cosmology p. 161, eds S. Colombi, Y. Mellier, B. Raban: Editions Frontieres
- [18] Kron, R. G. 1987, in Nearly Normal Galaxies: From the Planck Time to the Present p. 300, ed S. M. Faber: Springer-Verlag
- [19] Le Fevre, O., et al. 1994, Astr. Astrophys. 282, 325
- [20] Le Fevre, O., et al. 1998, in Wide Field Surveys in Cosmology p. 327, eds S. Colombi, Y. Mellier, B. Raban: Editions Frontieres
- [21] Lilly, S. J., et al. 1998, Astrophys. J. 500, 75
- [22] Loh, E. D. 1988, Astrophys. J. 329, 24
- [23] Loveday, J., Pier, J. 1998, in Wide Field Surveys in Cosmology p. 317, eds S. Colombi, Y. Mellier, B. Raban: Editions Frontieres
- [24] Lowenthal, J. D. et al. 1997, Astrophys. J. 481, 673
- [25] Lowenthal, J. D., Simard, L., Koo, D. C. 1998, PASP Conf. 146, 110
- [26] Mallen-Ornelas, G., Lilly, S. J., Crampton, D., Schade, D. 1999, Astro-ph/9904187
- [27] Mo, H. J., Mao, S., White, S. D. M. 1998, MNRAS 295, 319
- [28] Oke, B., et al. 1995, PASP 107, 375
- [29] Peterson, B. A., Ellis, R. S., Kibblewhite, E. J., Bridgeland, M. T., Hooley, T., Horne, D. 1979, Astrophys. J. 233, L109
- [30] Phillips, A. C., et al. 1997, Astrophys. J. 489, 543
- [31] Pettini, M., et al. 1998, Astrophys. J. 508, 539
- [32] Rix, H.-W., Guhathakurta, P., Colless, M., Ing, K. 1997, MNRAS 285, 779
- [33] Simard, L., Pritchet, C. 1998, Astrophys. J. 505, 96
- [34] Steidel, C. C., et al. 1996, Astrophys. J. 462, L17
- [35] Steidel, C. C., et al. 1998, Astrophys. J. 492, 428
- [36] Somerville, R. S., Primack, J., Faber, S. M. 1999, MNRAS , submitted
- [37] Van Dokkum, P. G., Franx, M. 1996, MNRAS 281, 985
- [38] Van Dokkum, P. G., Franx, M., Kelson, D.. D., Illingworth, G. D. 1998, Astrophys. J. 504, L17
- [39] Vogt, S. et al. 1994, Proc. Soc. Photo-Optical Inst. Eng., 2198, 362
- [40] Vogt, N. P. et al. 1996, Astrophys. J. 465, L15
- [41] Vogt, N. P. et al. 1997, ApJ, 479, L121
- [42] Vogt, N. P. et al. 1999, Astrophys. J. , in preparation
- [43] Ziegler, B. L, Bender, R. 1997, MNRAS 291, 527