Cross-correlation of the unresolved X-ray background with faint galaxies
Abstract
At the faint end of the deepest X-ray surveys, a population of X-ray luminous galaxies is seen. In this paper, we present the results of a cross-correlation between the residual, unresolved X-ray photons in a very deep X-ray survey and the positions of faint galaxies, in order to examine the importance of these objects at even fainter flux levels. We measure a significant correlation on all angular scales up to 1 arcmin. This signal could account for a significant fraction of the unresolved X-ray background, approximately 35 per cent if the clustering is similar to optically selected galaxies. However, the angular form of the correlation is seen to be qualitatively similar to that expected for clusters of galaxies and the X-ray emission could be associated with hot gas in clusters or with QSOs within galaxy clusters rather than emission from individual faint galaxies. The relative contribution from each of these possibilities cannot be determined with the current data.
keywords:
X-rays: general – X-rays: galaxies – diffuse radiation – galaxies: clusters: general – galaxies: active1 Introduction
The nature of the sources and emission mechanisms that contribute to the cosmic X-ray background (XRB) remains one of the major questions in astrophysics. Deep surveys, particularly with the Rosat satellite, have resolved a significant fraction (50 per cent) of the XRB, with optical identification of the sources enabling classification of much of the emission (eg , ), but a number of important questions still remain. From current surveys, it is seen that at least 30 per cent of the X-ray background can be attributed to broad-line QSOs, but the steep X-ray spectra of QSOs does not match the shallow spectrum of the residual XRB. Therefore, a population of faint X-ray sources with flatter spectra is required to make up much of the remainder of the XRB.
At the faint end of the deepest surveys just such a population is emerging with increasing numbers of X-ray luminous galaxies with narrow optical emission lines (NELGs) (, ). However, current surveys are only just beginning to see significant numbers of such objects at their faintest limits and so the significance of these new objects to the XRB as a whole is highly uncertain.
One can get deeper than the resolution limit of surveys by looking at the correlation between the unresolved regions of a deep X-ray survey and the positions of a population of putative X-ray sources, in this case galaxies. [Roche et al. 1995] use such a cross-correlation method to show that faint galaxies are a significant contributor to the unresolved flux in three deep Rosat PSPC observations (two of 25 ksec, and one of 50 ksec). After the removal of resolved sources, they find a highly significant detection (5) in a correlation between the X-ray photons (0.5 – 2.0 keV) and the positions of 18B23 mag galaxies. In [Roche et al. 1996] they repeat the calculation using a slightly deeper X-ray observation (74 ksec). In their analysis, they apply the formalism of [Treyer and Lahav 1996] to model the clustering and evolution of the population of X-ray sources, in an attempt to correct for contamination to the cross-correlation signal due to clustering of the sources. Although a significant signal is again seen, the uncertainties in the assumptions required by the method mean that they are unable to draw any firm quantitative conclusion about the contribution to the XRB from faint galaxies. Nevertheless, an extrapolation of their results to high redshifts implies that 30–50 per cent of the total 0.7–2.0 keV X-ray background might be due to emission from faint galaxies.
Another analysis by [Almaini et al. 1997] using three PSPC observations (each of 50 ksec) also shows a significant signal. They again apply the formalism of [Treyer and Lahav 1996], with modifications to compensate for the point spread function of the PSPC, and an extrapolation to high redshift gives a contribution to the XRB from faint galaxies of 40 10 per cent. However, they note that this estimate has a strong dependence on the assumed evolution, distribution and clustering properties of the galaxies.
On a wider scale, but with shallower observations, [Sołtan et al. 1997] correlate the positions of galaxies with the Rosat All-Sky Survey [Snowden & Schmitt 1990] and find a similar signal to [Roche et al. 1996] and [Almaini et al. 1997].
In this paper we correlate the positions of faint galaxies with a very deep PSPC X-ray observation (115 ksec). In this observation, a significant fraction of the resolved X-ray background photons are directly associated with galaxies (the NELGs – see ). Therefore, not only will a cross-correlation analysis enable us to probe further into the unresolved XRB than previous studies, but it will provide a test of whether the contribution to the XRB from galaxies extends to significantly fainter fluxes than the limits of shallower surveys or whether they contribute only over a relatively narrow range in flux. This will give us a clearer idea of the nature of the contribution of NELG-like objects to the XRB.
In section 2 we describe the X-ray and optical data used in this study and give details of the cross-correlation method employed. We also highlight some of the problems associated with attaching a significance to the results and describe the simulations we have used to determine accurate error estimates. In section 3 we present the results of applying the cross-correlation using galaxies from a selection of magnitude ranges. The possible implications of these results are discussed in section 4 and we present our conclusions in section 5.
2 Data and analysis
The X-ray data used in this analysis come from the UK Rosat Deep Survey described in detail in [McHardy et al. 1998] and [Branduardi-Raymont et al. 1994]. The data consist of a total of 115 ksec of Rosat position sensitive proportional counter (PSPC) observations of RA Dec (J2000), a region of sky selected because of its extremely low obscuration — . Only the inner 15 arcmin radius of the PSPC field of view is used in this study, where sources have been detected and, in many cases, optically identified down to a flux limit of (0.5-2 keV – all fluxes in this paper will refer to this band), resolving approximately 50 per cent of the cosmic X-ray background (XRB).
In this analysis, we wish to study the unresolved component, so these sources must be “masked out”. Because of the large range of brightnesses in the survey (up to ), and the variation of the PSPC point spread function over the image, a fixed mask size is inappropriate. We therefore use a gaussian approximation to the PSPC point spread function from [Hasinger et al. 1993] to select a mask radius for each source that leaves a residual of 0.1 photons, assuming that it is a point source. For an on-axis source at the detection limit, this gives a mask radius of 29 arcsec and excludes 99.5 per cent of the source photons.
The galaxy identifications are taken from deep R-band CCD imaging of the survey region, using the University of Hawaii 8K8K CCD array [Metzger, Luppino and Miyazaki 1995] on CFHT with a 1 hour exposure, giving galaxies to R24.5. Objects were found using the PISA software provided by Starlink. Galaxies were separated from stars using the ratio between the aperture magnitude of each object to its peak count in any one pixel. Stellar objects have an approximately constant ratio with the more diffuse galaxies forming a distinct population. Plots of peak counts against magnitude can, therefore, be used to separate galaxies from stars as in figure 1.

Regions of the image contaminated by bright stars are excluded. The total area of overlap between residual (ie unmasked) XRB and useful R-band image is 0.052 degree2, approximately 26 per cent of the 15 arcmin radius region of the Deep Survey image. For this study, we use galaxies with 18R23. At fainter levels, the separation between point-like and extended objects becomes uncertain (see figure 1), and at brighter levels, the number density of galaxies becomes small and field-to-field fluctuations would dominate any conclusions about the XRB as a whole. In total, the overlap region contains 1451 galaxies within this magnitude range.
The cross-correlation method is similar to that of [Roche et al. 1995]. The number of X-ray photons per pixel (2 arcsec square) in a series of annuli from to around each galaxy is obtained and the number expected from a random distribution normalised to the mean intensity of the masked image is subtracted. The contribution from all the galaxies is then averaged:
| (1) |
where is the X-ray photon/galaxy cross-correlation signal for aperture (in photons galaxy-1 arcsec-2), is the number of galaxies in the overlap region, is the number of X-ray photons within the aperture around a particular galaxy, is the number of pixels in the aperture, is the average number of X-ray photons per pixel and is the area of the aperture in arcseconds.
It should be noted that for larger annuli, the area of the X-ray image covered, and hence the number of galaxies that contribute to the cross-correlation, is slightly larger than the values given above.
2.1 Error estimation
[Roche et al. 1995] estimate errors on using a bootstrap technique, but this does not take into account the problems associated with spurious apparent correlations produced by the auto-correlation functions of the distribution of unmasked X-ray photons and the regions excluded on the R-band CCD image. We have, therefore, performed a series of Monte Carlo simulations to estimate the significance of our results.
Two sets of simulations were performed, both using the actual, masked distribution of X-ray photons, but randomising the distribution of galaxies in different ways. In both cases those regions of the CCD image excluded were matched to the actual data.
For the first set of simulations, galaxy positions were chosen entirely at random until the observed number of galaxies were obtained. However, although these simulations will include the effects of the CCD selection, and X-ray source masking and photon auto-correlation, they will not include any effect from the galaxy-galaxy angular correlation function. In order to estimate whether this effect is significant, we performed a further series of simulations. In these, instead of entirely random galaxy positions, we divided the actual galaxy distribution into a set of 5466 arcsec “boxes” and shuffled these boxes around at random.
A comparison of these two methods is shown in figure 2. There is no significant difference between the two, indicating that the effect of the galaxy-galaxy correlation function on these scales is negligible. For the rest of the paper, we will only consider the results from the first set of Monte Carlos (ie those with entirely random galaxy positions).

3 Results

The cross-correlation signal seen for all galaxies with 18R23 is given in figure 3 together with the mean and 1- scatter of the Monte Carlo simulations. There is a significant correlation above that expected from a random distribution of galaxies out to a radius of 1 arcmin.
We can estimate the fraction of the unresolved XRB in this field associated with galaxies by taking a 1 arcmin radius aperture around each galaxy and summing up the total number of X-ray photons detected in each aperture above that expected from a random distribution. The random expectation in each aperture will be affected by the masking of both the X-ray and optical images and so was determined from a set of simulated PSPC images. Once an initial estimate of the contribution was determined, the process was repeated but this time the simulated X-ray images were created with a corresponding fraction of the X-rays associated with galaxies. This process was iterated until convergence was reached. The scatter in the counts for the final simulations was then used to estimate an error on the contribution to the residual XRB. We find that 67 9 per cent of the unresolved XRB photons are associated with galaxies.
However, this result does not take into account any clustering of galaxies on scales up to 1 arcmin. If such clustering is present, this photon excess will be an over-estimate since each galaxy will produce a correlation with the X-ray emission of its clustered companions. We can approximately correct for this, following the procedure of [Roche et al. 1995], by dividing the excess number of galaxy-photon pairs by where is the excess number of galaxy-galaxy pairs with separation less than 1 arcmin and is the total number of galaxies. Applying this correction reduces our result to 35 5 per cent of the unresolved XRB associated with galaxies (where the error is only from the scatter in the simulations). However, it is important to realise that this is only very approximate and, in particular, is based on the average galaxy-galaxy correlation. If X-ray emission is preferentially associated (or disassociated) with clustered regions, this correction will be an under- (over-) estimate. We will return to this question later.
As discussed by [Roche et al. 1995], there are two further effects which may lead to overestimation of the contribution: (i) X-ray emission from galaxies with R23 clustered with the R23 galaxies and (ii) correlation from galaxies clustered with X-ray emitting QSOs. Both of these effects are very difficult to quantify. An R23 galaxy just below the detection limit of the survey () would have an X-ray to R-band luminosity ratio of 0.8, which is consistent with the NELGs resolved in the survey which have . However, the numbers of such objects, and the extent to which they cluster with brighter galaxies is not known. [Roche et al. 1996] and [Almaini et al. 1997] attempt to account for (i) and the clustering of observed galaxies using a formalism developed by [Treyer and Lahav 1996]. However, this method, which models the evolution and clustering of the X-ray sources, is sensitive to a number of assumptions. In particular, it is assumed that the galaxies are all drawn from a single population of X-ray sources with for all galaxies at all redshifts. However, here we would expect our catalogue of galaxies to contain a combination of “normal” galaxies (]), NELGs (]) and clusters of galaxies (]) (eg and ). In addition, variations in the models for the clustering and evolution of the galaxies can add large uncertainties to the formalism [Almaini et al. 1997].
It has been seen (eg ) that galaxy clustering around X-ray selected AGN is similar to that of galaxy-galaxy clustering and the X-ray emissivity estimated by [Roche et al. 1995] from their correlation is larger than that found for the local AGN emissivity [Miyaji, Lahav, Jahoda and Boldt 1994], and so they choose to neglect possible contamination from AGN associated with clustered galaxies. However, from these arguments alone, it is not possible to exclude a significant fraction of the observed correlation being due to this effect, particularly since the emissivity must be calculated assuming that the effect is negligible.
We have, therefore, repeated the correlation analysis with the galaxies divided into “bright” ( — 686 galaxies) and “faint” ( — 765 galaxies) populations thereby probing different redshift distributions.


The results are shown in figures 4 and 5 for “bright” and “faint” galaxies respectively. The angular distribution of the correlation signal is clearly very different in the two cases with the correlation from the fainter galaxies being dominated by annuli of 10 arcsec, and the brighter galaxies contributing on larger angular scales. We will return to this in section 4. It is important to realise that these two measurements, although based on distinct populations of galaxies, are not independent. Clearly, any contribution from clusters of galaxies and galaxies associated with QSOs will affect both correlations and the “bright” correlation will contain a signal from clustering around X-ray emitting galaxies with R22.
4 Discussion
We can get some idea of the possible contribution to the correlation from QSOs by extrapolating the distribution of identified sources in the Deep Survey below the flux limit. Using fits to the source counts as a function of flux given in [McHardy et al. 1998] we find that a simple extrapolation would resolve the entire XRB at a flux of . Extrapolating the QSO fit down to this limit gives an additional contribution to the unresolved XRB of 6 per cent. However, the fit is not well constrained and extrapolating the 1- upper confidence limit to the fit gives 37 per cent. Obviously, extrapolation of a simple linear fit over such a large flux range is somewhat unreliable, but given the increasing significance of NELGs at fainter fluxes in identified surveys, it is clear that broad-lined QSOs are not likely to be the sole, or maybe not even dominant contributor to the unresolved XRB. Of course, this does not rule out an AGN-like origin for the X-rays since any X-ray galaxies contributing to the correlation signal could be low-luminosity or obscured AGN.
Nevertheless, the angular distribution of the “bright” and “faint” correlation signals may indicate a clustered environment for a large fraction of the X-ray emitting objects. We can exclude the possibility that the correlation at larger angles is due to the correlation with residual photons in the wings of the “masked” sources since this should account for less than 1 per cent of the residual XRB photons. However, a handful of the known X-ray objects are identified with small clusters of galaxies [McHardy et al. 1998] and these will be slightly extended. We therefore repeated the correlation using larger masks around each source (sufficient to mask out all but 0.01 photons from a point source) but observed no significant difference in the correlation.
4.1 The angular form of the cross-correlation
The angular form of the cross-correlation signals that we see will depend on both the point spread function (PSF) of the PSPC instrument (see figure 6) and the angular correlation between galaxies and X-ray sources (whether galaxies themselves, QSOs or emission from hot gas in galaxy clusters).

Unfortunately, we cannot measure this angular correlation since we do not know which are the X-ray sources. However, we can measure the overall galaxy-galaxy correlation () for the different magnitude ranges as shown in figure 7.

These results show a qualitatively similar form to those of the X-ray/galaxy cross-correlations (figures 3 to 5) but here, the peak is at small radii is for the “bright” galaxies, with a broader distribution for the “faint” galaxies. Clearly, the correlation between galaxies and X-ray sources can only be crudely approximated by the overall galaxy-galaxy correlation.
However, the angular form of the X-ray/galaxy correlation signal that we see is not well described by correlation with unclustered galaxies. This can be seen from simulations where a given fraction of the residual XRB is associated with randomly distributed galaxies. We have created a number of these simulations for a range of XRB contributions. The distribution of fluxes of X-ray sources is taken from an extrapolation of the source counts in [McHardy et al. 1998] and sufficient of these sources are associated with randomly distributed galaxies to produce a known fraction of the residual XRB. X-ray sources with fluxes above the limit of the Deep Survey data () are masked out in the same way as the real data and the CCD masking and edge-effects are reproduced.
Results for two typical simulations are given in figure 8.
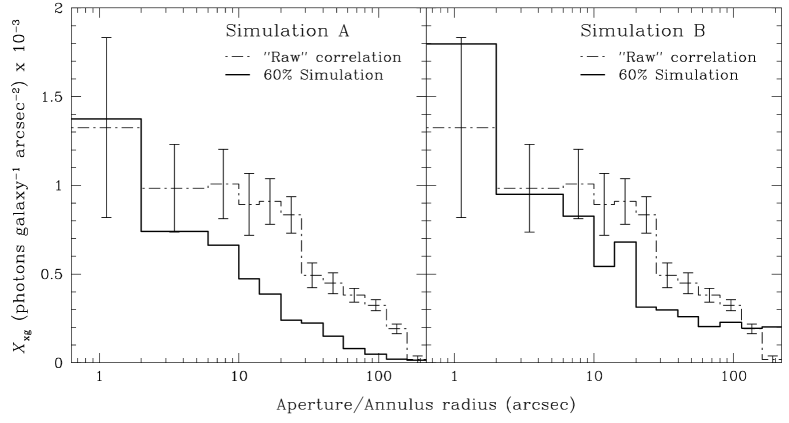
In both cases, 60 per cent of the unresolved XRB was associated with galaxies (approximately matching the uncorrected value calculated in section 3). Although the variation between simulations is large, in all cases the simulation is more “peaked” than the observed correlation — ie it has a higher fraction of its correlation in small apertures. To quantify this, we define the statistic
| (2) |
where is the sum of the apertures with radii . For the observed correlation we find whereas for 50 simulations, with an imposed residual XRB contribution from galaxies of 60 per cent, we find where the error is the 1- scatter of the simulations. Clustering, therefore, clearly plays a role in the angular form of the signal that we see.
4.1.1 X-ray emission from clusters of galaxies
One obvious possibility for some of the X-ray/galaxy cross-correlation signal is emission from the hot gas in the intra-cluster medium of galaxy clusters or groups. If we assume that the X-ray emission from such a cluster at a moderate redshift (eg ) is well approximated by a point source in the PSPC, we would expect the form of the cross correlation in a series of annuli of inner and outer radii and respectively, , to be approximately described by:
| (3) |
where is the number of galaxies expected from the cluster in the annulus between and , is the Abell radius and is the flux expected in an annulus around a point source in the PSPC. The two denominators are normalising terms which remove the dependence on the Abell richness and X-ray flux.
The observed galaxy density distribution of clusters is well described by a King model [Sarazin 1986]:
| (4) |
where is the projected density of galaxies at radius in Mpc, is the central density of galaxies and is the core radius of the cluster in Mpc. We adopt a value Mpc [Bahcall 1975]. Evaluating eqn. 3 for the on-axis PSPC point spread function for clusters at a range of redshifts (H0=50) we obtain the results in figure 9.

The form of is largely independent of redshift and is very similar to that seen for the “bright” galaxy/X-ray correlation (figure 4). This may indicate that a significant fraction of this correlation signal is due to X-ray emission from within clusters or groups of galaxies. The same signal is not seen for the “faint” galaxy/X-ray correlation. This may be due to a dilution of the signal from foreground and background galaxies at these magnitudes. However, we would not necessarily expect to see the same distribution for the “faint” sample since, although there is no strong dependence on redshift, the King model given in equation 4 is a good approximation only for the distribution of cluster galaxies with magnitudes where is the third ranked cluster member. However, the “faint” sample covers a range of only 1 magnitude, and so the King model is not applicable.
5 Conclusions
A significant correlation signal is seen between the distribution of photons in the unresolved XRB and the positions of faint galaxies. However, it is impossible to reliably determine the source of the X-rays, with NELGs, hot intra-cluster gas and QSOs within clusters all likely candidates. The angular form of the correlation signal for the brighter galaxies is very similar to that expected for emission from clusters over a range of redshifts, but the same signal would clearly be seen for QSOs or NELGs at the centres of clusters. Nevertheless, the increasing importance of NELG sources at the fainter end of optically identified X-ray surveys and the extrapolation of the observed QSO source counts to fainter fluxes both imply that a significant fraction of the signal should come from sources other than QSOs.
Comparison with simulations indicates that the correlation signal is enhanced by clustering of galaxies. Although the angular form of this signal is consistent with emission from the hot gas in moderately distant clusters of galaxies, the angular scales are comparable to that of the point spread function of the instrument, so no firm conclusions can be drawn. Also, from the current data, we cannot distinguish between X-ray emission from an intra-cluster medium and emission from individual X-ray objects associated with clustered environments. It is also important to remember that these results are drawn from a single X-ray observation. Although the magnitude of the observed signal is comparible to that of other, less-deep observations (eg ), the angular form of the signal is different.
However, it is clear from these results that the unresolved XRB beyond the resolution limit of the faintest X-ray surveys has a significant contribution from faint X-ray galaxies.
References
- [Almaini et al. 1997] Almaini, O., et al., 1997, MNRAS, 291, 372.
- [Bahcall 1975] Bahcall, N.A., 1975, Ap. J., 198, 249.
- [Boyle et al. 1995] Boyle, B.J, McMahon, R.G., Wilkes, B.J., Elvis, M., 1995, MNRAS, 276, 315.
- [Branduardi-Raymont et al. 1994] Branduardi-Raymont, G., et al., 1994, MNRAS, 270, 947.
- [Hasinger et al. 1993] Hasinger, G., et al., 1993, MPE/OGIP Calibration Memo CAL/ROS/93-015.
- [McHardy et al. 1998] McHardy, I.M. et al., 1998, MNRAS, 295, 641.
- [Metzger, Luppino and Miyazaki 1995] Metzger, M.R., Luppino, G.A., Miyazaki, S., 1995, BAAS, 187, 73.
- [Miyaji, Lahav, Jahoda and Boldt 1994] Miyaji, T., Lahav, O., Jahoda, K., Boldt, K., 1994, Ap. J., 434, 424.
- [Roche et al. 1995] Roche, N., Shanks, T., Georgantopoulos, I., Stewart, G.C., Boyle, B.J., Griffiths, R.E., 1995, MNRAS, 273, L15.
- [Roche et al. 1996] Roche, N., Griffiths, R.E., Della Ceca, R., Shanks, T., Boyle, B.J., Georgantopoulos, I., Stewart, G.C., 1996, MNRAS, 282, 820.
- [Sarazin 1986] Sarazin, C.L., 1986, Rev. Mod Phys., 58, 1.
- [Schmidt et al. 1998] Schmidt, M., Hasinger, G., Gunn, J., Schneider, D., Burg, R., Giaconni, R., Lehmann, I., Mackenty, J., Trumper, J., Zamorani, G., 1998, A&A, 329, 495.
- [Smith, Boyle and Maddox 1995] Smith, R.J., Boyle, B.J., Maddox, S.J., 1995, MNRAS, 277, 270.
- [Snowden & Schmitt 1990] Snowden, S., Schmitt, S.C.M.M., 1990, Ap&SS, 171, 207.
- [Sołtan et al. 1997] Sołtan, A.M., Hasinger, G., Egger, R., Snowden, S., Trümper, J., 1997, A&A, 320, 705.
- [Stocke et al. 1991] Stocke, J.T., Morris, S.L., Gioia, I.M., Maccacaro, T., Schild, R., Wolter, A., Fleming, T.A., Henry, J.P., 1991, ApJS, 76, 813.
- [Treyer and Lahav 1996] Treyer, M.A., Lahav, O., 1996, MNRAS, 280, 469.