Hour-Scale Multiwavelength Variability in Markarian 421
M. Catanese1, I.H. Bond2, S.M. Bradbury2, A.C. Breslin3,
J.H. Buckley4, A.M. Burdett2,5, D.A. Carter-Lewis1,
M.F. Cawley6, S. Dunlea3, M. D’Vali2,
D.J. Fegan3, S.J. Fegan5, J.P. Finley7, J.A. Gaidos7,
T.A. Hall7, A.M. Hillas2, D. Horan3, J. Knapp2,
F. Krennrich1, S. Le Bohec1, R.W. Lessard7, C. Masterson3,
P. Moriarty8, J. Quinn3, H.J. Rose2, F.W. Samuelson1,
G.H. Sembroski7, V.V. Vassiliev5, T.C. Weekes5,
L. Maraschi9, G. Fossati10, F. Tavecchio9, L. Chiappetti11,
A. Celotti10, G. Ghisellini9, P. Grandi12, E. Pian13,
G. Tagliaferri9, A. Treves14
1Department of Physics and Astronomy, Iowa State University, Ames, IA 50011, USA
2Department of Physics, Leeds University, Leeds, LS2 9JT, UK
3Experimental Physics Department, University College, Belfield, Dublin 4, Ireland
4Department of Physics, Washington University, St. Louis, MO 63130, USA
5Fred Lawrence Whipple Observatory, Harvard-Smithsonian CfA, Amado, AZ 85645, USA
6Physics Department, St. Patrick’s College, Maynooth, County Kildare,
Ireland
7Department of Physics, Purdue University, West Lafayette, IN 47907, USA
8Department of Physical Sciences, Galway-Mayo IT, Ireland
9Osservatorio Astronomico di Brera, Milano, Italy
10SISSA/ISAS, Trieste, Italy
11IFC/CNR, Milano, Italy
12IAS/CNA, Roma, Italy
13TESRE/CNR, Bologna, Italy
14Universita dell’Insubria, Como, Italy
Abstract
Markarian 421 was observed for about four days with BeppoSAX and the Whipple Observatory -ray telescope in April 1998. A pronounced, well-defined, flare with hour-scale variability was observed simultaneously in X-rays and very high energy -rays. These data provide the first evidence that the X-ray and TeV intensities are well correlated on time-scales of hours. While the rise of the flare occurred on a similar time-scale in the two wavebands, the decay of the flare was much more rapid in -rays, providing the first clear indication that the X-ray and -ray emission may not be completely correlated in Markarian 421.
1 Introduction:
Blazars are a class of active galactic nuclei whose emission is believed to arise predominantly from a relativistic jet whose axis makes a small angle with our line of sight. More than 60 blazars have been detected with the Energetic Gamma-Ray Experiment (EGRET) (Hartman et al. 1999). A few BL Lacertae objects (BL Lacs), a sub-class of blazars, have also been detected as TeV -ray emitters (Ong 1998). No model for the origin of the -ray emission is generally accepted at this time. Two popular classes are those in which high energy electrons produce the -rays by inverse Compton scattering of low energy photons (e.g., Maraschi, Ghisellini & Celotti 1992; Dermer, Schlickeiser & Mastichiadis 1992; Sikora, Begelman & Rees 1994) and those in which high energy protons produce -rays by initiating cascades in the jets (e.g., Mannheim 1993). Contemporaneous observations at several wavelengths can be used to derive physical conditions in and around the blazar jet and may resolve which emission mechanism operates in the objects.
Markarian 421 (Mrk 421) is the closest known BL Lac () and is an established very high energy (VHE, E250 GeV) -ray source (e.g., Punch et al. 1992; Petry et al. 1996). Mrk 421 is also an EGRET source (Hartman et al. 1999). The VHE emission from Mrk 421 is extremely variable, showing flaring activity on time scales as short as 15 minutes (Gaidos et al. 1996) with little or no baseline level emission (Buckley et al. 1996). The spectrum of Mrk 421 is consistent with a power law that extends to at least 10 TeV with no evidence of a sharp cut-off, and no evidence of variability (e.g., Krennrich et al. 1999a,b). Multiwavelength campaigns on Mrk 421 (e.g., Buckley et al. 1996) have revealed correlations between X-rays and VHE -rays and evidence for correlated optical/UV variability. The flux amplitude of the X-ray and VHE -ray variations was similar and the variability time profiles were the same, on day-scales. These rapid, correlated variations have permitted stringent limits to be placed on the Doppler factor and magnetic fields of the Mrk 421 jet (e.g., Buckley et al. 1996) and these data have become important tests for emission models (e.g., Mannheim 1998; Buckley 1998; Tavecchio, Maraschi & Ghisellini 1998).
Despite the successes of these campaigns, the light curves were not densely sampled, so the multiwavelength variability could not be measured on time-scales less than one day. In order to better measure the flaring behavior of Mrk 421, several more intense multiwavelength campaigns were conducted in 1998 using longer exposures in X-rays and VHE -rays, and combining the data from several VHE -ray telescopes. Here, we present the results of a campaign in 1998 April with BeppoSAX and the Whipple -ray telescope.
2 Observations:
2.1 BeppoSAX:
The scientific payload carried by BeppoSAX is fully described in Boella et al. (1997a). The data of interest here derive from three coaligned instruments, the Low Energy Concentrator Spectrometer (LECS, 0.1-10 keV, Parmar et al. 1997), the Medium Energy Concentrator Spectrometer (MECS, 2-10 keV, Boella et al. 1997b) and the Phoswich Detector System (PDS, 12-300 keV, Frontera et al. 1997).
The observations with BeppoSAX reported here consist of two exposures lasting approximately 100 kiloseconds each. The data reduction for the PDS was done using the XAS software (Chiappetti & Dal Fiume 1997), while for the LECS and MECS linearized cleaned event files generated at the BeppoSAX Science Data Centre (SDC) were used. No appreciable difference was found extracting the MECS data with the XAS software. Light curves were accumulated from each instrument with the usual choices for extraction radius and background subtraction as described in Chiappetti et al. (1999).
2.2 Whipple:
The VHE -ray observations were made with the Whipple Observatory 10 m telescope (Cawley et al. 1990). At the time of these observations, the telescope camera consisted of 331 photomultiplier tubes with a combined field of view of 4.8∘. Also, light-cones were not in place and this, as well as reduced reflectivity of the mirrors, resulted in a somewhat higher energy threshold than usual for the telescope, 500 GeV. Events were parameterized with a standard moment analysis and candidate -rays were selected using a variation of the Supercuts analysis (Reynolds et al. 1993) appropriate for the large camera field of view and for maintaining a constant energy threshold as a function of observation elevation (see Table 1 and discussion below).
| Observation zenith angle | ||||
| Parameter | 35∘ | 40∘ | 45∘ | 55∘ |
| length | , | , | , | , |
| width | , | , | , | , |
| distance | , | , | , | , |
| asymmetry | ||||
| length/size | /d.c.b | |||
| max2 | d.c. | d.c. | d.c. | d.c. |
| sizec | d.c. | d.c. | d.c. | d.c. |
| Effective area ratiod | 1.0 | 1.5 | 2.6 | 4.7 |
| a1 d.c. = 1 digital count. | ||||
| bSize cut required for energy threshold of 2 TeV. | ||||
| cRatio is relative to the effective area at a zenith angle of 20∘. | ||||
Observations were taken on the nights of 1998 April 21, 22, 23 and 24. To permit longer observations within each night, data were taken over a large range of zenith angles (7∘ to 60∘). The collection area and energy threshold increase with zenith angle and the -ray selection is a function of zenith angle, so the observed -ray rates can change as a function of elevation even from a source of constant -ray emission. To obtain a light-curve which shows only the intrinsic source variations, it was necessary to determine software cuts which result in a constant energy threshold as a function of elevation and to calculate collection areas as a function of elevation for those energy thresholds in order to normalize the -ray rates. Because contemporaneous observations of the Crab Nebula were not available with sufficient statistics over all the zenith angles, the analysis presented here relies entirely on Monte Carlo shower simulations.
Simulated -ray induced showers at zenith angles of 20∘, 40∘, 45∘, and 55∘ were generated with ISUSIM (Mohanty et al. 1998) to determine the size cut required at each zenith angle to obtain a common energy threshold of 2 TeV and to estimate the collection areas at these zenith angles for the 2 TeV energy threshold. To normalize the 2 TeV rate measurements at the different elevations we multiply them by the ratio of effective collection area at a given zenith angle to the effective collection area at a zenith angle of 20∘. The software trigger threshold applied at each zenith angle to set the energy threshold at 2 TeV and the ratio of effective areas for the four zenith angle ranges are shown in Table 1. The results reported here are based on limited statistics and are therefore preliminary. The aim of this analysis is to derive normalized fluxes as a function of time rather than absolute fluxes and energy spectra.
3 Results:
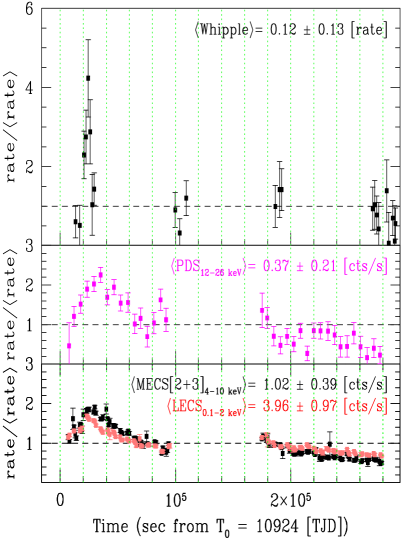
The light curves for the -ray and X-ray observations are shown in Figure 1. Three X-ray energy bands are shown and the -ray light curve shows the normalized E2 TeV data for the measurements. Each -ray point represents a 28 minute observation. The count rates for the measurements are normalized to their respective averages for these observations. The rise and fall of a large amplitude flare is clearly evident in all data sets on the first day of observations. Observations after the first day did have detectable fluxes, but showed no significant variability on day or shorter time-scales. For the observations on April 21, the amplitude of the X-ray flaring increases with increasing energy, but it is close to a factor of 2 in all three bands. The 2 TeV light curve shows a 4-fold variation in flux. The flux in the 0.1-2 keV, 4-10 keV, and 2 TeV energy bands peaks at approximately the same time (within one-half of one hour), but the decay time for the TeV light curve is significantly shorter than that of the LECS and MECS light curves. The 12-26 keV light curve measured by the PDS instrument appears to peak slightly later than the others, but the statistical uncertainty in the data precludes a definitive measurement. A detailed investigation of possible leads or lags in the data is underway. The TeV spectrum does not change significantly during the rapid flare, nor is it significantly different than previous measurements (Krennrich et al. 1999b).
4 Discussion and Conclusions:
These observations show, for the first time, that the TeV and keV fluxes from Mrk 421 are correlated on hour time scales while at the same time indicate that the -rays and X-rays are not completely correlated. Neither the larger variability amplitude at TeV energies than at X-rays nor the difference in the variability time scales have been seen previously. The reason for the difference in the decay time-scale of the flare at TeV and keV energies is not clear. The differences could reflect the nature of the flaring mechanism. For example, a variation in the electron spectrum and the energy density of the low energy photons up-scattered to TeV energies (Maraschi et al. 1999) might produce such a flare. The differences may also indicate that the particles which produce the X-rays are not the same as the particles which produce the TeV -rays. This is possible in models where the progenitor particles are electrons or protons. In addition, the region of the broadband spectrum of Mrk 421 observed by BeppoSAX spans the end of the synchrotron emission and the onset of the high energy emission (c.f., Buckley et al. 1996). As such, the X-ray emission may reflect contributions from more than one population of source particles, regardless of the emission mechanism. Detailed model fitting of this data, which is beyond the scope of this paper, is necessary to investigate these possibilities.
References
Boella, G., et al. 1997a, A&AS, 122, 299
Boella, G., et al. 1997b, A&AS, 122, 327
Buckley, J.H., et al. 1996, ApJ, 472, L9
Buckley, J.H. 1998, Science, 279, 676
Cawley, M.F., et al. 1990, Exp. Astron., 1, 173
Chiappetti, L., & Dal Fiume, D. 1996, in Proc. of the 5th Workshop
“Data Analysis in Astronomy” (Erice), ed. V. Di Gesú, et al., 101
Chiappetti, L., et al. 1999, ApJ, in press
Dermer, C.D., Schlickeiser, R., & Mastichiadis, A. 1992, A&A, 256, L27
Frontera, F., et al. 1997, A&AS, 122, 357
Gaidos, J.A., et al. 1996, Nature, 383, 319
Hartman, R.C., et al. 1999, ApJS, in press
Krennrich, F., et al. 1999b, Proc. 26th ICRC (Salt Lake City), OG 2.1.02
Mannheim, K. 1993, A&A, 269, 67
Mannheim, K. 1998, Science, 279, 684
Maraschi, L., Ghisellini, G., & Celotti, A. 1992, ApJ, 397, L5
Maraschi, L., et al. 1999, in TeV Astrophysics of Extragalactic Sources,
ed. M. Catanese & T.C. Weekes, Astrop. Phys., in press
Mohanty, G., et al. 1998, Astrop. Phys., 9, 15
Ong, R.A. 1998, Phys. Reports, 305, 93
Parmar, A.N., et al. 1997, A&AS, 122, 309
Petry, D., et al. 1996, A&A, 311, L13
Punch, M., et al. 1992, Nature, 358, 477
Reynolds, P.T., et al. 1993, ApJ, 404, 206
Sikora, M., Begelman, M.C., & Rees, M.J. 1994, ApJ, 421, 153
Tavecchio, F., Maraschi, L., & Ghisellini, G. 1998, ApJ, 509, 608