The nature of SN 1997D: low-mass progenitor and weak explosion ††thanks: All the SN 1997D spectra used in this paper were kindly provided by Massimo Turrato
Abstract
We analyzed the spectra and light curve of the peculiar type II-P supernova 1997D to recover ejecta parameters. The optimal hydrodynamical model of SN 1997D, which meets observational constraints at the photospheric epoch, suggests a low explosion energy of about erg, ejecta mass around , and presupernova radius near . We confirm the previous result by Turatto et al. (tmy98 (1998)) that the ejecta contain a very low amount of radioactive 56Ni (). Modelling the nebular spectrum supports the hydrodynamical model and permits us to estimate the mass of freshly synthesized oxygen (0.02–0.07 ). Combined with the basic results of stellar evolution theory the obtained parameters of SN 1997D imply that the progenitor was a star from the 8–12 mass range at the main sequence. The fact that at least some progenitors from this mass range give rise to core-collapse supernovae with a low kinetic energy ( erg) and low amount of radioactive 56Ni () has no precedent and imposes important constraints on the explosion mechanism. We speculate that the galactic supernovae 1054 and 1181 could be attributed to SN 1997D-like events.
Key Words.:
supernovae: general – supernovae: individual: SN 1997D – interstellar medium: supernova remnants1 Introduction
The Type II supernova (SN) 1997D discovered on Jan. 14.15 UT (De Mello & Benetti db97 (1997)) is a unique event characterized by extremely low expansion velocity, low luminosity, and very low amount () of radioactive 56Ni (Turatto et al. tmy98 (1998)). An analysis of the observational data led Turatto et al. (tmy98 (1998)) to conclude that they caught SN 1997D around day 50 after it had exploded as a red supergiant with the mass of 26 and radius of . The derived ejecta mass is and kinetic energy is erg. They propose a scenario in which the low 56Ni mass in SN 1997D is caused by a fall-back of material onto the collapsed remnant of the explosion of a 25–40 star. An exciting implication is that SN 1997D might be accompanied by black hole formation (Zampieri et al. zsc98 (1998)).
Here we present arguments for an alternative view on the origin of SN 1997D, which in our opinion was a descendant from the low end of the mass range of core-collapse supernova (CCSN) progenitors. The problem we attempted to solve first was to find the hydrodynamical model, which could reproduce the light curve, the velocity at the photosphere, and the line profiles of major strong lines (Section 2). We emphasize the importance of the line profile analysis, since it provides a robust information on the velocity at the photosphere. The latter is a crucial parameter for constraining hydrodynamical models. Unexpectedly for us it turned out that Rayleigh scattering in SN 1997D is significant and may be used as a powerful diagnostic tool. The emphatic role of Rayleigh scattering in this case is related to the low energy-to-mass ratio () of SN 1997D (Turatto et al. tmy98 (1998)), which results in the higher than normal density at the photospheric epoch for SN II-P. A combination of hydrodynamical modelling and robust analysis of spectra at the photospheric epoch permitted us to impose tight constraints on , , and of SN 1997D.
In addition, we analyzed nebular spectra of SN 1997D using a nebular model (Section 3). To make such an analysis as secure as possible we first checked the model taking advantage of the well studied SN 1987A at a similar epoch. We found modelling the nebular spectrum of SN 1997D beneficial in discriminating between low and high-mass options for the ejecta. To our knowledge the present paper is a first attempt of a SN II-P study to simultaneously make use of all data: light curve, photospheric and nebular spectra. Some implications of the low mass and kinetic energy of the SN 1997D ejecta for the systematics of CCSN, explosion mechanism, and galactic population of supernova remnants (SNR) are discussed in the final section. Below we adopt for SN 1997D the dust extinction mag and the distance 13.43 Mpc following Turatto et al. (tmy98 (1998)).

2 Photospheric epoch
2.1 The velocity at photosphere
According to general results of hydrodynamical simulations of SNe II-P the radiation cooling of the expanding envelope at the plateau phase proceeds in a specific regime of the cooling recombination wave (Grassberg et al. gin71 (1971)). As a result the photosphere in SN II-P resides at the well defined jump between the almost completely recombined (ionization degree ) transparent atmosphere and the fully ionized sub-photospheric layers of high opacity. The velocity at the photosphere determined from the observed scattering line profiles during photospheric epoch (plateau) thus gives us a position of the cooling recombination wave and therefore is of vital importance for constraining parameters of the hydrodynamical model.
To measure the photospheric velocity in the Jan. 17 spectrum of SN 1997D we concentrated on the 5600–6700 Å band which contains strong, clearly-cut spectral lines (Fig. 1) of H, Na I, Ba II, Fe II, and Sc II. Most of them are well observed in other SNe II-P. However, due to the low expansion velocity it is possible to distinguish here some spectral features never observed before, e.g. Sc II 6605 Å line (Fig. 1). A Monte Carlo technique used for modelling the spectrum (Fig. 1) suggests an absorbing photosphere and a line scattering atmosphere (Schwarzschild-Schuster model). In total 19 lines are included for this spectral range. The Sobolev optical depth was computed assuming the analytical density distribution in the envelope
| (1) |
which corresponds to a plateau at velocities and a steep slope () in the outer layers at . Parameters and are defined by the ejecta mass , kinetic energy , and index . The case shown in Fig. 1 is characterized by , erg, and , although one may easily fit the spectrum using higher mass and higher energy. Since we do not solve the full problem of radiation transfer in ultraviolet we adopt that metals are singly ionized and find level populations assuming appropriate excitation temperature ( K). For the standard abundance we assume here, Sc II 6605 Å line is too strong; therefore its abundance is reduced by a factor of two. It may well be that the odd behavior of Sc II line reflects different excitation conditions for Sc II and other metals rather than abundance pattern. We found that hydrogen excitation has to be cut beyond km s-1 to prevent washing out the 6500 Å peak. Close to the photosphere within the layer km s-1 the net emission in H is comparable to its scattering component. We simulated this emission assuming the line scattering albedo greater than unity.
In spite of its simplicity the model is appropriate for the confident estimate of the photospheric velocity which was found to be km s-1 (Fig. 1) with an uncertainty less than 100 km s-1. The value of km s-1 reported by Turatto et al. (tmy98 (1998)) is consistent with the above estimate. Our choice was a compromise between two possibilities: (1) washing out many observed features in the spectrum if km s-1, and (2) producing significant excess in emission components for Na I D1,2 and Ba II 6142 Å lines if km s-1. The value km s-1, although optimal, still leads to some extra emission in Na I D1,2, Ba II 6142 Å and Fe II 6249 Å lines (Fig. 1). Preliminary analysis indicated that this drawback of the model may be overcome, if Rayleigh scattering on neutral hydrogen is taken into account.
2.2 Rayleigh scattering effects
Rayleigh scattering on neutral hydrogen in the optical dominates over Thomson scattering at an extremely low ionization degree which is the case for SN II-P atmospheres at the photospheric epoch. To get an idea of the role of Rayleigh scattering in the spectrum of SN 1997D we adopt the analytical density profile given by Eq.(1) with a power index . Let us first estimate the Rayleigh optical depth using the cross-section by Gavrila (g67 (1967)) and assuming conditions of the atmosphere of a normal SN II-P (e.g. SN 1987A) for two extreme cases: completely mixed and unmixed envelopes. Assuming for SN 1987A erg, , a helium/metal core mass , and km s-1 at the age d (Woosley w88 (1988); Shygeyama & Nomoto sn90 (1990); Utrobin viu93 (1993)) one gets at the wavelength 6142 Å (Ba II line) a Rayleigh optical depth of 0.07 (mixed) and 0.1 (unmixed).

SN 1997D is essentially different in that respect. Adopting the ejecta model by Turatto et al. (tmy98 (1998)), viz. total mass , helium/metal core mass , km s-1 at the expansion time d (the epoch of Jan. 17) one finds the Rayleigh optical depth in the range 1.3–1.8 at Å, more than one order of magnitude exceeding that in normal SNe II-P. For the model with parameters scaled-down by a factor of four (, helium/metal core mass ), one obtains . Our study showed that such values cannot be ignored in modelling line profiles.
Moreover, to treat Rayleigh scattering in an adequate way one has to abandon the assumption of a fully absorbing photosphere and instead include a diffuse reflection of photons from the photosphere. We describe the diffuse reflection by a plane albedo which is a function of cosine of incident angle and thermalization parameter . Here is the absorption coefficient and is the scattering coefficient. In the approximation of the isotropic scattering the plane albedo reads
| (2) |
where the function is defined by the integral equation (cf. Sobolev s75 (1975))
| (3) |
which was solved numerically to create a table of .
In the absence of Rayleigh scattering, non-zero albedo for slightly (by 4%) increases the intensity of the emission component compared to the purely absorbing photosphere (Fig. 2). The difference obviously becomes larger for smaller thermalization parameter. Rayleigh scattering significantly decreases the emission component due to backscatter and subsequent absorption of photons by the photosphere in the case of and . Another effect of Rayleigh scattering is washing out of the absorption trough by continuum photons drifted from blue to red; this effect is especially pronounced for weak lines and is of minor importance for strong lines. This modelling shows how the emission excess in Na I and Ba II lines (Fig. 1) may be suppressed.
Apart from Rayleigh scattering and diffuse reflection by the photosphere we made two other essential modifications to our Monte Carlo model of line formation. First, we took electron scattering into account. The electron density distribution is recovered from the H line profile using a two-level plus continuum approximation. Second, we calculated the population of three lowest levels of Ba II using the observed flux in the spectrum on Jan. 17. This approximation is fairly good in analyzing the blue side of the absorption trough of the Ba II 6142 Å line. We adopted the standard barium abundance (Grevesse & Sauval gs98 (1998)) and the Ba II fractional ionization . The latter seems to be a good approximation for the outer layers of SN 1987A at the stage when strong Ba II lines are present (Mazzali et al. mlb92 (1992)).

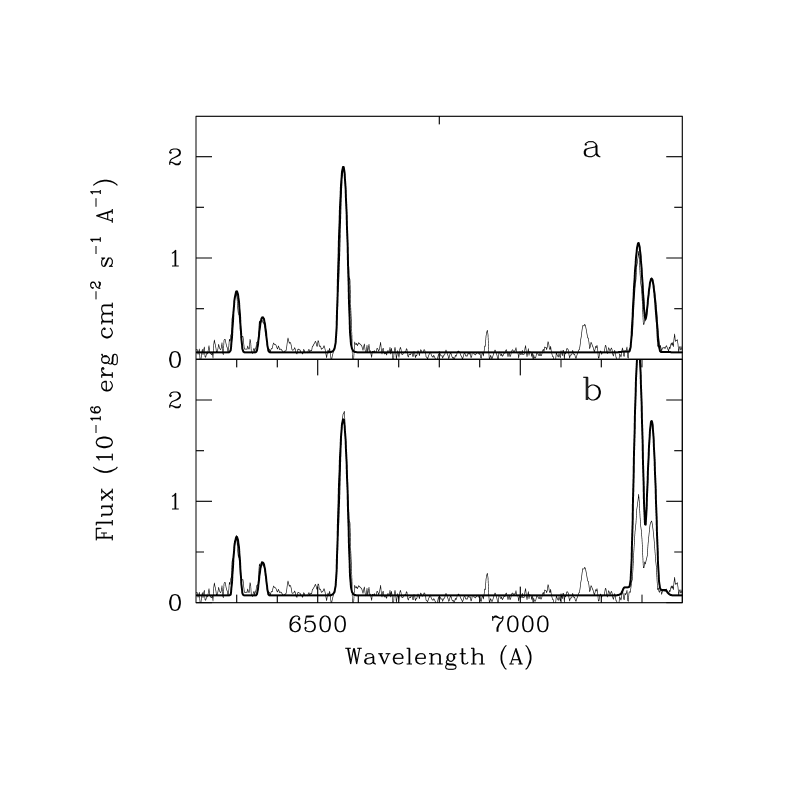
With the modified Monte Carlo model the synthetic spectrum is calculated for two relevant cases: a high-mass model with parameters and (Fig. 3a) and a low-mass model with parameters and (Fig. 3b). Note, that both models have the same photospheric velocity km s-1 and the same ratio , where is the kinetic energy in units of erg and in . Complete mixing, which implies a minimum Rayleigh optical depth, gives and for high and low-mass models, respectively. The thermalization parameter in sub-photospheric layers is 0.35 and 0.24 for high and low-mass models, respectively. In the high-mass model Rayleigh scattering suppresses the emission components of Na I D1,2, Ba II 6142 Å, and Ba II/Fe II peak at 6500 Å down to an unacceptably low level (Fig. 3a). The low-mass case fits the observations fairly well (Fig. 3b). Computations of spectra for different values of Rayleigh optical depth led us to conclude that the tolerated upper limit is 0.6. Yet the Rayleigh optical depth cannot be lower than , otherwise the emission in the Na I D1,2 and Ba II 6142 Å lines becomes too strong. We find an optimal value is with an uncertainty of about 0.15 for the Jan. 17 spectrum.

2.3 Diagnostics of ejecta mass and kinetic energy
The observational limitations upon Rayleigh optical depth in the atmosphere of SN 1997D may be combined with the restriction on the density in the outer layers imposed by the blue absorption edge of Ba II 6142 Å in order to constrain ejecta mass and kinetic energy. The idea may be illustrated using a toy model, in which the supernova envelope is represented by a homogeneous sphere with the boundary velocity . Given the photospheric velocity and Rayleigh scattering optical depth one finds the product , whereas the blue edge of the Ba II 6142 Å absorption gives the outer velocity . For a specific phase one gets then ejecta mass and kinetic energy .
In practice we used a more realistic density profile given by Eq.(1) with a power index . In this case, likewise for the simple model considered above, one can find, accepting a certain ejecta mass, the corresponding value of the kinetic energy compatible with the blue edge of the Ba II 6142 Å absorption in the SN 1997D spectrum on Jan. 17. Again, we adopted a standard barium abundance with the Ba II ion as the dominant ionization state. Variation of the model mass under the condition that the Ba II 6142 Å absorption is reproduced results in the corresponding variation of the kinetic energy. Taking into account uncertainties of the Ba II 6142 Å absorption fit we found a region of allowed parameters (“barium” strip) in the mass–kinetic energy () plane (Fig. 4). The lower and upper limits of Rayleigh optical depth, 0.3 and 0.6, respectively, produce another strip of allowed parameters (“Rayleigh” strip) in this plane. The overlap of “barium” and “Rayleigh” strips gives a tetragonal region where the ejecta mass and kinetic energy of SN 1997D are confined. One sees that optimal values of ejecta mass should reside around , while kinetic energy should be close to erg.
The suggested diagnostics, unlikely useful for ordinary SNe II-P, proved efficient for constraining parameters of SN 1997D. A warning should be kept in mind that a cosmic barium abundance was assumed here. This may in general not be the case since SN 1987A demonstrates that barium overabundance in SNe II-P may be as large as a factor of two relative to the cosmic value (Mazzali et al. mlb92 (1992)). If barium abundance in SN 1997D ejecta is twice the cosmic value, then the “barium” strip in the plane has to be shifted down by a factor towards lower values of kinetic energy. It is remarkable that this diagnostics does not depend on the supernova distance. However there is a weak dependence on reddening via the colour temperature determined from 4500 Å/6140 Å flux ratio which affects the Ba II excitation. Unaccounted reddening leads to the overestimation of the mass obtained from the Ba II line.

2.4 Light curve
The light curve of SN II-P during the plateau phase is determined by the ejecta mass , kinetic energy , pre-SN radius , the structure of the outer layers, the 56Ni mass and its distribution, and the chemical composition of the envelope (Grassberg et al. gin71 (1971); Utrobin viu89 (1989), viu93 (1993)). The 56Ni mass in SN 1997D is reliably measured by the light curve tail. The structure of outer layers of the pre-SN may normally be recovered from the initial phase of the light curve, which was unfortunately missed in the case of SN 1997D. Therefore we used a standard pre-SN density structure with the polytrope index of three, though models with other density structure were also tried. The abundance of the deeper part of the envelope, e.g., the transition region between the H-rich envelope and metal/helium core affects the final stage of photospheric regime and may therefore be probed by the light curve at the end of the plateau phase. In general, the parameters , , and then may be found from the plateau phase duration, luminosity at plateau phase (e.g., in band), and velocity at the photospheric level. In a situation when the plateau phase duration is unknown the optimal Rayleigh optical depth in the atmosphere () provides the missing constraint. The description of the radiation hydrodynamics code used for supernova study may be found elsewhere (Utrobin viu93 (1993), viu96 (1996)).
An extended grid of hydrodynamical models of SN 1997D led us to the conclusion that requirements imposed by the light curve, velocity at the photosphere, and Rayleigh optical depth are consistent with those estimated above from the – diagram. The optimal hydrodynamical model is characterized by the following parameters: the ejecta mass , kinetic energy erg, and pre-SN radius . To prevent the emergence of a luminosity spike at the end of plateau phase and to explain the narrow peak of the H emission in the nebular spectrum on day , we suggest mixing between the helium layer and the H-rich envelope (Fig. 5). The adopted helium/metal core mass before mixing is . With 0.002 of radioactive 56Ni this choice of parameters results in a light curve, which fits the observational data (Turatto et al. tmy98 (1998)) and is consistent with the observational upper limits by Evans at early epochs (Fig. 6). The velocity at the photosphere in this model is 830 km s-1 in agreement with that found from the spectrum synthesis. Remarkably we obtained the same ratio as Turatto et al. (tmy98 (1998)). In our model the first spectrum on Jan. 17 corresponds to the epoch of 46 days after the explosion in good agreement with the 50 days found by Turatto et al. (tmy98 (1998)).

The diffusion approximation used in the hydrodynamical model breaks down at the transition from the plateau to the radioactive tail about d. To reproduce the tail, we translated the bolometric luminosity computed in the hydrodynamical model into the band luminosity using the two assumptions about the spectrum of escaping radiation at the tail phase. The first one admits that the spectrum is black-body with the constant effective temperature calculated at d. This gives somewhat higher luminosity compared to observations at the tail stage (Fig. 6). An alternative approach assumes that the spectrum of escaping radiation during the tail phase is the same as in the observed nebular spectrum at d (Turatto et al. tmy98 (1998)). The latter assumption is more realistic and provides a good fit to observations (Fig. 6). This agreement justifies the adopted 56Ni mass of 0.002 originally obtained by Turatto et al. (tmy98 (1998)).

The envelope structure computed in the hydrodynamical model was then used to recalculate the synthetic spectrum in a way similar to that described in Section 2.2. The model spectrum agrees well with the observed spectrum on Jan. 17 (Fig. 7). Of particular importance is an excellent fit for the emission component of the Na I 5889, 5896 Å doublet which is free of blending, thus being a reliable probe for Rayleigh optical depth in the atmosphere.
Analyzing hydrodynamical models with different sets of input parameters gives us confidence that the envelope mass and the pre-SN radius are determined with the uncertainty of about 1 and , respectively. Therefore, we estimate the ejected mass as with the invariant ratio and the radius of pre-SN as .
A dust extinction in the host galaxy (NGC 1536) cannot be ruled out. It is unlikely, however, significant since the galaxy is nearly face-on. With some dust extinction (if any) the kinetic energy and/or the pre-SN radius should be increased accordingly. For instance, the dust extinction mag suggests the increase of the kinetic energy.
3 Nebular phase
3.1 Nebular model
The high quality late time spectrum of SN 1997D at the nebular epoch d (Turatto et al. tmy98 (1998)) gives us an opportunity of a complementary test for the ejecta model. Our goal here is to reproduce all the strong lines observed in the spectrum, viz. H, [O I] 6300, 6364 Å, and [Ca II] 7291, 7324 Å using the density distribution of the hydrodynamical model. We assume that the ejected envelope consists of two distinctive regions: a core and an external H-rich envelope. The core in the nebular model is a macroscopic mixture of radioactive 56Ni, H-rich matter (component A), He-rich matter (component B), O-rich matter (component C), and the rest of metals, e.g., C, Ne, Mg (component D). The latter does not contribute noticeably to the lines we address. The density of the A, B, and D components is equal to the model local density , while the O-rich matter of density may be clumpy with the density contrast . Voids arising from the oxygen clumpiness are presumably filled in by the 56Ni bubble material.
The average gamma-ray intensity was calculated using a formal solution of the transfer equation with known distribution of 56Ni and assuming the absorption approximation with the absorption coefficient cm2 g-1. The fraction of deposited energy lost by fast electrons on heating and ionization of hydrogen, helium, and oxygen was taken from Kozma & Fransson (kf92 (1992)). The rate of nonthermal excitation and ionization of helium in the H-rich matter was added to the hydrogen ionization rate to take account of hydrogen ionization by UV radiation produced by helium nonthermal excitation and ionization. Due to this process the H intensity is insensitive to the He/H ratio. The photoionization of hydrogen from the second level by hydrogen two-photon radiation and by the Balmer continuum were taken into account as well. The Balmer continuum radiation consists of the recombination hydrogen continuum and the rest of ultraviolet radiation created by the radiation cascade of the deposited energy of radioactive 56Co. This additional component of Balmer continuum radiation was specified assuming that a fraction of the deposited energy is emitted in Balmer continuum with the spectrum . We adopted according to estimates by Xu et al. (xu92 (1992)) for SN 1997A at the nebular epoch.
| Model | (km s-1) | ||||
|---|---|---|---|---|---|
| TM | 15 | 11 | 0.4 | 2000 | 5.5 |
| M1 | 6 | 1 | 0.3 | 600 | 1.2 |
| M2 | 6 | 1 | 1 | 600 | 1 |
| M3 | 24 | 4 | 0.3 | 780 | 1 |
| Model | |||||
| TM | 4.4 | 2 | 0.7 | 1.2 | 0.5 |
| M1 | 0.64 | 0.12 | 0.45 | 0.035 | 0.035 |
| M2 | 0.64 | 0.12 | 0.45 | 0.035 | 0.035 |
| M3 | 4.83 | 0.63 | 0 | 3.4 | 0.8 |
In thermal balance only the principal coolants are included: hydrogen lines, C I 2967 Å, 4621 Å, 8727 Å, 9849 Å, Mg II 2800 Å, [O I] 6300, 6364 Å, [Ca II] 3945 Å, 7300 Å, Ca II 8600 Å, and Fe II lines. For the sake of simplicity the total Fe II cooling rate of permitted and semi-forbidden lines is assumed to be equal to the cooling rate of one Mg II 2800 Å line. However, unlike for the real Mg II line collisional saturation is omitted to allow photon branching in Fe II lines. Cooling via the excitation of Fe II forbidden lines is represented by [Fe II] 8617 Å and [Fe II] 4287 Å lines, which are the most efficient coolants for the relevant temperature and electron density. We include also adiabatic cooling; it is important in the outer region of the hydrogen envelope. Metals with a low ionization potential (Mg, Ca, Fe) are assumed singly ionized.
With a specified density distribution and 56Ni mass the primary fitting parameter is the velocity at the core boundary , which affects line intensities via the mass of the mixed core exposed to the intense gamma-rays. The amount of matter in components A, B, and C should then be determined from the spectrum fit.

3.2 Model test
Before applying the nebular model to SN 1997D it is instructive to compute the nebular spectrum of the well studied SN 1987A. We used the CTIO spectrum corrected for reddening at the epoch 339 days (Phillips et al. phh90 (1990); Pun et al. pun95 (1995)). The primordial metal abundance (Z) is assumed to be 0.4 solar. The density distribution in the envelope is approximated by Eq. (1) with . Compromise values of ejecta mass and kinetic energy erg are adopted (Woosley w88 (1988); Shygeyama & Nomoto sn90 (1990); Utrobin viu93 (1993)). Apart from the 56Ni mass (0.075 ), we specify the amount of metals in the core (component D), in line with the expectations for an 18–22 progenitor (Woosley & Weaver ww95 (1995); Thielemann et al. tnh96 (1996)).
A satisfactory description of line profiles and intensities of H, [O I] 6300, 6364 Å, and [Ca II] 7291, 7324 Å (Fig. 8) is obtained with the test model (TM) for a sound choice of parameters (Table 1). The table gives ejecta mass (), kinetic energy (), the primordial-to-solar metal abundance ratio (), velocity at the outer boundary of the mixed core (), oxygen density contrast (), core mass (), and other core components, viz. H-rich matter (), He-rich matter (), O-rich matter (), and metals (). All masses in Table 1 are given in solar masses. The amount of H-rich and He-rich matter in the mixed core inside 2000 km s-1 ( and , respectively) are in good agreement with values advocated by Kozma & Fransson (kf98 (1998)). The rest of newly synthesized helium () is presumably mixed with the H-rich component. The oxygen mass and density contrast were found from best “eye-fit” of flux of the [O I] doublet. The value corresponds to the oxygen filling factor , a value earlier found by Andronova (a92 (1992)).
The oxygen mass estimate is hampered somewhat by the uncertainty arising from the poorly known fraction of oxygen cooled via CO and SiO emission. In SN 1987A the mass of cool oxygen in the CO dominated region is estimated as 0.2 (Liu & Dalgarno ld95 (1995)). With a comparable oxygen mass hidden in the SiO region we thus miss about 0.4 of oxygen. Therefore the total oxygen mass must be in rough agreement both with the estimate from the HST spectrum at nonthermal excitation phase (Chugai et al. nch97 (1997)) and predictions of stellar evolution models for an 18–22 progenitor (Woosley & Weaver ww95 (1995); Thielemann et al. tnh96 (1996)).
Omitting details, we conclude that the test of nebular model in the case of SN 1987A is successful and demonstrates that the model is able to recover reliable values of important parameters.
3.3 SN 1997D: low and high-mass models
Now we turn to the nebular spectrum of SN 1997D at d. First, the 6 case based on the hydrodynamical model (Section 2.4) will be considered. Some refinement of the hydrodynamical model is needed, however, to apply it to nebular epoch. The amount of metals in the mixed core is specified assuming that masses of metals and oxygen are equal. This is a reasonable assumption for a low-mass pre-SN. The oxygen abundance in He-rich matter (component B) was assumed one tenth cosmic, while a carbon abundance of 0.03 is adopted for He-rich matter in the 6 model. We then also consider the 24 case based on the model by Turatto et al. (tmy98 (1998)) with the composition taken from Nomoto & Hashimoto (nh88 (1988)).
The low-mass nebular model of SN 1997D fits the observed spectrum fairly well (Fig. 9a) with the optimal choice of parameters represented by model M1 (Table 1). The [Ca II] 7300 Å profile was reproduced for the core velocity km s-1. This parameter is of primary importance, since it determines the absolute mass of the core components with the adopted density structure. We failed to fit the absolute flux of this line with a cosmic primordial abundance adopted for the model M2 (Table 1 and Fig. 9b), while the primordial abundance 0.3 of cosmic in model M1 provides an excellent fit. The oxygen doublet intensity is determined primarily by the mass of the O-rich matter, although some 20% come from He and H-rich matter. The value of 0.035 is corrected for the unseen cool oxygen assuming that we see 3/4 of all the pure oxygen in the [O I] doublet as in SN 1987A. A strong oxygen overdensity is not required. We found that in model M1 provides somewhat better agreement with the observed ratio of [O I] doublet components than . The amount of He-rich matter is a lower limit for the mass of the He shell in the pre-SN. One may admit up to 1 of helium mixed microscopically with the H-rich envelope without a notable effect on line intensities.
Unfortunately our nebular model is not applicable to the earlier nebular spectrum of SN 1997D on day 150. The reason is the significant optical depth in the Paschen continuum predicted by the model. In such a situation the multilevel statistical equilibrium must be solved together with a full radiation transfer, which is beyond the scope of this paper. Moreover, we found that the observed H profile at this epoch is odd exhibiting a significant redshift of unclear origin. A prima face explanation assuming 56Ni asymmetry cannot accommodate to the late time nebular spectrum ( d) lacking such an asymmetry.

To evaluate the uncertainty related with the assumption of the same fraction (1/4) of cool O-rich gas as in SN 1987A, we compared parameters relevant to molecular formation (density and temperature) in the O-rich matter at a similar nebular epoch. We found that the density of O-rich gas in SN 1997D is lower, while the temperature is somewhat higher compared to SN 1987A. Both parameters suggest therefore that formation of molecules in SN 1997D cannot be more efficient than in SN 1987A, which means that the fraction of unseen pure oxygen in SN 1997D does not exceed that in SN 1987A. With the uncertainty of the core velocity the estimated range of pure oxygen mass in SN 1997D is 0.02–0.07 .
We applied the nebular model to the high-mass case (). Due to the large mass of the He/O core the velocity of the core boundary is too high and inconsistent with the observed [Ca II] doublet profile. Mixing all the freshly synthesized helium with the hydrogen envelope reduces the core velocity but not sufficiently to resolve this controversy (Fig. 10a). Another serious problem is a high [O I] doublet flux and wrong doublet ratio. The five-fold reduction of amount of line-emitting oxygen, presumably due to molecular formation and cooling, alleviates the problem of total flux in the [O I] doublet. Yet the problem of high ratio in this model remains (Fig. 10b).
Summing up, we found that the hydrodynamical model of moderate mass ejecta () which contains low amount of freshly synthesized oxygen (0.02–0.07 ) is consistent with the nebular spectra of SN 1997D. The model of high-mass ejecta as such is incompatible with the observed nebular spectra.

4 Discussion
We attributed SN 1997D to the SN II-P event characterized by the kinetic energy erg and ejecta mass . The ejecta are dominated by H-rich matter and contains 0.02–0.07 of freshly synthesized oxygen. The estimated 56Ni mass is about 0.002 in accordance with the value found by Turatto et al. (tmy98 (1998)). The pre-SN had a moderate radius of 85 and possibly a low primordial metallicity, 0.3 cosmic.
At first glance the suggested low metallicity of SN 1997D disagrees with the assumed cosmic abundance of barium which implies a relative overabundance by a factor of three. The latter should not confuse us, however, after SN 1987A in which the relative barium overabundance is about five (Mazzali et al. mlb92 (1992)) for the comparable metallicity of both supernovae. Amazingly, the relatively small pre-SN radius and low primordial metallicity of SN 1997D both are reminiscent of SN 1987A. Possibly it reflects some trend for low metallicity progenitors to have smaller pre-SN radii compared to SNe II-P with cosmic metallicity.
When combined the ejecta mass and the collapsed core mass (presumably 1.4 ), the total pre-SN mass amounts to 6–9 prior to outburst. The main-sequence progenitor likely was more massive because of a possible wind mass-loss. In the context of general results of stellar evolution theory, the low mass of freshly synthesized oxygen () is compelling evidence that the progenitor of SN 1997D was a main-sequence star from the 8–12 range. These stars are known to end their life with very low amount () of synthesized oxygen (Nomoto n84 (1984); Woosley w86 (1986)). Ejecta of CCSN produced by such stars must contain very small amount of 56Ni, significantly less than normal CCSN (Woosley w86 (1986)), which is also in line with SN 1997D.
The fact that at least some CCSN originating from the 8–12 mass stars have low kinetic energy ( erg) and eject small amounts of 56Ni () modifies a picture of CCSN with “standard” kinetic energy of erg and 56Ni mass of 0.07–0.1 . The new situation in the systematics of CCSN is visualized by the and 56Ni mass– plots (Fig. 11) which show the position of SN 1997D along with two other well studied CCSN, SN 1987A (Woosley w88 (1988); Shygeyama & Nomoto sn90 (1990); Utrobin viu93 (1993)) and SN 1993J (Bartunov et al. bbpt94 (1994); Shigeyama et al. setal94 (1994); Woosley et al. woetal94 (1994); Utrobin viu96 (1996)). The primary significance of this plot is that both nearly constant kinetic energy ( erg) and 56Ni mass () in the range of progenitor masses between and abruptly drop at the low end of massive star range producing CCSN (around 10 ). It would be not unreasonable to consider that SN 1997D is a prototype for a new family of CCSN (below referred to as “weak CCSN”) which occupies the same place on the – and 56Ni mass– plots as SN 1997D.
Unfortunately, there are no clear theoretical predictions in regard to weak CCSN. Yet current trends in the core-collapse modelling seem to be generally consistent with Fig. 11. Two explosion mechanisms are related to producing CCSN: prompt (core rebound) and delayed (neutrino-driven mechanism). For 8–10 progenitors the prompt mechanism attains its highest efficiency (Hillebrandt et al. hnw84 (1984)) with the kinetic energy of ejecta erg (Baron & Cooperstein bc90 (1990)), while the delayed mechanism, on the contrary, has the lowest efficiency in this mass range with similar energy erg (Wilson et al. wmww86 (1986)). Thus both explosion mechanisms remain viable in the context of SN 1997D. However, possibly only the neutrino-driven mechanism is able to account for the kinetic energy increase with the progenitor mass in the range from about 10 to (Wilson et al. wmww86 (1986); Burrows b98 (1998)).
How frequent are SN 1997D-like phenomena? The first thought is that they are extremely rare, since among identified SN II-P events only one such case has been discovered so far. However, with the low absolute luminosity ( mag) and the brief plateau duration (40–50 days) compared to normal SN II-P characteristics ( mag and 80–100 days, respectively) it would not be surprising, if SN 1997D-like events were as frequent as of normal SN II-P rate. Such a rate might be maintained by progenitors from the mass interval in the vicinity of main-sequence mass .
Progenitors from the 8–12 mass range were suggested earlier as counterparts for supernovae with a dense circumstellar wind, low ejecta mass (), and possibly normal kinetic energy (e.g. SN 1988Z, Chugai & Danziger cd94 (1994)). The present attribution of SN 1997D to the same mass range introduces some dissonance with the former conjecture. In reality, this controversy is not serious since 8–12 progenitors are characterized by very complicate evolutions of their cores (Nomoto n84 (1984); Woosley w86 (1986)) and therefore a different outcome for slightly different initial mass is quite conceivable. Moreover, it may well be that with a normal metallicity presupernova of weak CCSN also vigorously loses mass and explodes in a dense wind thus producing a luminous supernova (possibly SN IIn) due to the ejecta wind interaction.
Another intriguing possibility is that a presupernova of weak CCSN might lose all the hydrogen envelope in a close binary system before the explosion. In this case weak CCSN will be a mini-version of SN Ib with low explosion energy, low amount of 56Ni, and, eventually, low luminosity. Unfortunately it will not be easy to detect such events.
If weak CCSN are as frequent as of all CCSN, a good fraction of galactic population of SNR may be related to these supernovae. We cannot miss the opportunity to speculate that at least two historical supernovae SN 1054 and SN 1181 might be identified with weak CCSN. Nomoto (n84 (1984)) already argued that the Crab Nebula was created by CCSN with the progenitor mass around 9 . The luminosity of SN 1054, which was normal for SN II, could be explained then by the interaction of ejecta with a dense pre-SN wind. This suggestion in fact is a modification of the earlier idea that the initial phase of the light curve of SN 1054 could be powered by the shock wave propagating in the circumstellar ( cm) envelope (Weaver & Woosley ww79 (1979)). The second possible counterpart of a galactic, weak CCSN is SN 1181. With the absolute luminosity of mag at maximum (Green & Gull gg82 (1982)) and half year period of visibility SN 1181 is the closest analogue of SN 1997D. Low radial velocities ( km s-1) of SN 1181 filaments claimed by Fesen, Kirshner & Becker (fkb88 (1988)) seem to strengthen this identification. If the association of SN 1181 is correct then we expect to find very low amount of newly synthesized oxygen and iron-peak elements in this supernova remnant.
Acknowledgements.
We thank Massimo Turatto for sending spectra of SN 1997D. We are grateful to Ken Nomoto, Bruno Leibundgut, Peter Lundqvist, and Wolfgang Hillebrandt for discussions and comments. N.Ch. thanks Bruno Leibundgut for hospitality at ESO and V.U. thanks Wolfgang Hillebrandt and Ewald Müller for hospitality at MPA. This work was supported in part by the RFBR (project 98-02-16404) and the INTAS-RFBR (project 95-0832).References
- (1) Andronova A.A., 1992, Sov. Astron. Lett. 18, 360
- (2) Baron E., Cooperstein J., 1990, ApJ 353, 597
- (3) Bartunov O.S., Blinnikov S.I., Pavlyuk N.N., Tsvetkov D.Yu., 1994, A&A 281, L53
- (4) Burrows A., 1998, In: Hillebrandt W., Müller E. (eds.), Proceedings of the 9th Workshop on Nuclear Astrophysics. Max-Plank Institut für Astrophysik, Garching b. München, p. 76
- (5) Chugai N.N., Danziger I.J., 1994, MNRAS 268, 173
- (6) Chugai N.N., Chevalier R.A., Kirshner R.P., Challis P.M., 1997, ApJ 483, 925
- (7) De Mello D., Benetti S., 1997, IAU Circ. 6537
- (8) Fesen R.A., Kirshner R.P., Becker R.H., 1988, In: Roger R.S., Landecker T.L. (eds.), Supernova Remnants and the Interstellar Medium. Cambridge University Press, Cambridge, p. 55
- (9) Gavrila M., 1967, Phys. Rev. 163, 147
- (10) Grassberg E.K., Imshennik V.S., Nadyozhin D.K., 1971, Ap&SS 10, 28
- (11) Green D.A., Gull S.F., 1982, Nat 299, 606
- (12) Grevesse N., Sauval A.J., 1998, Space Sci. Rev. 85, 161
- (13) Hillebrandt W., Nomoto K., Wolf R.G., 1984, A&A 133, 175
- (14) Kozma C., Fransson C., 1992, ApJ 390, 602
- (15) Kozma C., Fransson C., 1998, ApJ 497, 431
- (16) Liu W., Dalgarno A., 1995, ApJ 454, 472
- (17) Mazzali P.A., Lucy L.B., Butler K., 1992, A&A 258, 399
- (18) Nomoto K., 1984, ApJ 277, 791
- (19) Nomoto K., Hashimoto M., 1988, Phys. Rep. 163, 13
- (20) Phillips M.M., Hamuy M., Heathcote S.R., Suntzeff N.B., Kirhakos S., 1990, AJ 99, 1133
- (21) Pun C.S.J., Kirshner R.P., Sonneborn G., et al., 1995, ApJS 99, 223
- (22) Shigeyama T., Nomoto K., 1990, ApJ 360, 242
- (23) Shigeyama T., Suzuki T., Kumagai S., et al., 1994, ApJ 420, 341
- (24) Sobolev V.V., 1975, Light Scattering in Planetary Atmospheres. Pergamon Press, Oxford p. 32
- (25) Thielemann F.-K., Nomoto K., Hashimoto M., 1996, ApJ 460, 408
- (26) Turatto M., Mazzali P.A., Young T.R., et al., 1998, ApJ 498, L129
- (27) Utrobin V.P., 1989, Sov. Astron. Lett. 15, 42
- (28) Utrobin V.P., 1993, A&A 270, 249
- (29) Utrobin V.P., 1996, A&A 306, 219
- (30) Weaver T.A., Woosley S.E., 1979, BAAS 11, 724
- (31) Wilson J.R., Mayle R., Woosley S.E., Weaver T., 1986, In: Livio M., Shaviv G. (eds.), Twelfth Texas Symposium on Relativistic Astrophysics. NY Academy of Sciences, New York, p. 267
- (32) Woosley S.E., 1986, In: Hauck B., Maeder A., Meynet G. (eds.), Nucleosynthesis and Chemical Evolution. Geneva Observatory, Geneva, p. 1
- (33) Woosley S.E., 1988, ApJ 330, 218
- (34) Woosley S.E., Weaver T.A., 1995, ApJS 101, 181
- (35) Woosley S.E., Eastman R.G., Weaver T.A., Pinto P.A., 1994, ApJ 429, 300
- (36) Xu Y., McCray R., Oliva E., Randich S., 1992, ApJ 386, 181
- (37) Zampieri L., Shapiro S.L., Colpi M., 1998, ApJ 502, L149