Geomagnetic Effects on the Performance of Atmospheric Čerenkov Telescopes
P.M. Chadwick, K. Lyons, T.J.L. McComb, K.J. Orford, J.L. Osborne, S.M.
Rayner, S.E. Shaw, and K.E. Turver
Dept. of Physics, Rochester Building, Science
Laboratories, University of Durham, Durham DH1 3LE, UK
Abstract
Atmospheric Čerenkov telescopes are used to detect electromagnetic showers from primary gamma rays of energy GeV and to discriminate these from cascades due to hadrons using the shape and orientation of the Čerenkov images. The geomagnetic field affects the development of showers and diffuses and distorts the images. When the component of the field normal to the shower axis is sufficiently large ( G) the performance of gamma ray telescopes may be affected.
1 Introduction
Bowden et al. (1991) discussed the effect of the geomagnetic field on the performance of ground based gamma ray telescopes. The interaction of the field and the cascade electrons produces a broadening of the atmospheric Čerenkov light image resulting in a reduction in the density of light sampled by the telescope; so the energy threshold for the telescope increases. This is observed in the higher counting rate for a telescope when detecting showers propagating along the lines of the field (with no spreading) than when observing cascades developing perpendicular to the field lines (and being spread). Typical differences in measured count rate were about 20% in these extreme cases. The possibility was noted, on the basis of simulations, that an associated rotation of the direction of the Čerenkov light images may occur for cascades developing under high magnetic fields and in unfavourable directions. This could be of importance in ground-based gamma ray studies since the orientation of the image in gamma ray initiated cascades is the key to rejection of 99% of the charged cosmic ray background (Hillas, 1985).
Lang et al. (1993) showed that their measurements of TeV gamma rays from the Crab nebula using the imaging Čerenkov technique were not significantly affected by magnetic fields 0.35 G.
We report measurements made using a ground based gamma ray telescope of cascades developing under the influence of fields up to 0.55 G. Observations with the Mark 6 telescope operating in Narrabri, Australia which is discussed by Armstrong et al. (1999) are subject to such magnetic fields when observing objects to the south. The observational data demonstrate all the effects of the geomagnetic field on cascades which are predicted by simulations.
2 Experimental results
Most of the data considered here were taken during routine observations of potential gamma ray sources during 1996 – 1998. A small amount of data was taken in dedicated measurements at fixed zenith angles of and a range of azimuth, corresponding to a range of values of the geomagnetic field. The only restriction imposed on data was that events should lie within of the centre of the camera (to avoid edge effects) and should be large enough (5 times the triggering threshold) to ensure that their shapes were well measured.
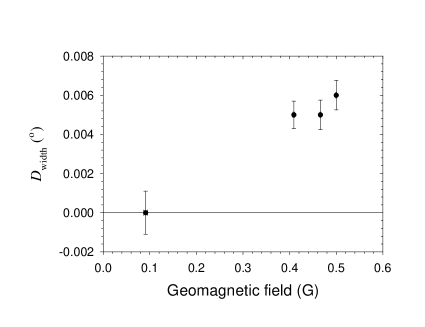
The widths of images recorded by the Mark 6 telescope in directions parallel and perpendicular to the magnetic field have been investigated. For a sample of cascades measured during observations of a range of sources the small but significant differences of the mean width in the parallel and perpendicular directions are shown in figure 1 for a range of values of distorting field. The widths of cascades in directions perpendicular to the field are significantly greater than those in parallel directions for fields G. Although the differences in widths are small because of the effects of pixellation and noise which are common to all data, the measurements are free from systematic effects. This is because the orientation of images to the magnetic field depends on the orientation of the image in the camera. Measurements of the width of the images parallel and perpendicular to the magnetic field are derived from events distributed throughout the same observation.
In the absence of any magnetic field and detector triggering biases, the distribution of the orientation of the images in the camera of a telescope will be isotropic. If we define a coordinate system where the angle is the angle of the long axis of an image to the horizontal in the camera frame, then the distribution of should be flat between and . Minor deviations from uniformity in angle might be expected near to threshold because of the increased effect of small changes in triggering probability and the six-fold symmetry of the hexagonal arrangement of close-packed detectors.
We show in figure 2(a) the distribution in the angle for background hadronic events which are subject to small values of the transverse magnetic field (0.15 G). We show in figure 2(b) the distribution in for images due to hadron-induced cascades recorded under a transverse geomagnetic field of 0.52 G. All of these events were recorded in dedicated observations with the telescope at a fixed zenith angle (). Data at different values of the transverse magnetic field were obtained by varying the azimuth angle.
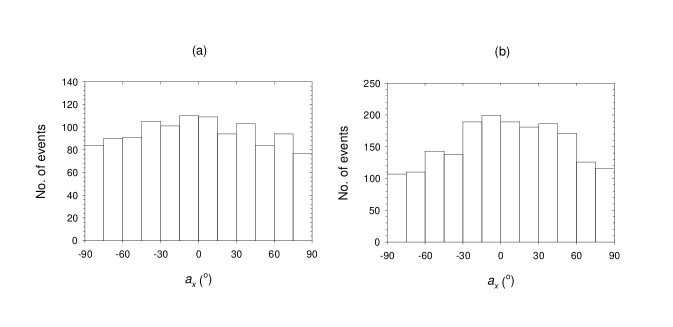
All data in figure 2 were recorded within a period of one hour, so potential variations due to camera performance, atmospheric clarity, etc. were minimised. The data were processed following our normal procedures (see e.g. Chadwick et al., 1998b). The requirement that images have a minimum brightness and fall within the camera ensures that the data are free of effects of variations in night sky brightness. The data for G show the expected distribution indicative of a near isotropic distribution of directions in the camera with a small peak. We note a strong anisotropy, with a peak containing twice the minimum number of events resulting from the skewing or distortion of the image, for events subject to a G field. The maximum of the distortion occurs at , which is appropriate for these observations which were made at magnetic south.
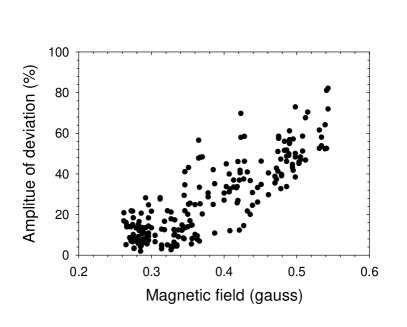
The magnitude of the anisotropy displayed in figure 2(b) should depend on the strength of the magnetic field. In figure 3 we plot the amplitude of the peak of the distortion in the distribution as a function of the magnetic field strength. Each point corresponds to the result for a 15 minute segment of data taken as part of routine telescope operation.
Note that for values of transverse component of the geomagnetic field less than 0.35 G there is no great distortion of the distribution, as suggested by the work of Lang et al. (1993), but for values of field in excess of 0.4 G substantial distortion occurs.
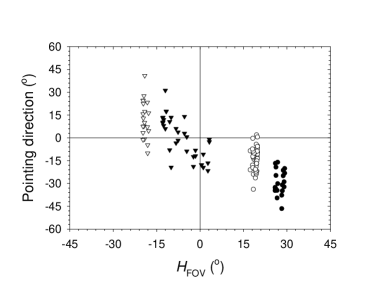
The position of the peak in the distribution depends on the angle between the projected magnetic field and the vertical direction in the camera — . We show in figure 4 the correlation between and the position of the peak in . The data demonstrate the expected relation between these angles.
3 The orientation of gamma ray images
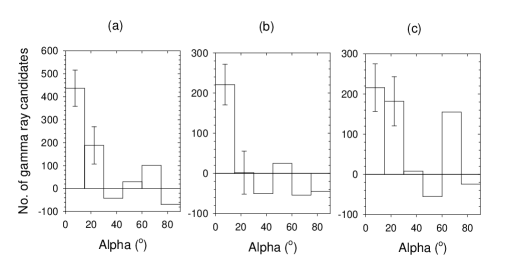
A number of potential gamma ray sources has been observed using the Mark 6 telescope at Narrabri. In several cases there is evidence for gamma ray emission (Chadwick et al., 1998a, 1998b, 1999). The evidence comes mainly from a comparison of the ALPHA distributions for data selected on the basis of image shape for the ON-source and OFF-source scans. The difference between the ALPHA distributions should show an excess of events — the gamma ray candidates — at low values of ALPHA. If the data were taken in geomagnetically unfavourable directions, as is the case for most of our data, it might be expected that the ALPHA distribution of the excess events would be wider than that for data taken in more favourable geomagnetic directions. Consideration of data recorded from a gamma ray source which are subject to G may provide the only true indication of the ALPHA-distribution for gamma rays in our telescope.
Observations of PKS 2155–304 were made with the cascades recorded over a range of transverse geomagnetic field strengths between 0.25 and 0.5 G. The total data set contained 41 hrs of observation, as reported (Chadwick et al. 1999). The ALPHA plot for the difference between the ON-source and OFF-source data taken at zenith angles is shown in figure 5(a). The significance of the excess at ALPHA is . We are able to select a subset of data for which the strength of the projected field to which the cascades were exposed was 0.35 G and for which minimal distorting effect would be expected. The ALPHA plot for this subset is shown in figure 5(b). The excess events all have ALPHA and the distribution is narrower than that of the total dataset and is typical of that expected for a pixel camera. (In the absence of any other data for gamma rays detected with our telescope and not subject to the effects of the magnetic field, we assume that this is reasonable.)
The ALPHA plot for the majority of the events for which the field is 0.35 G, is shown in figure 5(c). It is evident that the width of the peak is larger for these events recorded under the influence of higher transverse magnetic fields, with equal populations for values of ALPHA between – () and – (). It should be noted that the peak at – is superimposed on an ALPHA-plot with increasing frequency for ALPHA approaching — see Chadwick et al. (1999). The significance of this peak is therefore (before allowing for the number of bins in the ALPHA-plots).
4 Conclusions
We have demonstrated that the Čerenkov images from gamma rays and cosmic rays are broadened and rotated by the geomagnetic field. The broadening results in an increase in the telescope threshold and a reduction in counting rate. The rotation of the images away from the projected direction of the magnetic field in the image plane broadens the ALPHA distribution and decreases the sensitivity of the telescope.
These results suggest that the geomagnetic field can have an important effect on the operation of atmospheric Čerenkov telescopes in some directions and that, for detected and candidate sources, the Narrabri site is particularly susceptible. These effects should be removable using appropriate correction techniques; unlike noise, geomagnetic effects do not reduce the information contained in the image.
We are grateful to the UK Particle Physics and Astronomy Research Council for support of the project and the University of Sydney for the lease of the Narrabri site. The Mark 6 telescope was designed and constructed with the assistance of the staff of the Physics Department, University of Durham.
References
Armstrong, P. et al. 1999, Experimental Astron., in press
Bowden, C.C.G. et al. 1992, J. Phys. G.: Nucl. Part. Phys., 18, L55
Chadwick, P.M. et al. 1998a, Astrop. Phys., 9, 131
Chadwick, P.M. et al. 1998b, ApJ, 503, 391
Chadwick, P.M. et al. 1999, ApJ, 513, 161
Hillas, A.M. 1985, Proc. 19th ICRC (La Jolla) 3, 445
Lang, M.J. et al. 1994, J. Phys. G.: Nucl. Part. Phys., 20, 1841