The energy spectra of TeV sources measured with the Durham Mark 6 Telescope
P.M. Chadwick, K. Lyons, T.J.L. McComb, K.J. Orford, J.L. Osborne, S.M.
Rayner, S.E. Shaw, and K.E. Turver
Dept. of Physics, Rochester Building, Science
Laboratories, University of Durham, Durham DH1 3LE, UK
Abstract
A programme of detailed simulations of the response of the Durham Mark 6 atmospheric Cherenkov telescope is in progress. The effective collecting area for triggering by gamma-ray showers after application of selection criteria is derived as a function of energy. An initial result from the larger events in the 1996 and 1997 observations of the BL Lac PKS 2155–304 is that the time averaged flux above 1.5 TeV was m-2 s-1.
1 Introduction
The Durham Mark 6 atmospheric Cherenkov telescope, operating at Narrabri, NSW, has so far detected 4 sources of TeV energy gamma-rays. A programme of detailed simulations of the response of the telescope to gamma-ray and cosmic ray inititiated air showers is in progress. The aim is to improve the data analysis, refine the measurements of integral flux of these sources and obtain information on their spectra. Some initial results of this programme are reported here.
2 The Simulations
The Monte Carlo simulation is performed in two stages. In the first a recent version of the MOCCA92 code (Hillas, 1995) models the shower development in the atmosphere and generates the position, time and direction of arrival of Cherenkov photons at the telescope mirrors (expressed as potential photoelectrons at the PMT photocathodes). This version includes wavelength dependent atmospheric absorption, mirror reflectivity and PMT quantum efficiency. The second stage models the mirror optics, the PMT detector arrays, the telescope triggering, the noise and the overall gain of the Mark 6 telescope. This produces images in terms of digital counts that can be processed in the same way as the real data.
A detailed description of the Mark 6 telescope has been given by Armstrong et al. (1999). The properties that are incorporated into the second stage of the simulations are as follows. The telescope is 260 m above sea level. It has three 7 m diameter f/1.0 parabolic mirrors mounted with their centres 7 m apart on a single alt-azimuth platform. At the focus of the central mirror there is an imaging camera consisting of a close packed hexagonal array of 91 circular 2.5cm diameter Hamamatsu R1924 PMTs with spacing. Conical reflective light concentrators largely eliminate the dead area between the tubes. The array covers a 1.3∘ radius field of view. Surrounding this is a guard ring of 18 circular 5cm diameter Burle 8575 PMTs. The photodetectors of the left and right mirrors each have 19 Phillips XP3422 hexagonal PMTs covering field of view of the 91 2.5 cm PMTs. The mirror surface is Alanod 410G anodised aluminium with a reflectivity 75% in the wavelength range 700 to 350 nm and falling to 60% at 280 nm. The response of the 2.5 cm PMTs cuts off at this wavelength. The point spread function of the mirrors may be represented by the sum of two Gaussians, a narrow component with an rms radius of and a ‘skirt’ with an rms radius of contributing 24% of the peak amplitude. The trigger requires, within a coincidence time of 10 ns, a signal from corresponding left and right mirror PMTs and any two adjacent centre mirror PMTs of the group of 7 that cover the same region of the sky. A direct measure of the gain of the system by means of a radioactive light pulser applied to each PMT gives a digital counts to photoelectron ratio, dc/pe.
Ultimately showers will be simulated over the full range of zenith angles. Initially a zenith angle of 30∘ has been chosen as representative of the bulk of the observations. Some dependence of the shape of the Cherenkov images on the strength of the geomagnetic field component perpendicular to the shower axis has been observed. An azimuth angle of 180∘ gives 0.48 G for this component, again a typical value for many of the observations.
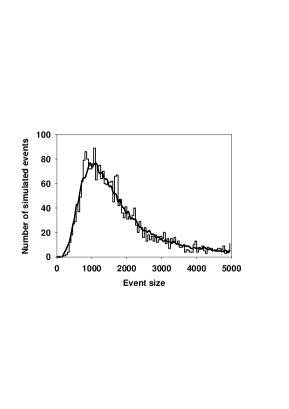
In order to calibrate the gain of the telescope 31000 cosmic ray showers with energies between 0.3 and 30 TeV were generated. For each shower the telescope is placed at 5 random positions within an impact radius of 300m and for each of these the shower direction takes 4 random values out to 2∘ from the centre of the field of view. The same values of cosmic ray composition and spectra were adopted as were used by Mohanty et al. (1998). By adjustment of the discriminator level in the simulations the typical observed off-source trigger rate at 30∘ zenith angle of 640 cpm was matched. The distribution of the SIZE of the triggering events in units of the number of photoelectrons in the imaging tubes was produced. This was then compared with the observed SIZE distribution of off-source showers expressed in digital counts. As can be seen in figure 1 a value of dc/pe of 4.5 gives a good fit, in agreement with the directly measured value.
3 Results of Gamma-Ray Simulations
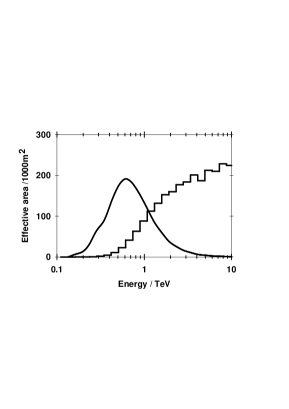
A total of 50000 gamma-ray showers with energies between 0.1 and 30 TeV were generated in order to determine the triggering probability as a function of energy and then the probability of the gamma rays surviving the various selection criteria which are applied to enhance the gamma-ray signal to cosmic ray background ratio. Again for each shower the telescope is placed randomly at 5 positions within an impact radius of 300 m of the shower axis. The shower energies were drawn randomly from a differential power law spectrum of index 2.4 but the exact value of this index does not matter as the triggering probability at a given energy is given by the ratio of the number of showers triggering to the number of showers generated at that energy. Using the discriminator level and dc/pe ratio determined from the cosmic ray flux the total number of triggers was 9256. The effective area for triggering as a function of energy is shown as the histogram in figure 2. This is obtained by multiplying the triggering probabilities by the the 300 m radius target area.
Any gamma-ray source energy spectrum can be multiplied into this distribution and integrated to obtain the corresponding total triggering rate. The curve in figure 2 shows the smoothed effective area distribution multiplied by . It can be seen that significant triggering starts at GeV. A traditional definition of the energy threshold is the energy of the peak of the triggering energy spectrum, which lies at 600 GeV for the Mark 6 telescope. The effective area above threshold may be defined as that of a detector with 100% triggering probability above the threshold energy and zero below it that has the same total triggering rate as the telescope. The value of this effective area is m2.
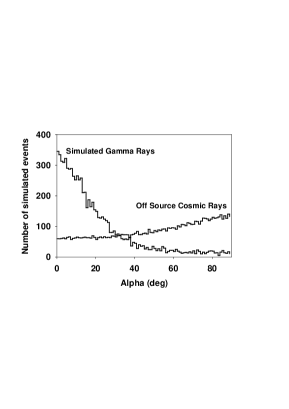
The process of gamma-ray/cosmic ray separation based on image parameters (Hillas 1985) is then applied to the triggering events. The first selection is based on SIZE, the sum of the digital counts in the central camera tubes. Those events with SIZE below 200 dc are rejected. ‘Image’ tubes are then defined, in this study, firstly as those at more than 4.25 times the rms sky noise and secondly those at more than 2.25 times the sky noise that are adjacent to the first. Events with less than two image tubes are removed. A DISTANCE parameter, the distance of the image centroid from the centre of the camera is evaluated and those with DISTANCE 1.1∘ or have peak brightness in the guard ring are rejected. These criteria result in the removal of 40 to 50% of the triggered cosmic ray events. The primary aim is to retain only those events to which useful image parameters can be assigned but the simulations show that only of the gamma-rays will have been removed. Further image parameters are then evaluated: the WIDTH, the rms spread of the image along the minor axis; the ECCENTRICITY, the ratio width/length; the CONCENTRATION defined as the fraction of dc in SIZE that is not in image tubes; and the difference in position of the image centroids in the left and right detectors. Lower values of these last two parameters should favour the selection of gamma-ray images. The final, and most significant parameter is ALPHA, the angle between the image’s long axis and the line from its centroid to the source position (i.e. the camera centre for the simulations). A comparison of the ALPHA distributions for simulated gamma-rays and observed cosmic rays is shown in figure 3.
From a consideration of earlier simulations and some empirical optimisation, parameter cuts as listed in Table 1 plus the requirement that ALPHA 22.5∘ has been adopted by the Durham group for the analysis of data from AGN source candidates. The SIZE independent DISTANCE and ECCENTRICITY cuts are applied in order to ensure well defined values of ALPHA. By applying these cuts to the simulated gamma-ray events we should obtain distributions of effective area against energy which can be applied to the excess counts in each size bin for an observed source to obtain the corresponding fluxes and thus an indication of its energy spectrum. At the present stage of the work, however, we find that the fluxes obtained from the smaller size bins are not sufficiently robust against refinements in the simulations of noise and image blur to be reliably quoted. For the two larger size bins the results are more robust and we apply them in the next section.
4 The Source PKS 2155–304
Positive results from the close X-ray selected BL Lac PKS 2155–304 were obtained for the 1996 and 1997 observing seasons (Chadwick et al., 1999) including an indication of a correlation of VHE with X-ray fluxes. For zenith angles less than 45∘ a total of 544 excess gamma-rays were observed on-source in 32.5 hours of observation. The the top two size bins contain an excess of 358 events, with a significance of 3.1. The gamma-ray simulations indicate that the effective area against energy for these large events when multiplied by an spectrum peaks at 1.5 TeV. Treating this as their ‘threshold energy’ the effective area above threshold is m2 and the corresponding flux above this energy is m-2s-1, where the error is statistical only.
| Parameter | Ranges | Ranges | Ranges | Ranges | Ranges |
|---|---|---|---|---|---|
| SIZE (d.c.) | |||||
| DISTANCE | |||||
| ECCENTRICITY | |||||
| WIDTH | |||||
| CONCENTRATION | |||||
| Excess on-source | 29 | 74 | 83 | 138 | 220 |
| Off-source Events | 227 | 371 | 433 | 1546 | 2042 |
5 Conclusions
Work will continue on the simulations of the trigger and the effects of noise and the mirror blur on the images near threshold. The systematic uncertainties in the derived fluxes need evaluating. A refinement of the selection criteria and their energy dependence should be possible.
We are grateful to the UK Particle Physics and Astronomy Research Council for support of the project and to A.M. Hillas for providing an updated version of MOCCA92.
References
Armstrong, P. et al. 1999, Experimental Astron., in press
Chadwick, P.M. et al. 1999, ApJ, 513, 161
Hillas, A.M. 1985, Proc. 19th ICRC (La Jolla) 3, 445
Hillas, A.M. 1995, Proc. 24th ICRC (Rome) 1, 270
Mohanty, G. et al. 1998, Astrop. Phys., 9, 15