Young galaxies: what turns them on?
Abstract
Lyman break galaxies (LBGs) at exhibit number densities and clustering similar to local galaxies; however, their star formation rates (SFRs) are much higher. We explore the scenario in which LBGs are starburst galaxies triggered by collisions, and thus provide an explanation for these key properties. The relative paucity of starburst galaxies at low redshift can be attributed to a much higher collision rate in the past. We use high-resolution cosmological -body simulations and a hierarchical halo finder to estimate the galaxy collision rate as a function of time in the popular CDM cosmological model. We find that bright collisional starbursts are frequent enough to account for most of the high- () LBGs. Moreover, many of the objects are of relatively small mass, but they cluster about large-mass halos. They therefore exhibit strong clustering, similar to that observed and stronger than that of the relevant massive halos.
1Physics Department, University of California, Santa Cruz,
CA 95064, USA
2Racah Institute for Physics, The Hebrew University,
Jerusalem 91904, Israel
3Astronomy Department, University of California,
Santa Cruz, CA 95064 USA
4Astronomy Department, New Mexico State University,
Box 90001, Dept. 4500, Las Cruces, NM 88003, USA
5UCO/Lick Observatory, University of California, Santa Cruz,
CA 95064 USA
1 Introduction
Data from the Hubble Deep Field (reviewed in Dickinson (1998)) and ground-based telescopes (Steidel et al. (1996a, b); Lowenthal et al. (1997); Steidel et al. (1998)) have revealed a population of galaxies at . They were found by multicolor photometry exploiting the characteristic spectral attenuation shortward of the Lyman limit, so these galaxies are referred to as “Lyman break galaxies”. The LBGs are observed to be abundant and highly clustered, with comoving number densities and clustering properties at comparable to those of present-day bright () field galaxies (Giavalisco et al. (1998); Adelberger et al. (1998)). They are forming stars at a high rate, comparable to local “starburst” galaxies, and are much smaller than similarly bright galaxies nearby.
There are competing views regarding the nature of LBGs. In one view (Steidel et al. (1996b); Adelberger et al. (1998); Baugh et al. (1998); Governato et al. (1998) ,Mo, Mao, & White 1999), most LBGs are large galaxies quiescently forming stars at the bottom of the potential wells of massive dark matter halos. We refer to this idea as the “central quiescent” scenario. An alternate view (Lowenthal et al. (1997), Somerville, Primack, & Faber 1998) maintains that LBGs are mainly galactic starbursts triggered by collisions between small, gas-rich galaxies. We refer to this idea as the “collisional starburst” scenario.
Within the central quiescent scenario, there is roughly a one-to-one relationship between the LBGs and massive halos (Steidel et al. (1996b); Adelberger et al. (1998)). This helps explain the strong clustering of observed LBGs, since in CDM (Blumenthal et al. (1984)) theories of hierarchical structure formation, massive objects are more clustered than low-mass objects. It has been shown that the clustering properties of LBGs at can be reproduced within various CDM models if the LBGs are associated with the most massive collapsed dark-matter (DM) halos at that epoch (Jing & Suto (1998); Wechsler et al. (1998); Adelberger et al. (1998)). More detailed modeling appears generally consistent with the central quiescent framework (Baugh et al. (1998); Governato et al. (1998)).
Until the simulations reported here, there have been no predictions for clustering properties and only rough estimates of number densities of LBGs within the collisional starburst picture. Somerville, Primack, & Faber (1999) used a semi-analytic treatment in order to compare the properties of individual galaxies in the two scenarios, and argued that the high star formation rates, small emission line-widths (Pettini et al. (1998)) ( km/s), young ages (Sawicki & Yee (1998)) and high star formation surface densities (Lowenthal et al. (1997); Heckman et al. (1998)) of LBGs are more easily explained within the collisional starburst model. However, there were many unanswered questions since only simple approximations (Makino & Hut (1997)) were used to estimate the merger rate of sub-halos at high redshift and there was no way to calculate the spatial distribution of collisional starbursts.
In order to establish whether collisional starbursts are a plausible origin for LBGs, we now ask whether the collisions in hierarchical scenarios can match the observed number density and clustering properties. These questions are addressed in this letter using high resolution -body simulations. We first present the simulations and accompanying halo finder, and briefly explain our prescription for identifying collisions and estimating the resulting luminosity. The number density of the observed LBGs is then compared to the simulated number density as a function of redshift, and the correlation function for the simulated LBGs is presented.
Figure 1 can also be retrieved from http://physics.ucsc.edu/users/tsafrir/fig1.html (USA) or http://www.fiz.huji.ac.il/~tsafrir/fig1.html (Europe)
2 -body simulations and halo/collision finders
Only recently have cosmological -body simulations reached the stage where halo sub-structure can be resolved (e.g., Klypin et al. (1999)). Our simulations make use of the ART code (Kravtsov, Klypin, & Khokhlov 1997) which utilizes an adaptive grid to obtain the unprecedented resolution necessary for identifying collisions between well-resolved galactic halos (or sub-halos) in a cosmological volume. The simulations followed the evolution of the DM in the popular CDM model in which the present mass density of the Universe is , and a cosmological constant makes the Universe flat. The Hubble constant is (i.e., H Mpc-1), the primordial fluctuations are scale invariant, and the mass fluctuation amplitude is . Our main results are based on a simulation run down to with particle mass in a box, but we have also used another ART simulation with the same number of particles () in a box run to . We locate DM halos using a bound-density-maximum halo finder (Klypin et al. (1999)), now extended to cope with halo interactions and sub-structure (Bullock (1999)). Halos are modeled by the density profile (Navarro, Frenk, & White 1996) , which provides a characteristic radius (), virial radius () and mass (), and the associated fitting errors. The profile of a sub-halo may be truncated short of its . We treat only halos with ( particles). This is sufficient to resolve collisional starburst LBGs according to the luminosities assigned by our prescription (see below). Halo collisions are identified using pairs of stored simulation outputs at redshifts . For each halo at , we search for sets of particles that originated in different halos at . If the centers of two such sets overlap within their radii at , a collision is declared (Kolatt et al. (1999)). Figure 1 shows the locations of such collisions.

3 From collisions to bursts
We assume that each small DM halo at contains a gas-rich galaxy at its center and that each collision results in a starburst. Mergers are included not only between isolated halos, but also between “sub-halos” — halos that reside within the virial radius of larger halos. Note that the analytic predictions for merger rates obtained by Press-Schechter approximations (Lacey & Cole (1993)) are not sufficient here because they miss sub-halos of isolated systems, they are limited in predicting the progenitor mass spectrum (Somerville & Kolatt (1999)), and they ignore spatial correlations.
The top panel in Figure 2 shows the time-evolution of the number density of identified collisions as a function of look-back time, assuming a duration of visibility Myr. About one half of the collisions at involve sub-halos; such collisions would have been missed without these very high-resolution N-body simulations, which significantly supersede the cruder treatment of collisions in the semi-analytic investigation (Somerville et al. (1999b)). Unbound collisions (those in which the two halos are not subsequently bound) are not accounted for at all in the semi-analytic models. Also, the dynamical friction time scale used in SAMs tends to over-estimate the host – subhalo collision time scale (Kolatt et al. (1999)), the subhalo – subhalo collision approximation (Makino & Hut (1997)) is somewhat simplistic, and the progenitor mass spectrum is uncertain (Somerville & Kolatt (1999); Somerville et al. (1999a)). The collision rate per physical volume (not shown) declines for , in general agreement with theory (Lacey & Cole (1993)) and observations. This was determined for halos using our simulation in a larger volume with lower mass resolution.
To assess how many collisions should actually be observable, luminosities are assigned as follows. We assume that before a collision each galaxy has a cold-gas reservoir , where is the fraction of mass in baryons () and is the fraction of baryons in cold gas. We assume and . Based on simulations including gas dynamics and star formation (Mihos & Hernquist 1994a, 1994b, and our new simulations at with using an updated version of the same code), we divide the collisions into major () and minor collisions, and assume that during a burst of duration Myr, 75% and of the gas is converted into stars respectively. Gas depletion due to multiple collisions is ignored because we find that at most of the matter in colliding halos at has participated in a previous encounter. We estimate the apparent magnitude of collisional starbursts in the band equivalent to Å rest-frame, and , using Bruzual-Charlot (GISSEL98) stellar-population synthesis models (assuming solar metallicity and a Salpeter initial mass function). The upper heavy line in the bottom panel of Figure 2 shows the time-evolution of the number density of observable LBGs with , for the collisional starburst model. At , only burst events involving halos contribute to the population of galaxies ( at ). Because of compensating effects, varying both and star formation efficiency by factors of 2 either way results in changes in observable number density. The observed number densities of LBGs brighter than are shown for comparison, calculated from the latest data (Pozzetti et al. (1998); Adelberger et al. (1998); Steidel et al. (1998)) assuming the simulated cosmology. The predicted number densities are somewhat larger than those observed, and thus allow for dust extinction, which we have not included. The arrows on the data points result from assuming a (conservative) factor of three in dust extinction, coupled with the and luminosity functions estimated by recent ground observations (Steidel et al. (1998)).
For comparison, we show the predictions of a central quiescent model. We assume that every sufficiently massive halo hosts one LBG whose luminosity is tightly correlated with the halo mass, and we obtain an effective (constant) mass-to-light ratio () by adjusting the halo mass threshold at () to reproduce the observed abundance of LBGs (Steidel et al. (1998)). We then predict the density evolution assuming that is constant with redshift (note that a larger mass threshold is required at higher for a fixed apparent magnitude limit). This type of model generically predicts a steep fall-off in density towards higher , in contrast with the collisional scenario, and in apparent disagreement with the newest data (Steidel et al. (1998)) (solid diamonds). Redshift evolution is thus a key discriminant between the scenarios. The predictions of the simple model shown here are similar to those of more detailed central-quiescent models (Baugh et al. (1998); Somerville et al. (1999b)), but large uncertainties remain. Very different results can be obtained if the efficiency of star formation varies with redshift (Somerville et al. (1999b)).
4 Clustering properties
A key observed statistical property of the LBGs is the strong clustering they manifest. In the central quiescent model the number density of LBGs sets their mass scale. Analytic approximations (Mo et al. 1999) can then be used in order to derive their clustering properties. Here, since the collisions are selected by their dynamics, one must calculate clustering properties directly from the simulations.
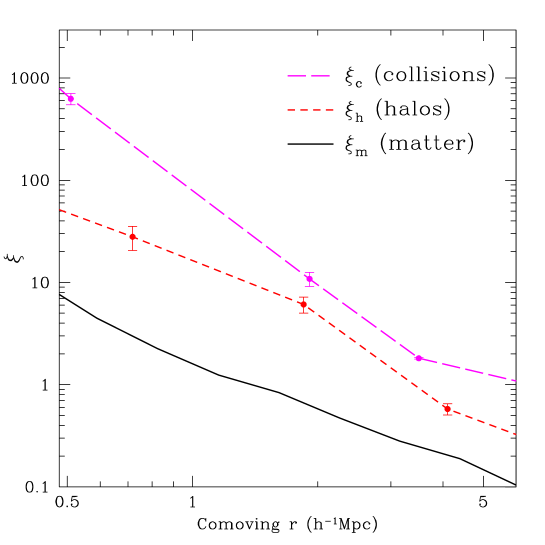
Figure 3 depicts the correlation function of the collisions. In the range , it can be approximated by a power law, , with and . Shown for comparison is for halos ; these are what the central quiescent scenario would identify with LBGs. Given current uncertainties, both correlation functions are consistent with the parameters derived from observations (Adelberger et al. (1998); Giavalisco et al. (1998)) for the simulated cosmology: and . Also shown for reference is of the underlying dark matter. The relative biases at are and . We find that of the collisions at occur within halos of mass , and that most of the rest occur in dense environments near such halos. This is consistent with the fact that the collisions are highly correlated and is confirmed by the similarity between the auto-correlation of collisions and the cross-correlation of collisions and halos of mass (at ). The combination of gravitational collapse and a collision rate proportional to the square of the halo number density can explain why collisions occur mainly near the most massive halos. A visual confirmation of this trend can be gathered from Figure 1.
5 Conclusions
The results presented here provide the first quantitative results on the clustering of colliding halos at high redshift and a much more accurate measure of their number density than earlier semi-analytic calculations (Somerville et al. 1999), which these new results generally confirm. In particular, they show that starbursts associated with collisions of relatively low mass halos are consistent with the observed number density and clustering of bright LBGs at , at least in the CDM cosmology; other popular cosmologies should be qualitatively similar (Somerville et al. (1999b); Wechsler et al. (1998)). Finally, they predict that a key test between models is the number of LBGs vs. redshift, which falls off much faster in the central quiescent scenario than for collisional starbursts. In addition to further tests, such as the luminosity function and virial mass measurements, this should ultimately distinguish between these scenarios.
References
- Adelberger et al. (1998) Adelberger, K., Steidel, C., Giavalisco, M., Dickinson, M., Pettini, M., & Kellogg, M. 1998, ApJ, 505, 18
- Baugh et al. (1998) Baugh, C., Cole, S., Frenk, C., & Lacey, C. 1998, ApJ, 498, 501
- Blumenthal et al. (1984) Blumenthal, G., Faber, S., Primack, J., & Rees, M. 1984, Nat, 311, 517
- Bullock (1999) Bullock, J. 1999, Ph.D. thesis, University of California, Santa Cruz
- Dickinson (1998) Dickinson, M. 1998, in S. F. M. Livio, P. Madau (eds.), The Hubble Deep Field, Cambridge: Cambridge University Press
- Giavalisco et al. (1998) Giavalisco, M., Steidel, C., Adelberger, K., Dickinson, M., Pettini, M., & Kellogg, M. 1998, ApJ, 503, 503
- Governato et al. (1998) Governato, F., Baugh, C., Cole, S., Lacey, C., Quinn, T., & Stadel, J. 1998, Nature, 392, 359
- Heckman et al. (1998) Heckman, T., Robert, C., Leitherer, C., Garnett, D., & van der Rydt, F. 1998, ApJ, 503, 646
- Jing & Suto (1998) Jing, Y. & Suto, Y. 1998, ApJ, 494, L5
- Klypin et al. (1999) Klypin, A., Gottlöber, S., Kravtsov, A., & Khokhlov, A.M. 1999, ApJ, in press
- Kolatt et al. (1999) Kolatt, T., Bullock, J., Sigad, Y., Primack, J., Dekel, A., Kravtsov, A., & Klypin, A. 1999, in preparation
- Kravtsov et al. (1997) Kravtsov, A. V., Klypin, A. A., & Khokhlov, A. M. 1997, ApJS, 111, 73
- Lacey & Cole (1993) Lacey, C. & Cole, S. 1993, MNRAS, 262, 627
- Lowenthal et al. (1997) Lowenthal, J., Koo, D., Guzman, R., Gallego, J., Phillips, A., Faber, S., Vogt, N., Illingworth, G., & Gronwall, C. 1997, ApJ, 481, 673
- Makino & Hut (1997) Makino, J. & Hut, P. 1997, ApJ, 481, 83
- Mihos & Hernquist (1994) Mihos, J. & Hernquist, L. 1994a, ApJ, 425, L13
- Mihos & Hernquist (1994) Mihos, J. & Hernquist, L. 1994b, ApJ, 431, L9
- Mo et al. (1999) Mo, H., Mao, S., & White, S. 1999, MNRAS, 304, 175
- Navarro et al. (1996) Navarro, J., Frenk, C., & White, S. 1996, ApJ, 462, 563
- Pettini et al. (1998) Pettini, M., Kellogg, M., Steidel, C., Dickinson, M., Adelberger, K., & Giavalisco, M. 1998, ApJ, 508, 508
- Pozzetti et al. (1998) Pozzetti, L., Madau, P., Zamorani, G., Ferguson, H. C., & Bruzual, A. G. 1998, MNRAS, 298, 1133
- Sawicki & Yee (1998) Sawicki, M. & Yee, H. 1998, AJ, 115, 1329
- Somerville & Kolatt (1999) Somerville, R. & Kolatt, T. 1999, MNRAS, in press
- Somerville et al. (1999a) Somerville, R., Lemson, G., Kolatt, T., & Dekel, A. 1999a, MNRAS, accepted
- Somerville et al. (1999b) Somerville, R., Primack, J., & Faber, S. 1999b, MNRAS, in press
- Steidel et al. (1998) Steidel, C., Adelberger, K., Giavalisco, M., Dickinson, M., Pettini, & M. a. 1998, ApJ, submitted, astro-ph/9811399
- Steidel et al. (1996a) Steidel, C., Giavalisco, M., Dickinson, M., & Adelberger, K. 1996a, AJ, 112, 352
- Steidel et al. (1996b) Steidel, C., Giavalisco, M., Pettini, M., Dickinson, M., & Adelberger, K. 1996b, ApJ, 462, L17
- Wechsler et al. (1998) Wechsler, R., Gross, M., Primack, J., Blumenthal, G., & Dekel, A. 1998, ApJ, 506, 19