A Na I Absorption Map of the Small-Scale Structure in the Interstellar Gas Toward M15
Abstract
Using the DensePak fiber optic array on the KPNO WIYN telescope, we have obtained high S/N echelle spectra of the Na I D wavelength region toward the central 27 x 43 of the globular cluster M15 at a spatial resolution of 4. The spectra exhibit significant interstellar Na I absorption at LSR velocities of 3 km s-1 (LISM component) and 68 km s-1 (IVC component). Both components vary appreciably in strength on these scales. The derived Na I column densities differ by a factor of 4 across the LISM absorption map and by a factor of 16 across the IVC map. Assuming distances of 500 pc and 1500 pc for the LISM and IVC clouds, these maps show evidence of significant ISM structure down to the minimum scales of 2000 AU and 6000 AU probed in these absorbers. The smallest-scale (Na I) variations observed in the M15 LISM and IVC maps are typically comparable to or higher than the values found at similar scales in previous studies of interstellar Na I structure toward binary stars. The physical implications of the small and larger-scale Na I features observed in the M15 maps are discussed in terms of variations in the H I column density as well as in the Na ionization equilibrium.
1 Introduction
The evidence for significant subparsec-scale structure in the diffuse interstellar medium (ISM) has been accumulating recently through measurements of H I 21 cm absorption toward high-velocity pulsars (Frail et al. (1994)) and extended extragalactic radio sources (Faison et al. (1998)) as well as optical observations of the interstellar Na I D absorption toward globular clusters (Bates et al. (1995)) and binary stars (Meyer & Blades (1996); Watson & Meyer (1996)). At the pulsar (10 to 102 AU), binary (102 to 104 AU), and globular cluster (104 to 106 AU) scales sampled, all of these observations imply dense concentrations of atomic gas ( 103 cm-3) in otherwise diffuse sightlines. The apparent ubiquity of this structure should be accounted for in any successful ISM model. However, due to their large overpressures with respect to the intercloud medium, such small-scale condensations cannot be accomodated in any abundance by the standard McKee & Ostriker (1977) pressure equilibrium model for the ISM. Heiles (1997) has proposed a geometric solution where this apparent structure is due to filaments or sheets of lower density gas aligned along a given sightline that produce significant column density differences (and spuriously high inferred volume densities) over transverse length scales as small as 30 AU. In an approach that removes the requirement of pressure equilibrium, Elmegreen (1997) proposes a fractal ISM model driven by turbulence that produces self-similar structure down to the smallest scales.
A chief limitation impacting the interpretation of the diffuse ISM structures observed to date has been the rather poor small-scale sightline coverage. In particular, each binary sightline samples the structure at only one scale along one direction. The few globular cluster studies have typically involved 10 to 15 stars and have sampled only relatively large separations. However, the bright extended cores of some globulars do provide a background source suitable for mapping the absorption-line structure of intervening gas at much higher spatial resolution, in two dimensions and with full sampling. With a core -band surface brightness of 14.21 mag arcsec-2 (Harris (1996)) falling to about 18 mag arcsec-2 at a radius of 30 (Hertz & Grindlay (1985)), the best example of such a cluster is M15 ( 10.4 0.8 kpc; 99 km s-1). Spectra of selected stars in M15 have revealed significant interstellar Na I absorption at 3 and 68 km s-1 that varies in strength on scales ranging from about 1 to 15 (Lehner et al. (1999); Pilachowski et al. (1998); Kennedy et al. (1998); Langer, Prosser, & Sneden (1990)). In this Letter, we present a fully-sampled, two-dimensional map of the Na I absorption over the central 27 x 43 of M15 as part of a new effort to probe the patterns of such variations down to scales of a few arc seconds.
2 Observations
The M15 observations were obtained in 1998 August using the DensePak fiber optic array and Bench spectrograph on the 3.5 m WIYN222The WIYN Observatory is a joint facility of the University of Wisconsin-Madison, Indiana University, Yale University, and the National Optical Astronomy Observatories. telescope at Kitt Peak National Observatory. The DensePak array consists of 91 fibers bonded into a 7 x 13 rectangle that covers 27 x 43 of sky with center-to-center fiber (3 diameter) spacings of 4 at the WIYN F/6.4 Nasmyth focus (Barden, Sawyer, & Honeycutt (1998)). The observations were conducted with the centermost fiber positioned at the center of M15 (RA 21h 29m 58.3s, Dec 12 10 00 (J2000.0)) and the major axis of the array aligned along a NS direction. The spectrograph was configured with the Bench camera, a Tek2048 CCD (T2KC), the Echelle grating, and an interference filter (X17) providing spectral coverage from 5725 to 5975 Å at a 2.2 pixel resolution of 0.27 Å or 14 km s-1.
Utilizing this instrumental setup in queue mode, a total of four 1300 s exposures were taken of M15 under sky conditions characterized by 1 seeing. These raw CCD frames were bias-corrected, sky-subtracted (using a 1300 s exposure of adjacent blank sky), flat-fielded, combined, and wavelength-calibrated using the NOAO IRAF data reduction package to extract the net spectrum yielded by each fiber. Based on previous observations with the Bench spectrograph Na I setup and on data comparisons with the KPNO 4-m echelle spectrograph, the uncertainty in the zero level of these spectra due to uncorrected scattered light effects should be less than 3%. Accounting for 5 broken fibers and 3 others with low counts, 83 of the 91 fibers produced usuable spectra with S/N ratios ranging from 30 at some edgepoints of the array to over 150 nearer the center. In order to remove the telluric absorption in the vicinity of the Na I D2 5889.951 and D1 5895.924 lines, these spectra were all divided by an atmospheric template based on observations of several rapidly-rotating early-type stars with little intervening interstellar matter. Figure 1 displays the resulting Na I spectra for the center of M15 and three positions of various separations and angles with respect to the center. Three Na I doublets are apparent and well-separated in velocity in all of these spectra the bluemost is due to stellar Na I absorption in M15, the middle or “local ISM” (LISM) component is due to interstellar gas at 3 km s-1, and the redmost or “intermediate velocity” (IVC) component is due to presumably more distant gas at 68 km s-1. It is also apparent from Figure 1 that both the LISM and IVC Na I absorption toward M15 exhibit significant variations on scales much less than 1. Over the whole map, the equivalent width of the Na I D1 line varies from 180 to 365 mÅ for the LISM component and from 40 to 155 mÅ for the IVC component.
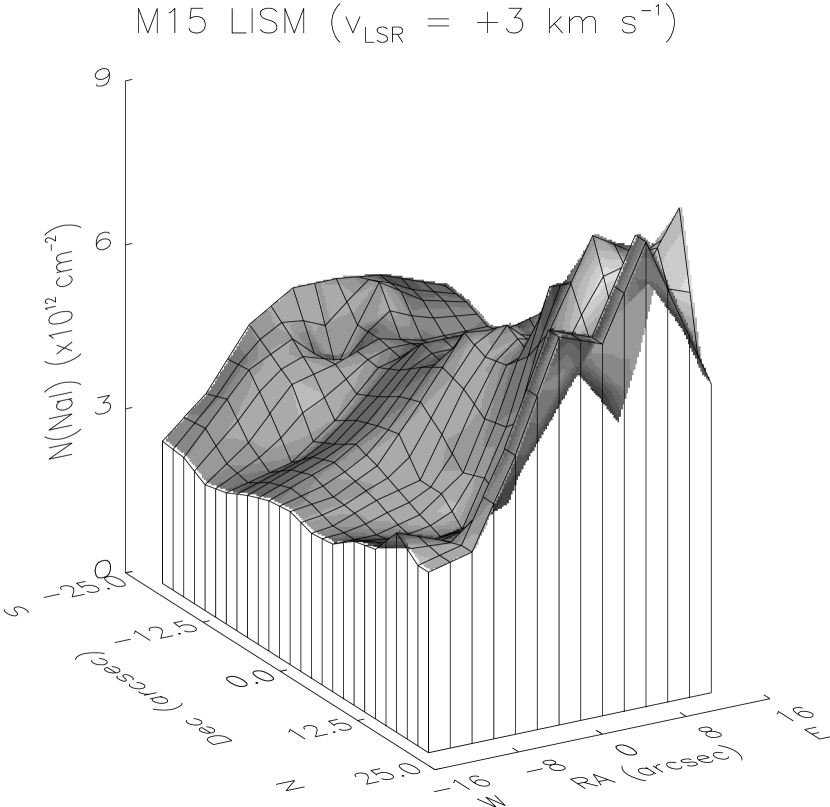
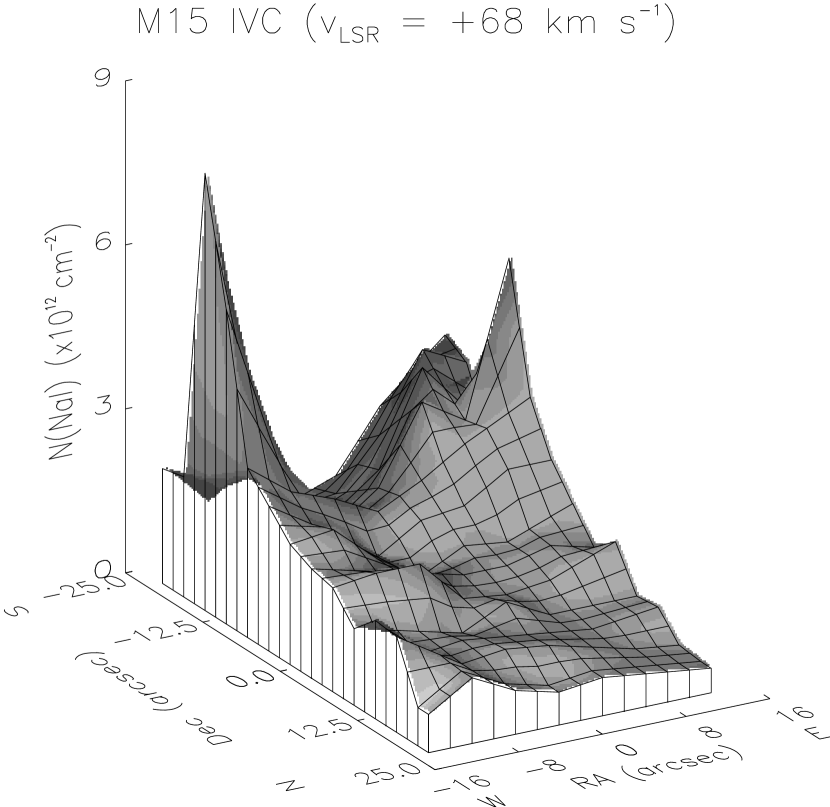
In terms of a surface map, Figures 2 and 3 show how the Na I columns corresponding to the LISM and IVC components vary across the face of M15 at the 4 fiber resolution. These column densities were measured using the FITS6p profile-fitting package (Welty, Hobbs, & Kulkarni (1994)) to simultaneously fit the D2 and D1 lines in each fiber, assuming single-component Voigt profiles for both the LISM and IVC Na I doublets. Based on the higher resolution ( 9.8 km s-1) Na I data of Kennedy et al. (1998) for two stars in M15, this assumption should be reasonable for estimating the IVC column density but is definitely an approximation to the multicomponent LISM absorption structure. In the case of the IVC fits, the derived velocities exhibit a marginal increase of 1 km s-1 from N to S across the map and the derived line widths (-values) are typically near 3 km s-1 with some as low as 2.2 km s-1. The lowest IVC Na I column densities in Figure 3 correspond to the weakest lines and have formal profile-fitting uncertainties of about 10-20%. The highest IVC Na I columns are more uncertain but should be accurate to within a factor of two unless the profiles are dominated by unresolved saturated structure that would mask even higher columns. In the case of the LISM fits, the derived -values (typically near 8 km s-1) lead to Na I columns in Figure 2 that are probably underestimates of the “true” multicomponent values but that are illustrative of the net equivalent width variations.
The only potential sources of stellar contamination in measuring the LISM and IVC Na I absorption are the Ni I 5892.883 and Ti I 5899.304 lines that would be located on the blue wing of the IVC D2 feature and near the center of the IVC D1 line, respectively. Based on the F3 composite spectral type and low metallicity ([Fe/H] 2.17) of M15 as well as the weakness of the occasional excess absorption observed on the blue wing of the IVC D2 line (which is mostly excluded by the single-component fit), the impact of any stellar contamination on our derived column densities is likely to be appreciably less than the fitting uncertainties (Montes, Ramsey, & Welty (1999)). The appearance of coherent structures in Figures 2 and 3 suggests that the uncertainties due to stellar line contamination are indeed smaller than those due to the profile fitting.
3 Discussion
In order to discuss the ISM structure observed toward M15 in terms of its physical length scales, it is necessary to estimate the distances to the LISM and IVC clouds. Given that Albert et al. (1993) have measured weak Ca II absorption near 0 km s-1 toward HD 204862 ( 100 pc; 0.3 separation from M15) and a much stronger line toward HD 203699 ( 500 pc; 2.5 separation), we will assume a distance of 500 pc for the M15 LISM absorption that should at least be an upper limit for the clouds comprising this column. In the case of the IVC component, Na I absorption has been seen at a similar velocity toward HD 203664 whose distance is about 3.2 kpc and angular separation from M15 is 3.1 (Little et al. (1994); Sembach (1995); Ryans, Sembach, & Keenan (1996)). We will assume a distance of 1500 pc for the IVC absorber which should be accurate to within a factor of two. At these distances, the 27 x 43 coverage of the DensePak array corresponds to a 13,500 x 21,500 AU (0.065 x 0.10 pc) section of the LISM clouds and a 40,500 x 64,500 AU (0.20 x 0.31 pc) portion of the IVC cloud. The 4 fiber spacing translates to spatial resolutions of 2000 and 6000 AU for the LISM and IVC absorbers, respectively. The Na I column densities are typically higher in the LISM clouds with individual fiber values ranging from 2.3 x 10¹² to 8.5 x 1012 cm-2. Over the minimum 2000 AU scale, the maximum (Na I) variation observed is 3.0 x 1012 cm-2 and the median (Na I) is 4.5 x 1011 cm-2. In the case of the IVC cloud, the dynamic range in (Na I) is greater with values stretching from 5.0 x 10¹¹ to 8.0 x 1012 cm-2. The maximum (Na I) variation observed over the minimum 6000 AU scale in this cloud is 5.9 x 1012 cm-2 and the median (Na I) is 3.0 x 1011 cm-2.
Since the minimum scales probed by our M15 observations overlap with those involving studies of interstellar Na I toward binary stars, it is important to compare their evidence for small-scale ISM structure. The binary studies involve about 20 early-type systems with projected linear separations mostly between 500 and 7000 AU and typical distances within several hundred pc (Meyer & Blades (1996); Watson & Meyer (1996)). Based on high-resolution ( 1.5 km s-1) Na I observations, they find variations in at least one velocity component toward each system that are collectively indicative of ubiquitous small-scale structure. The M15 observations probe a sightline that is much longer and has a larger Na I column than most of these binaries at appreciably lower velocity resolution. Also, whereas each star in a binary provides a single extremely narrow beam (0.0001) through the intervening ISM, each DensePak fiber samples a number of such beams from the closely-spaced stars in the core of M15 and thus should smear out any imprint of structure on scales appreciably smaller than the 3 fiber diameter. Nevertheless, the smallest-scale (Na I) variations observed in the M15 LISM and IVC clouds are typically comparable to or larger than the values toward the binary stars. For example, the integrated column density difference of 2.0 x 1011 cm-2 across the Na I profile toward the binary Cru (6600 AU separation) (Meyer & Blades (1996)) is similar to the median (Na I) of 3.0 x 1011 cm-2 measured at the 6000 AU resolution of the M15 IVC observations. Since a circumstellar explanation cannot be completely ruled out for at least some of the binary Na I variations, the M15 observations are important in providing clear evidence of significant ISM structure on comparably small scales where there is absolutely no possibility of circumstellar contamination.
The key distinction between these M15 observations and the binary studies is that here we image two “clouds” in two spatial dimensions at a variety of scales whereas each binary probe provides only a single measurement of a single scale for each intervening cloud. In comparing the characteristics of the LISM and IVC maps, the texture of the LISM structure appears to be generally smoother with larger angular features than in the IVC gas. This difference could be due to the greater IVC distance or to the superposition of structures at different distances within the LISM absorption profile. An interesting feature of the LISM map is how (Na I) goes from a relatively constant value along the entire 21,500 AU length of the western edge to a generally 50% higher value as one moves about 5000 AU to the east. A 5000 AU separation binary oriented NS would not be very sensitive to this feature whereas an EW orientation would yield a strong signal of small-scale structure. The most striking aspect of the IVC map is in the southern region where the Na I column density dives from 8.0 x 1012 cm-2 on the WSW edge to 1.3 x 1012 cm-2 and then back up to 5.6 x 1012 cm-2 on the ESE edge over a total straight-line distance of 41,000 AU. This behavior is more suggestive of a clumpy structure with characteristic scales of 10,000 AU and peak Na I column densities that can rise at least 5 times above the adjacent background.
Unfortunately, since Na I is generally not a dominant ion in H I clouds, the physical interpretation of the Na I structure apparent in Figures 2 and 3 is not clear. However, studies of Galactic diffuse clouds have shown that when (Na I) 1012 cm-2, empirical relationships can be utilized to estimate (H) from (Na I) to within a factor of two (Hobbs (1974); Stokes (1978); Welty, Hobbs, & Kulkarni (1994)). Applying these relationships to the significant southern clumps in the M15 IVC map results in (H) 5 x 1020 cm-2 and 1000 cm-3 (assuming a roughly spherical geometry). Interestingly, Kennedy et al. (1998) have mapped the H I 21 cm emission of the IVC cloud in the vicinity of M15 at 12 resolution and found significant clumpy structure on these scales with the highest column density ((H I) 4 x 1019 cm-2) centered on the cluster and a quick dropoff ((H I) 1019 cm-2) on a 0.5 scale. The fact that the peak IVC H column inferred from the Na I data is about 10 times greater than that from the 21 cm observations implies that either there is significant H I clumpiness within the radio beam or the (Na I)/(H) ratio in the IVC can be significantly higher than that typically observed in the diffuse ISM. In the case of the former, this result would have important implications for determining the metallicities of such halo clouds (both IVCs and their higher-velocity HVC brethren). Metallicities of 25% and 10% solar have recently been derived for two HVCs by comparing UV absorption measures of their S II abundances toward background quasars with much broader (1) 21 cm emission beam measures of the intervening HVC H I columns (Lu et al. (1998); Wakker et al. (1999)). If HVCs generally exhibit H I structure of the magnitude and scale implied by the M15 IVC Na I data, these metallicities could seriously be in error. The metallicity question is important to resolve because it has a direct bearing on the interpretation of HVCs as primarily Galactic in origin through fountain phenomena (Shapiro & Field (1976); Bregman (1980)) or as infalling lower metallicity extragalactic matter (Blitz et al. (1999)).
At the same time, it is possible that (Na I)/(H) rather than (H) is varying on small scales in the M15 IVC cloud. Lauroesch et al. (1998) have discovered that the (Na I) differences observed toward the binary Cru are not seen in the dominant ion Zn II (which should mirror variations in (H)). They suggest that these differences are due to small-scale variations in the Na ionization equilibrium that are driven by temperature and/or electron density fluctuations. Although the most significant (Na I) variations in the M15 IVC and LISM maps are appreciably greater than those toward Cru, it is important to note that small fluctuations in can amplify (Na I) since the Na I column should scale roughly as if is proportional to (Péquignot & Aldrovandi (1986)). For example, the highest (Na I) peaks in the IVC map could be produced by increasing by a factor of 2.3 over adjacent background without any change in (H I). However, if / is not a constant (as might be expected if partial H ionization augments the electron supply from C photoionization), the IVC (Na I) variations could be less reflective of and more indicative of appreciable small-scale fluctuations. Of course, it is not clear how such fluctuations could occur in a cloud of low extinction far from any ionizing source.
In summary, our observations show that the LISM and IVC gas toward M15 exhibits significant structure in terms of its physical conditions and/or H I column density down to arc second scales. Although our sky coverage is too limited to analyze the observed patterns in detail over their full extent, it does appear that the Na I data rule out both a very flat distribution on the 27 x 43 scale of the DensePak array and a random distribution on the 4 scale of the individual fibers. Through further interstellar absorption-line mapping of M15 and other globulars with fiber arrays like DensePak, it will be possible to increase this sky coverage and characterize the spatial structure of diffuse clouds in the Galactic disk and halo over a large range of physically-interesting scales that are difficult to probe otherwise.
References
- Albert et al. (1993) Albert, C. E., Blades, J. C., Morton, D. C., Lockman, F. J., Proulx, M., & Ferrarese, L. 1993, ApJS, 88, 81
- Barden, Sawyer, & Honeycutt (1998) Barden, S. C., Sawyer, D. G., & Honeycutt, R. K. 1998, Proc. SPIE, 3355, 892
- Bates et al. (1995) Bates, B., Shaw, C. R., Kemp, S. N., Keenan, F. P., & Davies, R. D. 1995, ApJ, 444, 672
- Blitz et al. (1999) Blitz, L., Spergel, D. N., Teuben, P. J., Hartmann, D., & Burton, W. B. 1999, ApJ, 514, 818
- Bregman (1980) Bregman, J. N. 1980, ApJ, 236, 577
- Elmegreen (1997) Elmegreen, B. G. 1997, ApJ, 477, 196
- Faison et al. (1998) Faison, M. D., Goss, W. M., Diamond, P. J., & Taylor, G. B. 1998, AJ, 116, 2916
- Frail et al. (1994) Frail, D. A., Weisberg, J. M., Cordes, J. M., & Mathers, C. 1994, ApJ, 436, 144
- Harris (1996) Harris, W. E. 1996, AJ, 112, 1487
- Heiles (1997) Heiles, C. 1997, ApJ, 481, 193
- Hertz & Grindlay (1985) Hertz, P., & Grindlay, J. E. 1985, ApJ, 298, 95
- Hobbs (1974) Hobbs, L. M. 1974, ApJ, 191, 381
- Kennedy et al. (1998) Kennedy, D. C., Bates, B., Keenan, F. P., Kemp, S. N., Ryans, R. S. I., Davies, R. D., & Sembach, K. R. 1998, MNRAS, 297, 849
- Langer, Prosser, & Sneden (1990) Langer, G. E., Prosser, C. F., & Sneden, C. 1990, AJ, 100, 1
- Lauroesch et al. (1998) Lauroesch, J. T., Meyer, D. M., Watson, J. K., & Blades, J. C. 1998, ApJ, 507, L89
- Lehner et al. (1999) Lehner, N., Rolleston, W. R. J., Ryans, R. S. I., Keenan, F. P., Bates, B., Pollacco, D. L., & Sembach, K. R. 1999, A&AS, 134, 257
- Little et al. (1994) Little, J. E., Dufton, P. L., Keenan, F. P., Conlon, E. S., & Davies, R. D. 1994, ApJ, 427, 267
- Lu et al. (1998) Lu, L., Savage, B. D., Sembach, K. R., Wakker, B. P., Sargent, W. L. W., & Oosterloo, T. A. 1998, AJ, 115, 162
- McKee & Ostriker (1977) McKee, C. F., & Ostriker, J. P. 1977, ApJ, 218, 148
- Meyer & Blades (1996) Meyer, D. M., & Blades, J. C. 1996, ApJ, 464, L179
- Montes, Ramsey, & Welty (1999) Montes, D., Ramsey, L. W., & Welty, A. D. 1999, ApJS, in press
- Péquignot & Aldrovandi (1986) Péquignot, D., & Aldrovandi, S. M. V. 1986, A&A, 161, 169
- Pilachowski et al. (1998) Pilachowski, C., Langer, E., Sneden, C., & Kraft, R. 1998, BAAS, 30, 870
- Ryans, Sembach, & Keenan (1996) Ryans, R. S. I., Sembach, K. R., & Keenan, F. P. 1996, A&A, 314, 609
- Sembach (1995) Sembach, K. R. 1995, ApJ, 445, 314
- Shapiro & Field (1976) Shapiro, P. R., & Field, G. B. 1976, ApJ, 205, 762
- Stokes (1978) Stokes, G. M. 1978, ApJS, 36, 115
- Wakker et al. (1999) Wakker, B. P., Howk, J. C., Savage, B. D., Tufte, S. L., Reynolds, R. J., van Woerden, H., Schwarz, U. J., & Peletier, R. F. 1999, in Stromlo Workshop on High-Velocity Clouds, ed. B. K. Gibson & M. E. Putnam (San Francisco: ASP), in press
- Watson & Meyer (1996) Watson, J. K., & Meyer, D. M. 1996, ApJ, 473, L127
- Welty, Hobbs, & Kulkarni (1994) Welty, D. E., Hobbs, L. M., & Kulkarni, V. P. 1994, ApJ, 436, 152