The First Light seen in the redshifted 21–cm radiation
Abstract
We show how the investigation of the redshifted 21–cm radiation can give insight into the development of structures in the early universe (at redshifts ). In particular we investigate: the epoch of the first light; the fluctuations in the redshifted 21–cm emission induced by the density inhomogeneities in CDM dominated universes; the emission and absorption shells that are generated around the first bright quasars. Such features can be observed with the next generation radio facilities.
-
(1) Space Telescope Science Institute
3700 San Martin Drive, Baltimore MD 21218
-
(2)Department of Physics and Astronomy
The Johns Hopkins University, Baltimore, MD 21218
-
(3)Institute of Astronomy
Madingley Road, Cambridge CB3 0HA, UK
-
(4)Institute for Astronomy, University of Edinburgh
Royal Observatory, Edinburgh EH9 3HJ, UK
1 The general framework
The diffuse Intergalactic Medium (IGM) at very high redshift (between recombination and full reionization at ) can be observed in the redshifted 21–cm radiation against the cosmic background. The signal can be detected in emission or in absorption depending on whether the spin temperature is larger or smaller than the cosmic background temperature .
This can happen if is coupled via collisions to the kinetic temperature of the IGM. However, the density contrast on Mpc scales at very early epochs is so low that the collision coupling is inefficient, and therefore the IGM is expected to be invisible against the CMB (Madau, Meiksin & Rees, 1998 [1], hereafter MMR). On the other hand, large, massive regions at high density contrast are extremely rare in most of the hierarchical CDM universes at such high redshifts.
There is a however another mechanism that makes the diffuse hydrogen visible in the redshifted 21cm line: the Wouthuysen-Field effect. In this process, a Ly photon field mixes the hyperfine levels of neutral hydrogen in its ground state via intermediate transition to the state. A detailed picture of the Wouthuysen-Field effect can be found in Meiksin (1999, [2]) and Tozzi, Madau, Meiksin & Rees (1999, [3], hereafter TMMR). The process effectively couples to the color temperature of a given Ly radiation field (Field 1958, [4]). The color temperature is easily driven toward the kinetic temperature of the diffuse IGM due to the large cross section for resonant scattering (Field 1959, [5]). In this case the spin temperature is:
| (1) |
where , and is the total rate at which Ly photons are scattered by an hydrogen atom.
However, the same Ly photon field also re–heats the diffuse gas, driving toward larger values. The thermal history of the diffuse IGM then results from the competition between adiabatic cooling due to the cosmic expansion and re–heating due to the photon field. In the absence of a contribution from a strong X-ray background, the thermal history of the IGM can be written simply as:
| (2) |
where is the heating rate due to recoil of scattered Ly photons. Here is the mean molecular weight for a neutral gas with a fractional abundance by mass of hydrogen equal to 0.75.
Prior to the generation of the photon field, the IGM is neutral and cold, at a temperature (Couchman 1985, [6]) given only by the adiabatic cooling after recombination. At the onset of the re–heating sources, there will be coupling between the kinetic and the spin temperature. An observation at the frequency MHz will detect absorption or emission against the CMB, with a variation in brightness temperature with respect to the CMB value:
| (3) |
where is the curvature contribution to the present density parameter, is the cosmological constant, is the baryon density, and .
Observations of such variation in the brightness temperature can be used to investigate the thermal history of the IGM, and the underlying birth and evolution of the radiation sources. All the following results are presented and discussed in TMMR ([3]).
2 The epoch of the First Light
We first investigate a simple situation in which, at a given redshift , the Ly photon field reaches a thermalization rate ; for such a value is driven effectively toward (see MMR, [1]). If the IGM is heated only by the same Ly photons, there will be a transient epoch where , (i.e., ) and an absorption feature appears at the corresponding redshifted frequency. This effect necessarily has a limited extension in time and thus in frequency space, since becomes larger than on a relatively short timescale. However, the signal is easily detectable with a resolution of few MHz, and, most of all, has a large effect since when . Such a strong feature marks the transition from a cold and dark universe, to a universe populated with radiation sources.

If we assume that the Ly field reaches the thermalization value when on a timescale Myrs, the IGM will be visible in absorption for Myrs, corresponding to mK over a range of MHz. In the top panel of figure 1 such a signature is shown as a function of the observed frequency. In the bottom panel the corresponding thermal evolution for the IGM is shown.

Such results are weakly dependent on the epoch and on the adopted cosmology. However, the amplitude of the detected signal will be strongly dependent on the timescale on which the Ly field reaches the thermalization value. In figure 2 the maximum of the absorption is plotted for different timescales in three representative cosmologies. The signal is always larger than 10 mK; note however that for Myr, the absorption is spread out over a large interval in frequency, especially at MHz where the sensitivity of radio telescopes becomes lower (see TMMR).
3 The density field
After re–heating and before reionization, holds, and the IGM is detectable only in emission. However, always, and the effect due to the continuum distribution of a diffuse IGM is not as strong as in the absorption case. Such a small positive offset with respect to the CMB background can be difficult to detect. On the other hand, fluctuations in the redshifted 21–cm emission, which reflect fluctuations in the density of the IGM, are at least two orders of magnitude larger than the intrinsic CMB fluctuations on scales of arcmin.
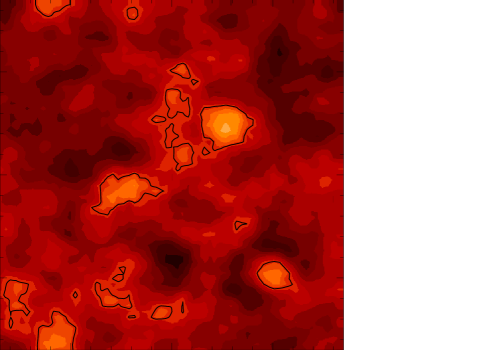
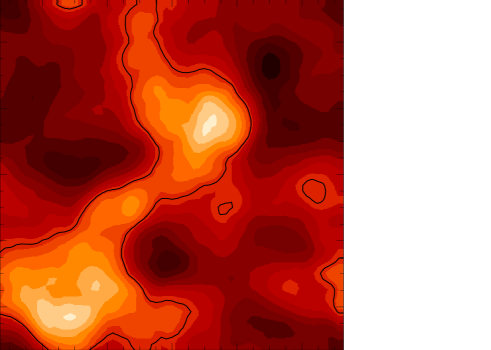
These fluctuations correspond to scales of a few comoving Mpc, and are in the linear regime at . In this case the fluctuations induced in the brightness temperature will be directly proportional to , allowing a straightforward reconstruction of the perturbation field at that epoch. In figure 3 and 4 we show results for two cosmologies, a tilted CDM universe with critical density (tCDM), and an open universe (OCDM). In both cases the fluctuations are normalized to reproduce the local abundance of clusters of galaxies. In OCDM the fluctuations are much larger (a factor of 3) since the evolution of the perturbation is strongly suppressed in an open universe with respect to the critical case, and for a given local normalization, the amplitude of the perturbations at high is correspondingly larger. In both figures the density field has been evolved with a collisionless N–body simulation of 643 particles using the Hydra code (Couchman, Thomas, & Pearce 1995, [7]). The box size is comoving Mpc, corresponding to 17 (11) arcmin in tCDM (OCDM). The baryons are assumed to trace the dark matter distribution without any biasing. Since the level of fluctuations ranges from a few to Jy per beam (with a resolution of 2 arcmin), it seems possible that observations with the Square Kilometer Array (Braun 1998, [8], see also http://www.nfra.nl.skai) may be used to reconstruct the matter density field at redshifts between the epoch probed by galaxy surveys and recombination, on scales as small as comoving Mpc, i.e. masses in the range between and .
4 The first quasars
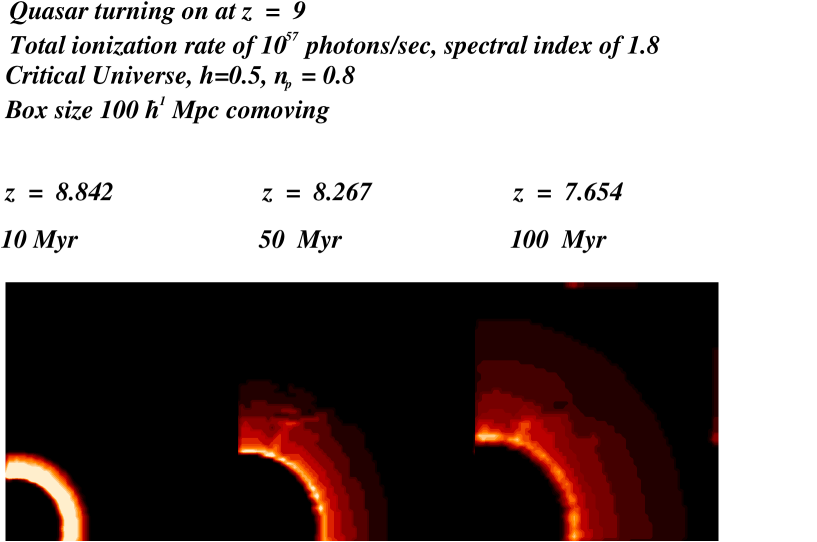
If re–heating is provided by a single quasar (without any other source of radiation), 21–cm emission on Mpc scales will be produced in the quasar neighborhood (outside the HII bubble) as the medium surrounding it is heated to by soft X-rays from the quasar itself. The size and intensity of the detectable 21–cm region will depend on the quasar luminosity and age. In particular the intensity in the emission weakens with radius and with the age of the quasar.
We calculated the kinetic temperature around a typical quasar, along with the neutral IGM fraction and Ly flux. The resulting radial temperature profiles were then superimposed on the surrounding density fluctuations as computed using Hydra. In figure 5 a sequence of snapshots after 10, 50 and 100 Myr after the birth of a quasar at are shown in a box of 100 Mpc (comoving). The visual effect is due to the convolution of the spin temperature profile with the (linearly) perturbed density field around the quasar. The temperature of the IGM at great distances from the quasar is assumed to be , and the signal goes to zero. In the figure the color ranges from 0 to mK with respect to the CMB level, which is black.
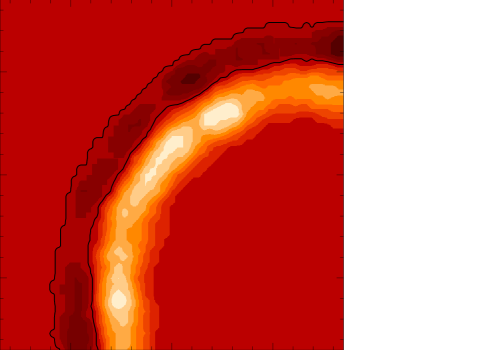
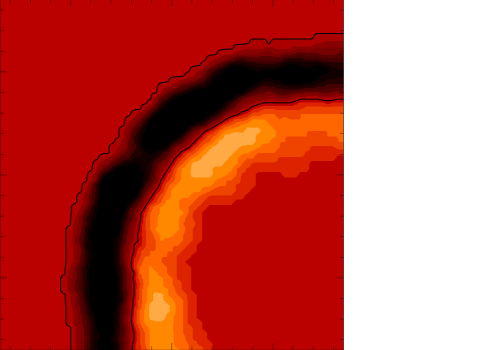
Another situation occurs when the temperature of the IGM at large distances from the quasar is lower than , e.g., K. In this case the emission region is followed by an absorption ring, since the Ly photons reach regions where . The radio map resulting from a quasar ‘sphere of influence’ 10 Myr after it turns on at (tCDM) is shown in figure 6. The signal ranges from about Jy to Jy per beam (with a 2 arcmin resolution). The absorption region is limited to a very sharp edge. However, in figure 7 we show a quasar with the same Ly luminosity but with an intrinsic exponentially absorbed spectrum at energies larger than the Lyman limit. Consequently the HII region is reduced, and the X–ray warming front is well behind the light radius. This occurrence leads to a larger absorption ring where the signal reaches Jy in a 2 arcmin beam.
Imaging the gas surrounding a quasar in 21–cm emission could provide a direct means of measuring intrinsic properties of the source, like the emitted spectrum and the opening angle of quasar emission. All these features are within reach of the new generation radio telescopes like SKA.
5 Conclusions
The Wouthuysen-Field effect allows one to peer into the Dark Age. The observation of the neutral IGM in the redshifted 21–cm can give insight into the thermal evolution of the diffuse hydrogen and thus into the formation and evolution of radiation sources, at epochs when the age of the universe is only Gyrs. In particular, the epoch of the First Light can be seen as a deep ( mK) absorption feature a few MHz wide against the CMB, at the corresponding redshifted 21cm line. Moreover, the density perturbation field at a redshift can be reconstructed looking for mK fluctuations at – arcmin resolution in the radio sky, providing a determination of its amplitude between the epoch probed by galaxy surveys and recombination. Finally, the first ionizing sources, like luminous quasars, can be seen by identifying peculiar, ring–shaped signals whose morphology depends on the source’s age, luminosity and geometry.
References
References
- [1] Madau, P., Meiksin, A., & Rees, M. J. 1997, ApJ, 475, 429 (MMR)
- [2] Meiksin, A. 1999, invited review for the Square Kilometre Array Radio Telescope Science Case, ed. R. Braun and A. R. Taylor, astro-ph/9902384
- [3] Tozzi, P., Madau, P., Meiksin, A., & Rees, M. J. 1999, ApJ submitted (TMMR)
- [4] Field, G. B. 1958, Proc. I.R.E., 46, 240
- [5] Field, G. B. 1959, ApJ, 129, 551
- [6] Couchman, H. M. P. 1985, MNRAS, 214, 137
- [7] Couchman, H. M. P., Thomas, P. A., & Pearce, F. R. 1995, ApJ, 452, 797
- [8] Braun, R. 1998, Square Kilometer Array Radio Telescope Science Case