Rubidium in Metal-Deficient Disk and Halo Stars
Abstract
We report the first extensive study of stellar Rb abundances. High-resolution spectra have been used to determine, or set upper limits on, the abundances of this heavy element and the associated elements Y, Zr, and Ba in 44 dwarfs and giants with metallicities spanning the range [Fe/H] . In metal-deficient stars Rb is systematically overabundant relative to Fe; we find an average [Rb/Fe] of +0.21 for the 32 stars with [Fe/H] and measured Rb. This behavior contrasts with that of Y, Zr, and Ba, which, with the exception of three new CH stars (HD 23439A and B and BD +5o 3640), are consistently slightly deficient relative to Fe in the same stars; excluding the three CH stars, we find the stars with [Fe/H] have average [Y/Fe], [Zr/Fe], and [Ba/Fe] of –0.19 (24 stars), –0.12 (28 stars), and –0.06 (29 stars), respectively. The different behavior of Rb on the one hand and Y, Zr, and Ba on the other can be attributed in part to the fact that in the Sun and in these stars Rb has a large -process component while Y, Zr, and Ba are mostly -process elements with only small -process components. In addition, the Rb -process abundance is dependent on the neutron density at the -processing site. Published observations of Rb in -process enriched red giants indicate a higher neutron density in the metal-poor giants. These observations imply a higher -process abundance for Rb in metal-poor stars. The calculated combination of the Rb -process abundance, as estimated for the stellar Eu abundances, and the -process abundance as estimated for red giants accounts satisfactorily for the observed run of [Rb/Fe] with [Fe/H].
1 INTRODUCTION
In the solar neighborhood reside stars of differing metallicity. Stars with a metallicity of approximately the solar value belong overwhelmingly to the Galactic disk. Stars of lower metallicity are on orbits that identify them as members of the Galactic halo. The metallicity [Fe/H] may be taken as a rough boundary between disk and halo stars. One tool for unravelling the evolution of the Galaxy is the measurement of the chemical compositions of stars as a function of metallicity. In this paper, we present the first extensive series of measurements of the rubidium abundance in disk and halo stars. Rubidium is potentially a special diagnostic of the neutron capture -process.
Rubidium is present in two isotopic forms: 85Rb which is stable and 87Rb which with a half-life of 5 yr may be deemed effectively stable from the astrophysical point of view. As we remark later, astronomical detection of Rb must rely on the Rb i lines that do not permit measurement of the relative isotopic Rb abundances from stellar spectra. Hence, we discuss the elemental Rb abundance. Analysis of the solar system abundances of Rb and adjoining elements shows that the neutron capture - and -processes are about equally responsible for the synthesis of Rb. Scrutiny of the -process abundances shows that the ‘main’ -process not the ‘weak’ -process is the principal source of Rb’s -process component. The main -process which manufactured elements heavier than about Rb is identified with the He-burning shell of intermediate and low mass AGB stars. The weak -process is identified with He-core and possibly C-core burning of massive stars.
Evolution of the Galaxy’s and -process products is rather directly observed from the stellar abundances of elements that are predominantly attributable to either the or to the -process. Traditional tracers include Ba for the -process and Eu for the -process. Elucidation of the operation of the neutron capture processes requires observations of more than a single element per process. As an example, we note that the abundance ratio of a ‘light’ to a ‘heavy’ -process elements, say Zr to Ba, provides information on the integrated exposure of material to neutrons. Rubidium with a roughly equal mix of and -process contributions, and an unfavorable electronic structure for ready detection in stellar spectra would seem to be an element of little interest. Closer inspection of the working of the -process shows, however, that Rb offers a unique insight into the process: Rb’s role as a monitor of the neutron density at the -process site.
Along the -process path, Rb is preceded by krypton with the path entering Kr at 80Kr and exiting at either 84Kr or 86Kr. Unstable 85Kr controls the exit. At low neutron density at the -process site, stable 84Kr is converted by neutron capture to 85Kr that decays to stable 85Rb with the path continuing to 86Sr. At high neutron densities, 85Kr does not -decay but experiences a neutron capture and is converted to stable 86Kr. Subsequent neutron capture by 86Kr leads by -decay of 87Kr to (effectively) stable 87Rb. When a steady flow along the -process path is attained, the density of a nuclide is given approximately by the condition that constant where is the neutron capture cross-section of nuclide and is the abundance of that nuclide. Since for the Rb isotopes, the switch of the 85Kr branch from its low neutron density routing through 85Rb to its high neutron density routing through 87Rb increases the total Rb abundance by about an order of magnitude relative to the abundance of other elements in this section of the -process path, such as Sr, Y, and Zr. The isotopic mix of Rb is obviously altered as a function of neutron density but this is not measureable for cool stars. (Krypton is undetectable spectroscopically in cool stars.) Operation of the 85Kr branch is more complicated than sketched, for example, neutron capture from 84Kr feeds not only the 85Kr ground state but a short-lived isomeric state that at all reasonable neutron densities provides some leakage to 85Rb. A thorough discussion of the 85Kr branch is provided by Beer & Macklin (1989) and its use in determining the effective neutron density of the -process in stars is discussed by Tomkin & Lambert (1983) and Lambert et al. (1995). When detailed abundance measurements are available as in the case of the carbonaceous chondrites, several branches along the -process path serve as neutron densitometers but Rb is the only low neutron density branch available to stellar spectroscopists. (At higher neutron densities, a branch controlled by 95Zr is exploitable in cool stars showing ZrO bands [Lambert et al. 1995].)
A primary reason for the near neglect of Rb in reports on quantitative spectroscopy of stars is that it is a trace alkali element. The Rb atom’s low ionization potential (4.177 eV) ensures that Rb is primarily ionized but the rare-gas electronic structure of Rb+ provides resonance lines in the far ultraviolet. Detection of Rb via the Rb i resonance lines at 7800 and 7947 Å at the expected low Rb abundances is possible for cool dwarfs and giants, as our exploratory synthetic spectra indicated. Stars for observation at high-spectral resolution were selected from Schuster & Nissen’s (1988) catalog of dwarfs, and from Pilachowski, Sneden, & Kraft’s (1996) list of giants. Emphasis was placed on metal-poor stars such that the metallicity range [Fe/H] is well represented but metallicities [Fe/H] are poorly represented. The following sections describe the observations, the method of analysis, the results, and present an interpretation of the Rb abundances relative to the abundances of other elements (Fe, Y, Zr, and Ba) obtained here.
2 OBSERVATIONS AND DATA REDUCTION
The program stars are listed in Table 1. They comprise 32 G and K dwarfs and subgiants with metallicities of [Fe/H] and 12 G and K giants with metallicities of [Fe/H] . The observations were made at the McDonald Observatory with the 2.7-m telescope and 2dcoudé echelle spectrometer (Tull et al. 1995). All the program stars were observed at the F3 focus at a resolving power of R = 60,000 and, in addition, eight of the brighter stars were also observed at the F1 focus at a resolving power of 200,000. In order to minimise the influence of cosmic rays, two observations in succession, rather than one longer observation, were generally made of each star. Four different detectors were used for the observations with resolving power 60,000: a Texas Instruments CCD with 15 m2 pixels in a 800800 format, a Tektronix CCD with 27 m2 pixels in a 512512 format, the Goddard Advanced Imaging System CCD with 21 m2 pixels in a 20482048 format, and a Tektronix CCD with 24 m2 pixels in a 20482048 format. The first two of these CCDs provided partial coverage of the wavelength interval 5500 – 8000 Å with large gaps between the end of one spectral order and the beginning of the next. The last two CCDs, which are much larger, provided nearly complete coverage from 4000 – 9000 Å; coverage was complete from the start of this interval to 5600 Å and substantial, but incomplete, from 5600 Å to the end of the interval. The Tektronix CCD with 24 m2 pixels in a 20482048 format was used for the 200,000 resolving-power observations, which provided partial coverage of the region from 5500 – 8000 Å. The typical signal-to-noise ratio of the extracted one-dimensional spectra is between 100 and 300 at red and near-infrared wavelengths for the 60,000 resolving-power observations, while it is typically between 100 and 250 at the same wavelengths for the 200,000 resolving-power observations.
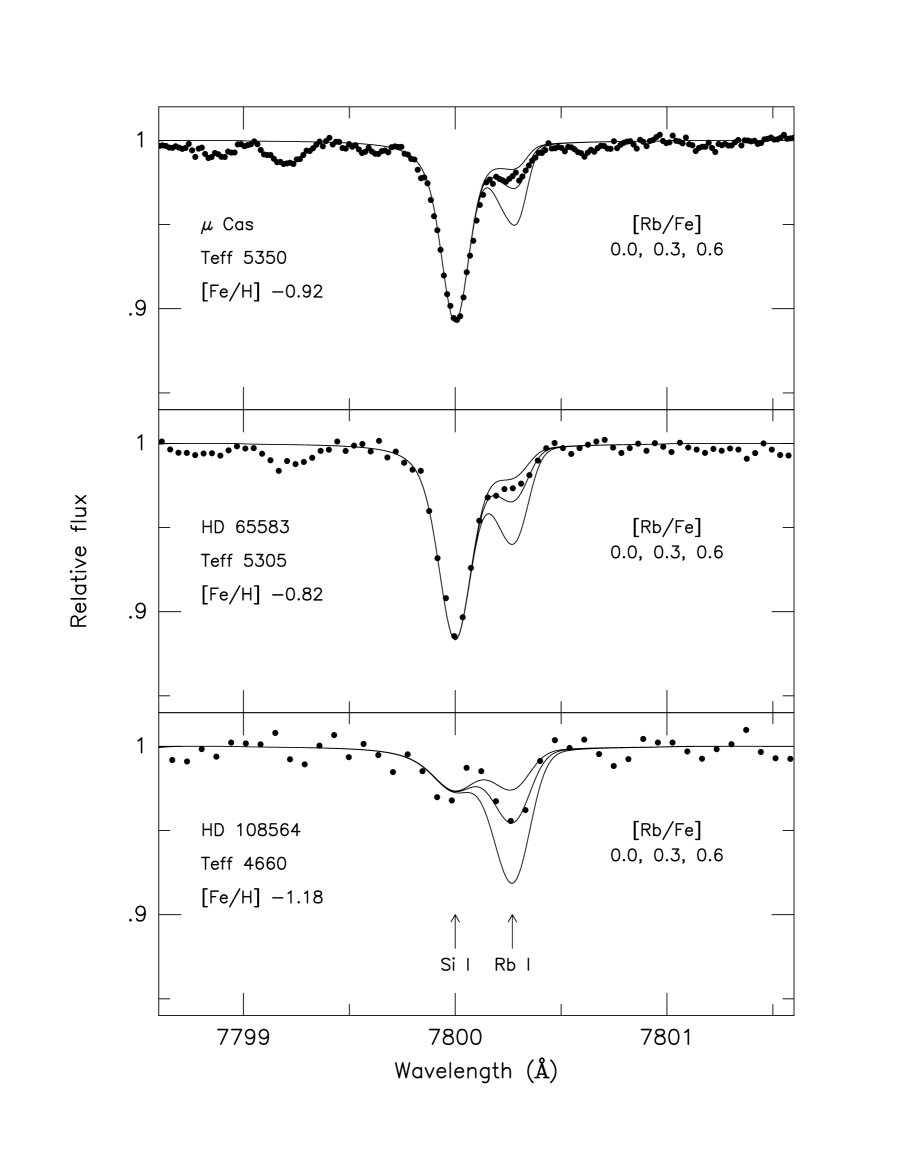
The only accessible Rb lines in stellar spectra are the two Rb i resonance lines at 7800.3 and 7947.6 Å. Since these lines are typically weak we concentrated our attention on the stronger 7800.3 Å line and did not pursue the 7947.6 Å line, which is half as strong as the 7800.3 Å line. Figure Rubidium in Metal-Deficient Disk and Halo Stars shows examples of the 7800.3 Å Rb i line in the program stars; as may be seen, the line is partially blended with a stronger Si i line at 7800.0 Å.
The data were processed and wavelength calibrated in a conventional manner with the IRAF111 IRAF is distributed by the National Optical Astronomical Observatories, which is operated by the Association for Universities for Research in Astronomy, Inc., under contract to the National Science Foundation. package of programs on a SPARC5 workstation. The 7800.3 Å Rb i line was analyzed by spectrum synthesis because of the presence of the Si i line. Equivalent widths were measured for lines of other elements used in the investigation; these were lines of Fe i and Fe ii and the available lines (Y ii, Zr i, Ba ii, and Nd ii) of other heavy elements besides Rb. Lines suitable for measurement were chosen for clean profiles, as judged by inspection of the solar spectrum at high resolution and signal-to-noise ratio (Kurucz et al. 1984), that could be reliably measured in all, or most of, the program stars. Moore, Minnaert, & Houtgast (1966) was our primary source of line identification. The equivalent width of each line was measured with the IRAF measurement option most suited to the situation of the line; usually this was the fitting of a single, or multiple, Gaussian profile to the line profile. These equivalent widths were measured from the spectra with 60,000 resolving power; the 200,000 resolving-power spectra were not used because their much more limited wavelength coverage excluded most lines of interest. Table 2 gives basic information for the Rb i line and the lines of the other elements. The equivalent widths of the lines are available at JT’s World Wide Web site (http://anchor.as.utexas.edu/tomkin.html).
The spectrum of an asteriod (Iris), observed with the same instrumental setup as that used for the 60,000 resolving-power observations of the program stars and reduced and measured in the same manner, provided solar equivalent widths for these lines.
3 ANALYSIS
An LTE model-atmosphere abundance analysis was made relative to the Sun. Here we briefly discuss the selection of atomic data for the lines, the model atmospheres, and the abundance determinations for Rb and the other heavy elements.
3.1 Line Data
The lines used for the abundance determinations are given in Table 2. Our first choice for -values for the lines was modern laboratory -values; basic data for the lines, including the -values and their sources, are given in Table 2. In particular we note that the -value of the 7800.3 Å Rb i line, log = +0.130.04 (Wiese & Martin 1980), is reliably determined. For some lines, for which reliable -values are not available, we used solar -values instead. These were calculated with the solar equivalent widths given in Table 2, the solar atmosphere of Holweger & Müller (1974), a microturbulence of 1.15 km s-1 (Tomkin et al. 1997), and the abundances given in Table 2. The solar equivalent widths were measured from the spectrum of the asteriod Iris.
The adoption of the laboratory -values for the Fe i lines follows the prescription of Lambert et al. (1996). In particular, we make a small correction (see Table 2) to the -values of May, Richter, & Wichelmann (1974) to normalize them to those of O’Brian et al. (1991) and Bard, Kock, & Kock (1991). No correction is needed to put the solar Fe i line -values on the same scale as the laboratory -values; we find: log (solar) – log (lab) = +0.030.05 (4 lines, 6 -values). Accurate experimental -values are not available for our Fe ii lines, therefore we have used solar -values for these lines.
Although the three Zr i lines all have modern laboratory -values (Biémont et al. 1981), we find their solar -values are significantly larger than the laboratory ones: log (solar) – log (lab) = +0.410.04. Our adopted solar Zr abundance — log (Zr) = 2.60 (Anders & Grevesse 1989) — is not a factor in this discrepancy because it is based on Biémont et al.’s -values and is very similar to the value — log (Zr) = 2.56 — Biémont et al. derived in their own investigation of the solar Zr abundance. Some of the discrepancy is attributable to the use of different ionization potentials for Zr i; we have used the accurate value of 6.634 eV (Hackett et al. 1986) while Biémont et al. must have used the significantly higher old value of 6.84 (Allen 1973). This accounts for 0.20 dex of the discrepancy. Line-to-line variation of individual line abundances may also account for some of the discrepancy; the individual line abundances Biémont et al. derive for these three lines are on average 0.06 dex larger than the average Zr abundance they determine from the Zr i lines. Although the remaining 0.15 dex discrepancy is not readily accounted for, the manner in which these three lines strengthen in the cooler program stars leaves no doubt that they are low excitation lines of a neutral species and is thus consistent with their identification as Zr i lines. In order to minimize the influence of whatever is causing the residual discrepancy between the solar and laboratory -values for these lines, we have chosen to adopt the solar -values for them in our analysis.
Two Y ii lines (5200.42 and 5402.78 Å) were rejected when it became evident, during an initial abundance analysis of all the stars, that they gave significantly larger Y abundances than the other Y ii lines in many of the stars.
Atomic data and solar equivalent widths for the lines are given in Table 2.
3.2 Model Atmospheres
Plane parallel, line blanketed, flux constant, LTE MARCS model atmospheres, which derive from a development of the programs of Gustafsson et al. (1975), were used for the abundance analysis.
The determination of parameters (effective temperature, surface gravity, metallicity, and microturbulence) for the model atmospheres was done in two steps. First we chose preliminary parameters for each star which were used to calculate an initial set of model atmospheres. We then used the initial model atmospheres and the equivalent widths of the Fe i and Fe ii lines to iteratively adjust the atmospheric parameters to determine an adopted set of parameters and atmospheres that are consistent with the Fe i and Fe ii line data. We now briefly describe these two steps.
3.2.1 Choice of Preliminary Atmospheric Parameters
Strömgren photometry provided the primary means of determining preliminary parameters for the dwarfs and subgiants, which are mostly from the catalogue of Schuster & Nissen (1988) supplemented by three stars from Carney et al. (1994) and four stars from the Bright Star Catalogue (Hoffleit & Jaschek 1982). The stars are intrinsically faint and nearby; an examination of their parallaxes (see below) shows they are all within 100 pc, except for two stars which are at 11117 and 13718 pc. The interstellar reddening of the stars is therefore negligible (Schuster & Nissen 1989a) so we have not corrected their indices.
Our chief source of preliminary effective temperatures for the dwarfs and subgiants was the color index coupled with the Teff vs. calibration of Alonso, Arribas, & Martínez-Roger (1996a, equation 9), who used the infrared flux method to determine effective temperatures for metal-deficient stars. For the components of the visual binary HD 23439, which do not have their own , and for HD 150281, which also does not have , we took the effective temperatures from Carney et al. (1994); for 61 Cyg A and B, which are too cool for the applicable range of Alonso et al.’s calibration, we took the effective temperatures from Alonso, Arribas, & Martínez-Roger (1996b).
Initial surface gravities for the dwarfs and subgiants were determined by the relations and where is the stellar mass, the radius, and the luminosity, with the luminosities being set by the Hipparcos parallaxes. We followed the prescriptions of Nissen, Høg, & Schuster (1997), who have successfully applied this method to determine surface gravities for 54 metal-poor stars. Most of the stars have Hipparcos parallaxes and all of these parallaxes are of sufficient accuracy; the largest uncertainty () is 0.15 with most uncertainties being much smaller than this. For the small number (five) of stars without Hipparcos parallaxes we took trigonometric parallaxes from Gliese & Jahreiss (1979) or determined photometric parallaxes from and , with estimated from the photometry and the recipes of Nissen & Schuster (1991).
Preliminary metallicities for the dwarfs and subgiants were estimated from the photometry and the calibration of Schuster & Nissen (1989b, equation 3). For a small number (five) of stars the results of Carney et al. (1994) or Alonso et al. (1996b) were used instead.
An initial microturbulence of 1.0 km s-1, which is representative of dwarfs in this temperature range (Feltzing & Gustafsson 1998), was used for the dwarfs and subgiants.
For the giants, which are taken from Pilachowski et al.’s (1996) medium-resolution spectroscopic investigation of Na abundances in metal-poor giants, we adopted Pilachowski et al.’s atmospheric parameters as initial parameters. Pilachowski et al.’s effective temperatures and gravities are photometrically based as modified by their spectroscopic results, while their metallicities and microturbulences are from their spectroscopic analysis.
3.2.2 Determination of Adopted Atmospheric Parameters
Model atmospheres were computed using the MARCS code (Gustafsson et al. 1975). Those for the dwarfs and subgiants were calculated by interpolation in a grid of MARCS models, which spanned the range of dwarf and subgiant parameters and was provided by B. Edvardsson. The models of Pilachowski et al. (1996), who also used MARCS models for their abundance analysis, were used as preliminary models for the giants and were provided by C. Sneden; iterations of the giant models with modified atmospheric parameters were calculated directly using the MARCS code.
Models with the preliminary parameters and the line analysis code MOOG (Sneden 1973) were then applied to the equivalent width data for the Fe i and Fe ii lines. Trends of the Fe i abundances with line excitation potential were used to check the preliminary effective temperatures and trends of the Fe i abundances with equivalent width were used to check the preliminary microturbulences. Where necessary revised parameters were determined, new models calculated, and a new round of abundance calculations done for the Fe i and Fe ii lines. Next the Fe abundances from this round of calculations were used to calculate a new set of models and do another round of abundance calculations for the Fe lines. In a final round of calculations the surface gravities were adjusted, and new models were calculated, so the Fe i and Fe ii lines gave the same Fe abundance. These final adopted parameters for the program stars are given in Table 1.
The adopted parameters are generally only moderately different from the initial parameters. For the dwarfs and subgiants the analysis of the Fe lines led to revised effective temperatures for 13 stars and an average temperature increase for these stars of 14075 K ( of the individual differences). The revised gravities of the dwarfs and subgiants tend to be lower than the preliminary gravities, but the inconsistency is small; for the 28 dwarfs and subgiants with measurements of both Fe i and Fe ii lines, for which spectroscopic gravities can thus be determined, the average downward revision of the log is 0.120.12 ( of the individual differences). This suggests that there is no serious inconsistency between the gravities of these stars and the four remaining dwarfs and subgiants for which we adopt preliminary gravities because they have no Fe ii lines.
It is of interest to see how the differences that we find between our spectroscopic gravities and the preliminary Hipparcos-based gravities compare with what Allende Prieto et al. (1999) found in a thorough examination, of spectroscopic gravities, for nearby stars, taken from the literature versus Hipparcos-based gravities. We confine the comparison of log – log for our results and theirs to the temperature range (4900 – 5500 K) of our dwarfs and subgiants. (This range excludes the four coolest dwarfs and subgiants because they do not have any measured Fe ii lines.) As mentioned earlier, we find an average difference log – log = –0.120.12 (28 stars, of individual differences) for our dwarfs and subgiants, while Allende Prieto et al. find an average difference of –0.260.29 (9 stars) for their sample of stars. Our results and Allende Prieto et al.’s thus both show that the spectroscopic gravities tend to be smaller than the Hipparcos gravities. Also, the consistency between the spectroscopic and Hipparcos gravities of our stars is somewhat better than it is for Allende Prieto et al.’s sample of stars.222 We have not determined Hipparcos-based gravities for the giants because, with the exception of Arcturus, they are much more remote than the dwarfs and subgiants. Although they all have Hipparcos parallaxes, the errors in the parallaxes are comparable to the parallaxes for most of them.
Revisions of effective temperature were required for five of the giants; the average temperature increase for these stars was 100140 K. All the giants have measurements of both Fe i and Fe ii lines thus allowing revision of their preliminary gravities for all 12 stars; the average change of log was -0.040.37. The adopted effective temperatures and gravities of the giants thus are in good agreement with the preliminary values (Pilachowski et al. 1996). Our results, which use higher resolution spectra and more numerous Fe lines than those of Pilachowski et al., thus confirm their results. Our Fe abundances are also in good agreement; the average difference between our [Fe/H] determinations and theirs is -0.070.10.
We conclude this section with a brief discussion of the potential influence of non-LTE on the effective temperatures derived from the Fe i line excitation. As remarked earlier, the primary source of our initial effective temperatures (for the dwarfs and subgiants) was and the Teff vs. calibration of Alonso, Arribas, & Martínez-Roger (1996a, ), where the effective temperatures in their calibration were determined by the infrared flux method. The based effective temperatures are thus free of non-LTE effects. One way to estimate the possible influence of non-LTE on the effective temperatures derived from the excitation of Fe i lines, therefore, is to consider the difference between the excitation-based temperatures and the -based temperatures. Of course non-LTE effects are not the only possible source of such a difference so this check is indicative, rather than conclusive. The average difference Teff (Fe i) Teff () = +4568 K ( of the individual differences, 20 stars), where the calculation includes not only stars whose initial effective temperatures were revised, but also stars for which no revision was necessary - as long as they had enough Fe i lines to define the line excitation. This difference is small and indicates that any non-LTE influence on the determination of temperatures from the Fe i lines is minor.
3.3 Abundance Determinations for Rb and the Other Heavy Elements
Abundances were determined by matching the observed line strengths and theoretical line strengths calculated by MOOG with the adopted model atmospheres. As remarked earlier, the Rb i line was treated by means of spectrum synthesis, while the lines (Y ii, Zr i, Ba ii, and Nd ii) of the other heavy elements were treated by means of equivalent widths.
The spectrum synthesis of the 7800.29 Å Rb i line includes the hyperfine structure of the 85Rb and 87Rb isotopes, each of which is split into two components, and the blending Si i line at 7800.00 Å. The accurately known wavelengths and relative line strengths of the hyperfine structure components were taken from Lambert & Luck’s (1976) analysis of Rb in Arcturus. We adopted a terrestrial abundance ratio (85Rb/87Rb = 3) for the Rb isotopes. Although in principle it would be desirable to make direct measurements of the stellar isotopic Rb abundances from the exact shape of the RbI line profile, in practice extreme departures from the terrestrial isotope ratio are required before there is appreciable distortion of the line profile. Lambert & Luck, for example, found that for their spectra, which had a resolving power of 195,000 that is similar to the high resolution spectra of the present investigation, the 85Rb/87Rb ratio had to be as low as 1 or as high as 10 to cause even a small variation of the line profile; they concluded that the isotope ratio in Arcturus is terrestrial with a large uncertainty. Direct determination of Rb isotopic abundances, therefore, is not the thrust of our investigation, although we note that comparison of the observed and synthesised spectra of the Rb line in our program stars does not show any variations attributable to non-terrestrial isotope ratios. We also note that the indeterminacy of the Rb isotope ratios does not interfere with the measurement of the elemental Rb abundances; the Rb i line is weak in all the program stars so the Rb abundances it provides are not affected by changes of the isotopic mixture.
The synthesis of the Rb i line also includes the Si i line to the blue. No reliable experimental oscillator strength is available for the Si i line so a solar oscillator strength (log = -0.65) was adopted. The instrumental and macroturbulent broadening, as well as thermal and microturbulent broadening, were included in the synthesis. The macroturbulent broadening was set by matching the profile of the clean nearby Ni i line at 7797.6 Å.
Spectrum synthesis of the solar Rb i line, using the solar model of Holweger & Müller (1974) and the Kurucz et al. (1984) solar atlas, provides a solar Rb abundance log (Rb) = 2.600.07, which is the same as the Rb abundance in Anders & Grevesse’s (1989) compilation of solar abundances. We note, however, the discrepancy between the photosperic abundance and the somewhat lower meteoritic abundance of 2.400.03 (Anders & Grevesse 1989). Although it might be speculated that the relatively low melting and boiling points of Rb (39 and 688 C, respectively) may make it behave like a volatile element and so explain the low meteoritic abundance, this does not appear to be the case. Potassium, which is isoelectronic with Rb and has only slightly higher melting and boiling points (63 and 759 C, respectively), shows no discrepancy of its photospheric and meteoritic abundances, which are log (K) = 5.120.13 and 5.130.03, respectively. Although the discrepancy is a potential source of concern, we note that there is no evidence of the Rb i line being affected by an unknown blend; in particular, in our program stars the strengthening of the line with decreasing effective temperature is consistent with the behavior of a resonance line of a heavy-element neutral species.
The observed and synthesised Rb i line profiles for a sample of stars are shown in Figure Rubidium in Metal-Deficient Disk and Halo Stars. Table 3 gives the abundances of Rb and the other heavy elements.
The Rb abundances derived from observations made at the F1 focus (resolving power = 200,000) and the F3 focus (resolving power = 60,000) are highly consistent; for stars observed at both foci the average difference between the F1- and F3-based [Rb/H] is –0.030.01 (s.e., five stars). For bright stars, such as Arcturus and Cas, the greater detail provided by the higher resolution F1 observations allows for more precise determination of the Rb abundance. In fainter stars there is not much to choose between the F1 and F3 observations because the greater spectral detail of the F1 observations tends to be counterbalanced by their lower signal-to-noise ratio.
The two main sources of errors in the abundances are measurement error and analysis error caused by errors in the adopted model atmosphere parameters. The scatter of the abundances provided by individual lines of the same species, which are caused by measurement errors of the equivalent widths and, to a lesser extent, by errors in the line oscillator strengths, is a good guide to measurement error. This scatter, as measured by the standard deviation of the individual line abundances, is given in Table 3. (Although the standard deviations of the abundances from individual lines are larger than the standard deviations of the mean abundances, the heavy element abundances are based on only a few lines for each element — see Table 2 — so we prefer to consider the standard deviations of the individual line abundances.) For Rb, whose abundance is based on spectrum synthesis of the 7800 Å Rb i line, Table 3 gives errors estimated from the fit of the observed and synthesised spectra. Inspection of Table 3 shows the measurement-related abundance errors range up to 0.15 dex with larger errors in a few cases; a representative error in the [X/H] abundances is 0.07 dex, while a representative error of the [X/Fe] abundances is 0.1 dex.
Estimated errors in the adopted effective temperatures are between 50 K, for stars with a good selection of Fe i lines providing a well-determined excitation temperature, and 100 K, for stars for which we adopted color-based effective temperatures. Representative errors in the adopted log and metallicities are 0.2 and 0.1 dex, respectively. A representative uncertainty in the microturbulence is 0.5 km s-1, although we note that the Rb abundances provided by the weak Rb i line have little, or no, microturbulence dependence and that because of the metal deficiency of most of the program stars the abundances of most other elements also have only a small, or negligible, microturbulence dependence. Adopting a representative effective temperature error of 100 K and the stated errors of the other parameters, we find that for a typical dwarf the combined effects of these errors change the Fe abundance (from Fe i lines) by 0.11 dex. The corresponding figure for a typical giant is 0.17 dex. For the heavy elements the abundance of the element relative to Fe, [El/Fe], holds the most interest. This ratio is less dependent on the atmospheric parameters than the absolute abundance. In the typical dwarf the combined effects of the errors in the atmospheric parameters change [El/Fe] by 0.04 (Rb), 0.05 (Y), 0.05 (Zr), 0.11 (Ba), and 0.06 dex (Nd). The corresponding figures for a typical giant are: 0.07 (Rb), 0.06 (Y), 0.00 (Zr), 0.14 (Ba), and 0.07 dex (Nd). We estimate representative total errors, caused by measurement error and errors in the model atmosphere parameters together, to be 0.1 – 0.2 dex in [Fe/H] and 0.1 – 0.2 dex for [El/Fe].
We now briefly consider how the Fe and Rb abundances of the dwarfs and subgiants would change if the preliminary effective temperatures, which are mostly based on the infrared flux method (Alonso et al. 1996a), and preliminary gravities, which are mostly Hipparcos-based, were used instead of the adopted effective temperatures and gravities. As discussed earlier, the preliminary effective temperatures were revised upward by an average of 14075 K ( of the individual differences) for 13 of the dwarfs and subgiants, while no revisions of the preliminary effective temperatures were made for the other 19 dwarfs and subgiants. Use of the lower preliminary effective temperatures for these 13 stars would decrease their Fe abundances (from Fe i lines) by an average of 0.14 dex, while their [Rb/Fe], as set by Rb i and Fe i lines, would increase by an average of 0.04 dex. The adopted gravities for 28 of the dwarfs and subgiants are spectroscopically determined, while those of the other four dwarfs and subgiants, for which we could not determine spectroscopic gravities, are the preliminary gravities. Use of the preliminary gravities, instead of the adopted spectroscopic gravities, for these 28 stars would not change their Fe or Rb abundances significantly; the adoption of the preliminary log , which are 0.120.12 dex ( of the individual differences) higher on average than the spectroscopic log , in place of the spectroscopic log would change the [Fe/H] and [Rb/Fe] from neutral lines by +0.01 and 0.00 dex, respectively, on average.
4 RESULTS
4.1 Comparison with the Literature
Before we consider the Rb and other heavy-element abundances, we compare our results with those published in the literature. First we consider the results for [Fe/H]. Figure Rubidium in Metal-Deficient Disk and Halo Stars compares the [Fe/H] determinations for stars in common to this study and earlier high signal-to-noise ratio, high resolution studies. The comparison is not exhaustive, but does include all recent studies (since 1990) which have two, or more, stars in common with the present study. The agreement of the [Fe/H] determinations is good over most of the metallicity range and, although the [Fe/H] of this study tend to be slightly more negative than the literature [Fe/H] in the most metal-deficient stars, the overall agreement is not unsatisfactory.
Previous studies which, to our knowledge, have determined Rb abundances for stars in common with those of the present investigation are Mäckle et al.’s (1975a) study of Arcturus and Gratton & Sneden’s (1994) study of heavy-element abundances in metal-poor stars. In Table 4 we compare our [Rb/Fe] with those of the two earlier investigations. Because our Rb abundances are based on the 7800 Å Rb i line, while Mäckle et al.’s (1975a) abundance is based on both the 7800 and 7947 Å lines, we also include in the Table their abundance for the 7800 Å Rb i line alone (Mäckle et al. 1975b). (Gratton & Sneden’s results are based only on the 7800 Å line.) In order to make the Rb abundances of our and the earlier studies directly comparable we have adjusted the Rb abundances of the earlier studies to reflect the values they would have if the stellar parameters (Teff, log , [M/H], and ) used in the earlier studies had been the same as those used here. For Arcturus the difference between our [Rb/Fe] and Mäckle et al.’s is only –0.03 dex — pleasingly small and not unexpected for the case of such a bright star. For the three stars that we have in common with Gratton & Sneden we note that both investigations determined Rb abundances for two of the stars (HD 64606 and 187111), but were only able to determine upper limits for the third star (HD 122956). The differences between our [Rb/Fe] and Gratton & Sneden’s are –0.25 (HD 64606), –0.09 (HD 122956), and +0.17 (HD 187111). That these differences are much larger than in the case of Arcturus can be ascribed to the fact that all three stars are quite metal-deficient and have only a weak or undetectable Rb line. We estimate that for these three stars the uncertainty in the Rb abundance associated with fitting our observed and synthetic spectra of the Rb i line is 0.1 dex for HD 64606 and 187111 and 0.2 dex for HD 122956; Gratton & Sneden’s Rb abundances must be subject to similar uncertainties also. We conclude, therefore, that our [Rb/Fe] and Gratton & Sneden’s are probably the same to within the errors of measurement for these three stars.
4.2 The Abundances of Rb, Y, Zr, Ba, and Nd
As is customary, the abundances in Table 3 are plotted as [el/Fe] against [Fe/H], in Fig. Rubidium in Metal-Deficient Disk and Halo Stars, Rubidium in Metal-Deficient Disk and Halo Stars, and Rubidium in Metal-Deficient Disk and Halo Stars to reveal trends in the relative abundance of element el and iron. Two points are immediately apparent: (i) three stars are unusually rich in the heavy elements — note especially the [Y/Fe] ratios of HD 23439A and B, and BD +5o 3640 which we shall dub CH stars, and (ii) the distinctive behavior of [Rb/Fe] in the metal-poor stars — [Rb/Fe] when the other heavy elements show [el/Fe] . Before commenting on these striking results, we compare our results for the Y, Zr, Ba, and Nd abundances with results in the literature.
Previous extensive abundance determinations of heavy (and other) elements in metal-poor stars have shown that the run of [el/Fe] against [Fe/H] is smooth down to about [Fe/H] = –2 with a ‘cosmic’ scatter less than the scatter that results from the errors of measurement. Cosmic scatter is present for more metal-poor stars but our sample is devoid of such stars. Therefore, our results are expected to agree well with previous studies despite the lack of a complete overlap in stellar samples. Key papers reporting results on heavy elements are Zhao & Magain (1991) and Gratton & Sneden (1994) with reviews by Wheeler, Sneden, & Truran (1989), Lambert (1989), and McWilliam (1997) amongst others. Our results for [Y/Fe], [Ba/Fe], and [Nd/Fe] are in excellent agreement with previous results, for example, Zhao & Magain (1991) and Gratton & Sneden (1994) find [Y/Fe] at [Fe/H] = –1 with the relative underabundance of Y increasing to about 0.25 at [Fe/H] = –2 which agree well with Figure Rubidium in Metal-Deficient Disk and Halo Stars. A discrepancy appears when comparing results for [Zr/Fe]. Zhao & Magain (1991) and Gratton & Sneden (1994) report [Zr/Fe] for [Fe/H] in the range of –1 to –2 but our results (Figure Rubidium in Metal-Deficient Disk and Halo Stars) show [Zr/Fe] to be consistently less than zero: a difference in [Zr/Fe] of about 0.3 to 0.4 dex relative to the previous studies. This difference is most probably due to our exclusive use of Zr i lines. Brown, Tomkin, & Lambert (1983) found that Zr i lines in mildly metal-poor giants gave a clear Zr underabundance which was plausibly attributed to non-LTE effects such as over-ionization of Zr atoms to Zr+ ions. For metal-poor stars, Gratton & Sneden remark that their selection of Zr i lines gives a systematically lower Zr abundance than the Zr ii lines: the difference of –0.160.05 dex would account in part for our largely negative values of [Zr/Fe].
Our results clearly show a relative overabundance of Rb in metal-poor stars: the mean value [Rb/Fe] = +0.230.02 (s.e.) is found from nine stars with [Fe/H] , excluding the three CH stars. This is consistent with the four measurements reported by Gratton & Sneden (1994) and with their six upper limits to [Rb/Fe].
Non-LTE effects such as overionization warrant consideration. As a guide to the non-LTE effects on Rb, we consider those calculated for lithium, another alkali. Carlsson et al. (1994) predict that the LTE abundances from the Li i 6707 Å resonance doublet require correction by not more than 0.03 dex for non-LTE effects, a negligible correction in the present and almost all contexts. The abundances of Li and Rb are similar: lithium has the abundance log (Li) in the warmer dwarf stars comprising the Spite plateau and Rb declines from log (Rb) = 2.6 at solar metallicity to 1.9 at [Fe/H] = –1 and to 0.8 at [Fe/H] = –2. The key point is that optical depth effects in lines and continua are slight for both elements. Rb is probably more affected by photoionization because the atom’s ionization potential is 4.18 eV versus 5.39 eV for the lithium atom. Photoionization of Rb will be enhanced relative to the rate for Li but collisional ionization rates will also be enhanced. The different wavelengths of the resonance (and excited) atomic lines for Rb and Li will introduce no more than slight differences in the non-LTE corrections. If non-LTE effects were large for Rb, we would anticipate that dwarfs and giants of the same metallicity would yield systematically different Rb abundances. This is not the case: four dwarfs with [Fe/H] in the range –1 to –2 give a mean [Rb/Fe] = +0.280.04 (s.e.) and five giants in the same [Fe/H] range give the mean [Rb/Fe] = +0.180.02 (s.e.). (The mean for the dwarfs excludes the three CH stars.) Although a non-LTE analysis for Rb would be of interest, we suggest that our results derived from LTE analyses are not substantially different from non-LTE results.
Scatter of the [el/Fe] results at a given [Fe/H] is not significantly different from that expected from the measurement errors. Obviously, the three stars over-abundant in the heavy elements and dubbed CH stars are set aside as special cases. The scatter for [Rb/Fe] between [Fe/H] of –0.5 and –1.0 is small and consistent with the measurement errors. There is an apparent moderate increase in scatter of [Rb/Fe] below [Fe/H] = –1 but this is probably again due to the measurement errors because the Rb i line is very weak in these metal-poor stars. The results are roughly consistent with a constant [Rb/Fe] in stars with [Fe/H] .
4.3 The New CH Stars HD 23439A and B and BD +5o 3640
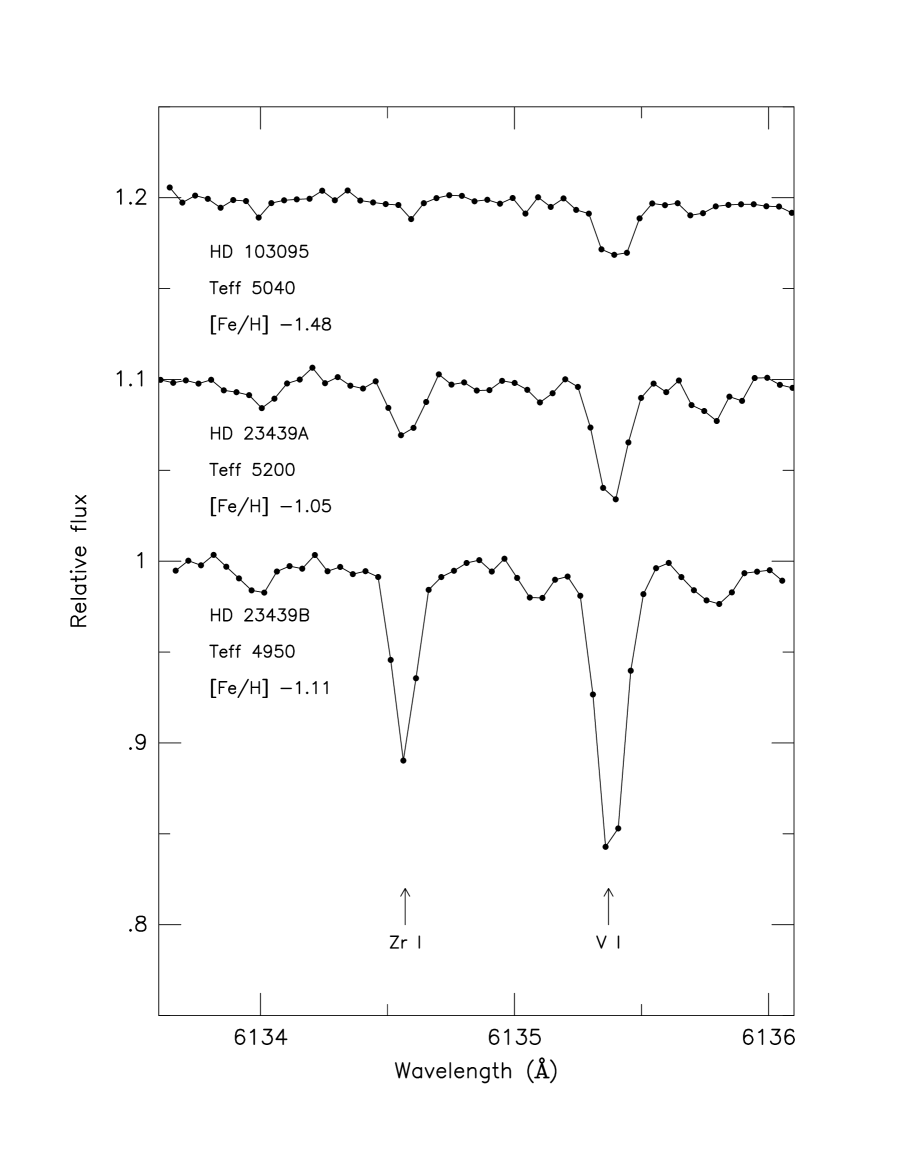
These three stars, which are all dwarfs, are consistently overabundant in all of the five heavy elements investigated in this study. Figure Rubidium in Metal-Deficient Disk and Halo Stars shows a Zr i line and a V i line in HD 23439A and B and HD 103095, a non-CH star with otherwise similar properties. The much greater strength of the Zr i line relative to the V i line in HD 23439A and B as compared with HD 103095 is evident. As may be seen in Fig. Rubidium in Metal-Deficient Disk and Halo Stars, Rubidium in Metal-Deficient Disk and Halo Stars, and Rubidium in Metal-Deficient Disk and Halo Stars the heavy-element abundance enhancements are similar in the three stars. The average enhancements for the three stars are: [Rb/Fe] = +0.41, [Y/Fe] = +0.34, [Zr/Fe] = +0.51, [Ba/Fe] = +0.27, and [Nd/Fe] = +0.32 (HD 23439A and BD +5o 3640); actual values of [X/Fe] for the individual stars are given in Table 5. HD 23439 is a nearby visual binary composed of a K1V primary and a K2V secondary; the Hipparcos Catalogue gives 7.′′307 and 40.83 mas for the separation of its components and parallax, respectively. These numbers set a lower limit on the A–B linear separation of 179 AU. To the best of our knowledge HD 23439 is the first case of a binary in which both components have been found to be CH stars.
We note that HD 23439B is a single-lined spectroscopic binary with a period of 48.7 d and a mass function of 0.0022 (Latham et al. 1988). Could the unseen companion of HD 23439B be the white dwarf descendant of the AGB star responsible for the mass transfer that changed HD 23439A and B into CH stars? Perhaps, but in this scheme it is hard to explain the very similar heavy-element enhancements of HD 23439A and B (see Table 5). Just as today the unseen companion is much closer to component B than to component A so in the past the putative AGB predecessor of the unseen companion must also have been much closer to B than A. How did the AGB star manage to give the A and B components the same heavy-element enhancements? This difficulty with the AGB-star scenario suggests that the heavy-element enhancements must be primordial.
5 RUBIDIUM AND STELLAR NUCLEOSYNTHESIS
Heavy elements are synthesised by the neutron capture - and -processes. (In considering elemental abundances, the small contribution from -processes may be neglected.) Detailed dissection of the isotopic abundances measured for carbonaceous chondrites has provided an isotope by isotope resolution of the abundances into - and -process contributions (cf. Käppeler, Beer, & Wisshak 1989). As is well known, Ba and Eu are primarily - and -process products respectively: Cowan (1998) estimates that Ba is 85% an -process product, and Eu is 97% a -process product — see Gratton & Sneden (1994) for similar estimates. Rubidium is of mixed parentage; Cowan gives the - and -process fractions as 50% each — Gratton & Sneden provide quite similar estimates (48% for - and 52% for the -process). As noted in the Introduction, the -process contribution may be broken into a ‘weak’ and a ‘main’ component. Gratton & Sneden divide the 48% -process Rb contribution into 5% from the weak and 43% from the main -process. Our goal is to use the Ba and Eu abundances as monitors of the - and -processes respectively to predict the Rb abundances, and then to comment on the consistency between the predicted and observed Rb abundances.
The other heavy elements considered here are also a mix of - and -processes: Cowan gives the following %: (72, 28) for Y, (81, 19) for Zr, and (47, 53) for Nd. Gratton & Sneden (1994) put the weak contribution to the total -process as 16% for Y, 10% for Zr, and less than 1% for Ba, Nd, and Eu. Especially interesting is the roughly 50-50 split for Nd that matches the split for Rb. Then, the simplest possible scenario of unvarying yields of and -process products over the life of the Galaxy would predict that [Rb/Fe] and [Nd/Fe] would vary identically with [Fe/H]. Inspection of Fig. Rubidium in Metal-Deficient Disk and Halo Stars and Rubidium in Metal-Deficient Disk and Halo Stars shows that this is not the case.
There are several factors pertinent to the understanding of the run of Rb and other heavy elements with [Fe/H].
-
•
It is now well known that, the distribution of heavy elements at low [Fe/H] resembles a -process pattern and is not the mix of - and -processes that prevails at solar metallicities (Truran 1981; Sneden & Parthasarathy 1983; Wheeler et al. 1989; Lambert 1989). There is evidence that the abundance distribution of the -process was largely invariant from low metallicities to the present [Fe/H] . Then, it should suffice in modelling the [el/Fe] vs [Fe/H] relations to adopt the relative -process abundances that are obtained from dissection of the measurements on carbonaceous chondrites.
-
•
Europium is assigned to the -process: Cowan’s (1998) resolution of the meteoritic abundances is 97% -process and a mere 3% -process. With declining metallicity the / ratio declines. Therefore, we may assume that Eu is a -process product throughout the evolution of the Galaxy. The run of [Eu/Fe] against [Fe/H] is taken from McWilliam’s (1997) review: [Eu/Fe] = 0 at [Fe/H] = 0 with a smooth transition to [Eu/Fe] at [Fe/H] = –1.0 and to the metallicity limit [Fe/H] = –2.5 of interest to us.
-
•
Red giants enriched in -process heavy elements are likely the major donors of these elements to the Galaxy’s interstellar medium. Analyses of such red giants of differing [Fe/H] show that the pattern of -process products has evolved with [Fe/H]. Smith (1997), who has collated published results, defines Y and Zr as ‘light’ -process elements (here, ls) and Ba, La, and Ce as ‘heavy’ -process elements (here, hs). He finds that [hs/ls], which by definition is 0 at [Fe/H] = 0, increases to [hs/ls] 0.6 at [Fe/H] = –1.5. This evolution of [hs/ls] is attributed to an increase in the average exposure to neutrons in the He-burning shell of the AGB stars that are the site of the main -process, as expected on theoretical grounds.
-
•
There is limited evidence also from abundance analyses of red giants that the Rb abundance relative to other ls elements increases with decreasing [Fe/H]; Smith’s (1997) collection of results implies [Rb/Zr] increases by about 0.7 dex from [Fe/H] = 0 to –1.5. This increase is attributed to a higher mean neutron density in the He-burning shell of the metal-poor AGB stars. As noted by Smith, this increase is expected on theoretical grounds.
-
•
If the magnitude of the weak -process contributions to the abundances in carbonaceous chondrites were representative of the -process at all relevant [Fe/H], the weak -process could be safely dropped from our search for an explanation of the run of [el/Fe]. A thorough direct check on the weak -process is not possible because the majority of the elements between Rb and the Fe-group are inaccessible spectroscopically. Zinc, which offers at least a hint of the behavior of the weak -process, is assigned 34% to the -process and 66% to the -process in Cowan’s breakdown of solar system abundances. The -process component is essentially entirely due to the weak -process. This breakdown neglects a possible contribution to Zn from the sources that contribute the Fe-group elements. In the metallicity range of interest, [Zn/Fe] = 0.00.15 (Sneden & Crocker 1988). This result, which is barely compatible with the increase of [Eu/Fe] with declining metallicity, implies a drop in [/Fe] with metallicity and justifies our neglect of the weak -process contribution to Rb and other elements.
Guided by these facts, it is possible to predict relative abundances of the heavy elements including Rb. We begin by considering Ba, Nd, and Eu. Eu defines the evolution of the -process products. The observed run of [Ba/Fe] against [Fe/H] provides the evolution of the hs component of the -process after a small correction for this element’s -process component based on the Eu abundances and the meteoritic -process Ba/Eu ratio. The adopted runs of [Eu/Fe] and [Ba/Fe] against [Fe/H] are shown in Fig. Rubidium in Metal-Deficient Disk and Halo Starsa. Then, it is a simple matter to predict the run of [Nd/Fe] using the meteoritic 50–50 split into - and -process contributions. This prediction which is shown too in Fig. Rubidium in Metal-Deficient Disk and Halo Starsa is slightly inconsistent with the observations (Fig. Rubidium in Metal-Deficient Disk and Halo Stars) that show [Nd/Fe] 0 at all metallicities rather than the predicted [Nd/Fe] = 0.14 at [Fe/H] –1. Earlier, we noted that our Nd abundances are quite consistent with previously published results. This small inconsistency appears not to have been noted previously. It is likely that when the measurement errors are included the prediction and observations will overlap. Note that the prediction uses the Eu and Ba abundances as well as the meteoritic to ratios for Ba, Nd, and Eu. A change in the Nd ratio from 50% and 50% to 75% and 25% reduces [Nd/Fe] to 0.0 for metal-poor stars.
Yttrium abundances may be predicted from the [Ba/Fe] observations and Smith’s estimates of [hs/ls] from heavy element enriched red giants such as S and Barium stars. This prediction is shown in Fig. Rubidium in Metal-Deficient Disk and Halo Starsb. The relative underabundance of Y (i.e., [Y/Fe] ) results largely from the steep increase in [hs/ls] with decreasing metallicity that offsets the increase in the -process contribution. This particular prediction assumes a meteoritic ratio of 72% -process and 28% -process and makes no attempt to separate main from weak -process contributions. This prediction matches the observations quite well (see Fig. Rubidium in Metal-Deficient Disk and Halo Stars).
The Rb prediction corresponding to the Y prediction which is also shown in Figure Rubidium in Metal-Deficient Disk and Halo Starsb does not correspond to the observed [Rb/Fe] ratios in metal-poor stars. The limited evidence gathered by Smith suggests that Rb in heavy element enriched red giants is progressively overabundant (relative to Zr) in metal-poor giants. This increase is attributable to a higher neutron density at the -process site in red giants. If a smooth curve is drawn through Smith’s assembled data, the resulting run of [Rb/Fe] is shown in Fig. Rubidium in Metal-Deficient Disk and Halo Starsb. This prediction is in good agreement with the observations.
6 CONCLUDING REMARKS
The principal novel result of our survey of Rb abundances in stars is that rubidium relative to iron is systematically overabundant in metal-poor stars. This increase reflects partly the growth of the -process abundances relative to iron in metal-poor stars; we model this increase using observed Eu abundances and the assumption that the pattern of -process abundances is solar-like at all metallicities. A second and major factor accounting for the increase in the Rb to Fe ratio in metal-poor stars is that the -process contribution to Rb increases with decreasing metallicity. We model this increase using published abundances of Rb and other heavy elements collated by Smith (1997) for -process enriched red giants that are presumed to be representative of the donors of -processed material to the interstellar medium and so to control the chemical evolution of the Galaxy as far as the -process is concerned. Two factors influence the Rb abundance: (i) the total exposure to neutrons at the -process site, the He-burning shell of an AGB star, increases with decreasing metallicity of the red giant, and (ii) the neutron density at the -process site increases with decreasing metallicity. That (i) is true follows from the observed increase of the relative abundance ratio of heavy to light -process elements in the -process enriched red giants. It is this effect that accounts, for example, for the drop in [Y/Fe] in metal-poor stars. That (ii) is true follows from the limited data on Rb abundances in -process enriched red giants. As explained above, neutron density influences the Rb abundance through the branch in the -process path at 85Kr. In this thoroughly empirical way we account for the relative enrichment of Rb in metal-poor stars. In short, the observed [Rb/Fe] ratios of metal-poor stars are consistent with the expectation that AGB stars control the input of main -process products to the Galaxy’s interstellar medium.
A serendipitous discovery is the finding that both members of a visual binary are mild CH stars, HD 23439A and B, with -process overabundances relative to other stars of the same metallicity. Mass transfer across a binary system is now thought to account for CH stars and the Barium stars, the higher metallicity counterparts of the CH stars. HD 23439B is a single-lined spectroscopic binary and the visible star might have been transformed to a CH star by mass transfer from the companion, then an AGB star and now a white dwarf. HD 23439A appears to be a single star that cannot have captured significant amounts of mass from a very distant AGB star orbiting HD 23439B. We suggested, therefore, that these CH stars testify that the halo’s interstellar medium was not entirely chemically homogeneous. This is not too surprising given that -process products are injected into the interstellar medium at low velocity by red giants whereas iron and other elements are injected at very high velocity by supernovae. If the timescale for star formation is shorter than the timescale for thorough mixing of supernovae and red giant ejecta, abundance anomalies will result.
References
- (1) Allen, C. W. 1973, Astrophysical Quantities (3rd ed.; London: Athlone Press)
- (2) Allende Prieto, C., García Lopéz, R. J., Lambert, D. L., & Gustafsson, B. 1999, ApJ, submitted
- (3) Alonso, A., Arribas, S., & Martínez-Roger, C. 1996a, A&A, 313, 873
- (4) Alonso, A., Arribas, D., & Martínez-Roger, C. 1996b, A&AS, 117, 227
- (5) Anders, E. & Grevesse, N. 1989, Geochim. Cosmochim. Acta, 53, 197
- (6) Bard, A., Kock, A., & Kock, M. 1991, A&A, 248, 315
- (7) Beer, H. & Macklin, R. L. 1989, ApJ, 339, 962
- (8) Biémont, E., Grevesse, N., Hannaford, P., & Lowe, R. M. 1981, ApJ, 248, 867
- (9) Blackwell, D. E., Ibbetson, P. A., Petford, A. D., & Willis, R. B. 1976, MNRAS, 177, 219
- (10) Brown, J. A., Tomkin, J., & Lambert, D. L. 1983, ApJ, 265L, 93
- (11) Carlsson, M., Rutten, R. J., Bruls, J. H. M. J., & Shchukina, N. G. 1994, A&A, 288, 860
- (12) Carney, B. W., Latham, D. W., Laird, J. B., Aguilar, L. A. 1994, AJ, 107, 2240
- (13) Cowan, J. J. 1998, private communication
- (14) Drake, J. J. & Smith, G. 1993, ApJ, 412, 797
- (15) Feltzing, S. & Gustafsson, B. 1998, A&AS, 129, 237
- (16) Flynn, C. & Morell, O. 1997, MNRAS, 286, 617
- (17) Fuhr, J. R., Martin, G. A., & Wiese, W. L. 1988, J. Phys. Chem. Ref. Data, 17, Suppl. No. 4
- (18) Fuhrmann, K. 1998, A&A, 338, 161
- (19) Gliese, W. & Jahreiss, H. 1979, A&AS, 38, 423
- (20) Gratton, R. G., Carretta, E., Bragalia, A., & Sneden, C. 1999, in preparation
- (21) Gratton, R. G. & Sneden, C. 1994, A&A, 287, 927
- (22) Gustafsson, B., Bell, R. A., Eriksson, K., & Nordlund, Å. 1975, A&A, 42, 407
- (23) Hackett, P. A., Humphries, M. R., Mitchell, S. A., & Rayner, D. M. 1986, J. Chem. Phys., 85, 3194
- (24) Hannaford, P., Lowe, R. M., Grevesse, N., Biémont, E., & Whaling, W. 1982, ApJ, 261, 736
- (25) Hoffleit, D. & Jaschek, C. 1982, The Bright Star Catalogue (Yale Univ. Observatory, New Haven)
- (26) Holweger, H. & Müller, E. A. 1974, Sol. Phys., 39, 19
- (27) Käppeler, F., Beer, H., & Wisshak, K. 1989, Rep. Prog. Phys., 52, 945
- (28) King, J. R. 1997, AJ, 113, 2302
- (29) Kurucz, R. L., Furenlid, I., Brault, J., & Testerman, L. 1984, Solar Flux Atlas from 296 to 1300 nm, Cambridge, MA: Harvard Univ.
- (30) Lambert, D. L. 1989, in: Cosmic Abundances of Matter; Proceedings of the AIP Conference, Minneapolis, MN, Sept. 7-9, 1988 (A90-31833 13-90). New York, American Institute of Physics, 1989, p.168
- (31) Lambert, D. L., Heath, J. E., Lemke, M., & Drake, J. 1996, ApJS, 103, 183
- (32) Lambert, D. L. & Luck, R. E. 1976, Observatory, 96, 100
- (33) Lambert, D. L., Smith, V. V., Busso, M., Gallino, R., & Straniero, O. 1995, ApJ, 450, 302
- (34) Latham, D. W., Mazeh, T., Carney, B. W., McCrosky, R. E., Stefanik, R. P., & Davis, R. J. 1988, AJ, 96, 567
- (35) Mäckle, R., Griffin, R., Griffin, R., & Holweger, H. 1975b, A&AS, 19, 303
- (36) Mäckle, R., Holweger, H., Griffin, R., & Griffin, R. 1975a, A&A, 38, 239
- (37) May, M., Richter, J., & Wichelmann, J. 1974, A&AS, 18, 405
- (38) McWilliam, A. 1997, ARA&A, 35, 503
- (39) Moore, C. E., Minnaert, M. G. J., & Houtgast, J. 1966, The Solar Spectrum 2935Å to 8770Å, NBS Mono. 61, Washington, U.S. Gov.
- (40) Nissen, P. E., Høg, E., & Schuster, W. J. 1997, Proceedings of the ESA Symposium ‘Hipparcos - Venice ’97’, 13-16 May, Venice, Italy, ESA SP-402 (July 1997), p. 225
- (41) Nissen, P. E. & Schuster, W. J. 1991, A&A, 251, 457
- (42) O’Brian, T. R., Wickliffe, M. E., Lawler, J. E., Whaling, W., & Brault, J. W. 1991, J. Opt. Soc. A., B8, 1185
- (43) Pilachowski, C. A., Sneden, C. & Booth, J. 1993, ApJ, 407, 699
- (44) Pilachowski, C. A., Sneden, S., & Kraft, R. P. 1996, AJ, 111, 1689
- (45) Schuster, W. J. & Nissen, P. E. 1988, A&AS, 73, 225
- (46) Schuster, W. J. & Nissen, P. E. 1989a, A&A, 222, 69
- (47) Schuster, W. J. & Nissen, P. E. 1989b, A&A, 221, 65
- (48) Smith, V. V. 1997, in Synthesis of the Elements in Stars: Forty Years of Progress; Wallerstein, G., Iben, I. Jr., Parker, P., Boesgaard, A. M., Hale, G. M., Champagne, A. E., Barnes, C. A., Käppeler, F., Smith, V. V., Hoffman, R. D., Timmes, F. X., Sneden, C., Boyd, R. N., Meyer, B. S., and Lambert, D. L., Rev. Mod. Phys., 69, 995
- (49) Sneden, C. 1973, PhD thesis, University of Texas at Austin
- (50) Sneden, C. & Crocker, D. A. 1988, ApJ, 335, 406
- (51) Sneden, C., Gratton, R. G., & Crocker, D. A. 1991, A&A, 246, 354
- (52) Sneden, C., and Parthasarathy, M., 1983, ApJ, 267, 757
- (53) Tomkin, J., Edvardsson, B., Lambert, D. L., & Gustafsson, B. 1997, A&A, 327, 587
- (54) Tomkin, J. & Lambert, D. L. 1983, ApJ, 273, 722
- (55) Tomkin, J., Lemke, M., Lambert, D. L. & Sneden, C. 1992, AJ, 104, 1568
- (56) Truran, J. W. 1981, A&A, 97, 391
- (57) Tull, R. G., MacQueen, P. J., Sneden, S., & Lambert, D. L. 1995, PASP, 107, 251
- (58) Ward, L., Vogel, O., Arnesen, A., Hallin, R., & Wännström, A. 1985, Physica Scripta, 31, 161
- (59) Wheeler, J. C., Sneden, C., & Truran, J. W. Jr. 1989, ARA&A, 27, 279
- (60) Wiese, W. L. & Martin, G. A. 1980, “Wavelengths and Transition Probabilities for Atoms and Atomic Ions”, NSRDS-NBS 68 (U.S. Government Printing Office, Washington,D.C.)
- (61) Zhao, G. & Magain, P. 1991, A&A, 244, 425
Figure Captions
The Rb i line at 7800.27 Å and the adjacent Si i line at 7800.00 Å in three of the program stars. The top panel shows a 200,000 resolving-power observation of Cas (G5Vb) and the middle and bottom panels show 60,000 resolving-power observations of HD 65583 (G8V) and HD 108564 (K2V), respectively. Synthesised spectra for [Rb/Fe] of 0.0, 0.3, and 0.6 are shown. In Cas and HD 65583 the high-excitation Si i line ( = 6.18 eV) is much stronger than the low-excitation Rb i line ( = 0.00 eV), but in HD 108564, which is 700 K cooler than Cas and HD 65583, the Rb i line is slightly stronger than the Si i line.
Comparison of derived [Fe/H] for stars in common to the present study and earlier high signal-to-noise ratio, high resolution studies. Literature shorthand citations are: P96 = Pilachowski et al. (1996); S91 = Sneden, Gratton, & Crocker (1991); F98 = Fuhrmann (1998); F97 = Flynn & Morell (1997); D93 = Drake & Smith (1993); T92 = Tomkin et al. (1992); P93 = Pilachowski, Sneden, & Booth (1993); G94 = Gratton & Sneden (1994); K97 = King (1997); G99 = Gratton et al. (1999). The dashed line shows the locus of identical results.
Plots of [Rb/Fe] and [Y/Fe] versus [Fe/H] for the program stars. The three CH stars (HD 23439A and B and BD +5o 3640) are shown with filled-in squares. The error bars for [Rb/Fe] are a quadratic sum of the Rb abundance errors, estimated from the fit of the observed and synthetic spectra of the 7800 Å Rb i line, and the standard deviations of the Fe abundances from individual lines. The error bars for [Y/Fe] are a quadratic sum of the standard deviations of the Y and Fe abundances from individual lines.
Plots of [Zr/Fe] and [Ba/Fe] versus [Fe/H] for the program stars. The three CH stars (HD 23439A and B and BD +5o 3640) are shown with filled-in squares. The error bars for [Zr/Fe] are the quadratic sum of the standard deviations of the Zr and Fe abundances from individual lines. Likewise for [Ba/Fe].
Plot of [Nd/Fe] versus [Fe/H] for the program stars. The two CH stars (HD 23439A and BD +5o 3640) with Nd abundance determinations are shown with filled-in squares. The Nd abundances are based on a single Nd ii line so a fixed error bar is shown for [Nd/Fe].
A Zr i line and a V i line in the two CH stars HD 23439A and B and in a comparison star (HD 103095). The Zr i and V i lines have similar excitation potentials, 0.00 and 1.05 eV, respectively, so their relative strengths are set primarily by the relative Zr and V abundances. The much greater strength of the Zr i line relative to the V i line in HD 23439A and B compared with HD 103095 reveals the enhancement of Zr in HD 23439A and B.
a) The runs of the “heavy” neutron-capture elements Eu, Nd, and Ba as a function of [Fe/H]. The [el/Fe] for Eu and Ba, which are primarily - and -process elements, respectively, are schematic representations of the observed [el/Fe], while that for Nd is predicted on the basis of the behavior of Eu and Ba. See text for details. b) The predicted runs of the “light” neutron-capture elements Rb and Y as a function of [Fe/H]. These predicted abundances for Rb and Y, which also rest on the behavior of Eu and Ba, include allowance for the evolution of [hs/ls] with [Fe/H]. Two predictions are shown for Rb. See text for details.
![[Uncaptioned image]](/html/astro-ph/9905164/assets/x1.png)
![[Uncaptioned image]](/html/astro-ph/9905164/assets/x2.png)
![[Uncaptioned image]](/html/astro-ph/9905164/assets/x3.png)
![[Uncaptioned image]](/html/astro-ph/9905164/assets/x4.png)
![[Uncaptioned image]](/html/astro-ph/9905164/assets/x5.png)
![[Uncaptioned image]](/html/astro-ph/9905164/assets/x6.png)