An Infrared Determination of the Reddening and Distance to Dwingeloo 1
Abstract
We present for the first time infrared observations of the nearby highly obscured galaxy Dwingeloo 1 (Dw1), including deep -band imaging covering a total of , together with and imaging of the central . We used the small dispersion of the intrinsic infrared colors of spiral galaxies to determine an infrared -band extinction of mag towards Dw1. In using infrared colors, the uncertainties in the reddening and distance are reduced by a factor of three. The -band magnitude corrected for extinction and the infrared Tully-Fisher relation are then used to estimate a distance modulus of , and thus a distance of Mpc, which puts Dw1 at the far end of the IC 342/Maffei 1 & 2 group. Our result is largely independent of the nature of the reddening law because we estimated both the reddening and the distance at the same wavelength range.
1 Introduction
Dwingeloo 1 (Dw1) is a large SBb/c galaxy, discovered both in a systematic H i emission survey of the northern part of the Milky Way in search of obscured galaxies in the Zone of Avoidance by Kraan-Korteweg et al. (1994), and independently by Huchtmeier et al. (1995). The knowledge of the local mass distribution has implications for the peculiar velocity field, the direction and amplitude of the Local Group acceleration, the determination of parameters such as and , and on the understanding of the formation and evolution of groups of galaxies (e.g., Peebles 1994; Marinoni et al. 1998). The discovery of this galaxy proved a long standing suspicion that the tidal disruptions of Maffei 2 may be due to the presence of another massive galaxy nearby (e.g., Hurt et al. 1993).
Dw1 lies in the direction of the IC 342/Maffei 1 & 2 group of galaxies, about 2 degrees away from Maffei 2. This corresponds to a physical separation of 175 kpc assuming that Dw1 and Maffei 2 are at a distance of 5 Mpc. Being the nearest barred spiral system, Dw1 offers a unique possibility to study the effect of the bar at high spatial resolution. The discoverers classified Dw1 as an SBb or SBc galaxy (T=4) and measured an angular diameter of 4.2 arcmin. Later on, McCall & Buta (1997) re-classified it to SB(s)cd with an angular diameter of 9.9 arcmin at mag arcsec-2 based on deep optical -band imaging. Burton et al. (1996) extensively studied the neutral hydrogen content of Dw1 and measured H i profile widths at 20% and 50% level of km s-1 and km s-1 respectively. The measured inclination of the gaseous disk was degrees and the position angle 112 degrees, with the major axis aligned with the bar.
Since the discovery of Dw1 the determination of its distance has been hampered by the poorly known Galactic extinction. Optical imaging, long slit spectroscopy, and IRAS observations were summarized by Loan et al. (1996), who used a number of methods to estimate the foreground extinction towards Dw1. The optical color excesses yielded ,mag, the measured Galactic H i column density mag, and the m IRAS flux mag. Finally, they applied optical and -band Tully-Fisher relations to obtain distances ranging from 1.3 to 6.7 Mpc, with an average value of about 4 Mpc (assuming km s-1 Mpc-1). Their main source of uncertainty was the value of the Galactic extinction. Phillipps & Davies (1997) challenged these extreme distance estimates on the basis of the very narrow span of central surface brightness in present day spiral galaxies. Their best estimate for the extinction (mag) places Dw1 at a distance of Mpc. These authors also employed the diameter version of the Tully-Fisher relation (Persic, Salucci, & Stel 1996) and obtained a distance of 2.7 Mpc.
The primary goal of this study was to put stronger constraints on the foreground extinction, and to obtain a better estimate of the distance to Dw1. We chose to use infrared colors because of their small intrinsic variations among spiral galaxies (Aaronson 1977). In addition, the extinction in the -band is about three times smaller than in the -band and about six times smaller than in the -band (Rieke & Lebofsky 1985). Finally, the infrared Tully-Fisher (IRTF) relation shows a smaller intrinsic scatter than its optical counterpart (Aaronson, Huchra, & Mould 1979; Freedman 1990; Peletier & Willner 1993). The IRTF relation allows us to determine both the extinction and the distance at the same wavelength range, minimizing the errors arising from possible variations of the reddening law.
2 Observations and Data reduction
We obtained imaging of Dw1 using a NICMOS3 array at the 2.3-m Bok Telescope of the University of Arizona on Kitt Peak, with a plate scale of arcsec pixel-1 during a number of observing runs. We constructed a deep -band mosaic of Dw1, whereas the and images only covered the central . Additional -band imaging using a array and plate scale arcsec pixel-1 was obtained at the same telescope on a subsequent observing run to calibrate the deep -band imaging. The observational strategy consisted of taking galaxy images interleaved with sky images away from Dw1. Details of the observations are listed in Table 1.
The data reduction included subtraction of dark current frames, flat-fielding with median combined empty sky frames, and sky subtraction. The mosaics were constructed by shifting the images to a common position with cubic spline interpolation. The photometric calibration was performed using observations of standard stars from the lists of Elias et al. (1982) and Hunt et al. (1998) when conditions were photometric. Conditions were non-photometric for the -band mosaic, and this image was self-calibrated using the data. In the next section we will be making use of infrared colors of spiral galaxies to derive an estimate of the extinction to Dw1. The colors for spiral galaxies were obtained with the -band filter, whereas our measurements were taken with the (short-) filter. Therefore it is necessary to determine what the difference is between the two filters. Very recently Persson et al. (1998) have obtained a new set of photometric standards. In their study the average difference between the and magnitudes (for the red standards) is 0.0096 mag, with a standard deviation of 0.017 mag. We assume that the use of the filter instead of the filter introduces an extra uncertainty in the photometric calibration of this filter of mag. The errors associated with the photometric calibration are 0.05, 0.07, 0.06 mag in , and respectively.
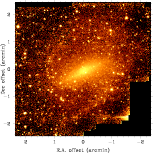
In Figure 1 we display the -band mosaic on a logarithmic scale. As can be seen from this figure, there is a large number of foreground stars which need to be removed prior to analyzing the data. The star removal from the images was done interactively. The affected pixels were then replaced with a linear surface fit to a circular annulus around each star. The automatic procedures failed largely because of PSF variations under non-photometric conditions. A bright star located southwest of the galaxy posed a major problem, and was masked out throughout the data reduction. We assumed radial symmetry and replaced the region within about 90 arcsec from the star with the data from the opposite side of the galaxy. We performed the photometry on the cleaned images measuring the flux within elliptical isophotes with fixed position angle and ellipticity as determined from H i observations (Burton et al. 1996).
3 Discussion
3.1 Colors and Extinction
The surface brightness profiles in are given in Table 2, and displayed in Figure 2 along with the radial distribution of the , and colors, and the total apparent magnitudes in . In both Table 2 and Figure 2 the error bars represent the combined variations from photon statistics, sky background variations, the elliptical isophotal fitting, and the photometric calibration. From the radial distribution of the colors, it is clear that the center of the galaxy appears slightly redder than the outer regions, as it is the case with the infrared colors of most spiral galaxies (Terndrup et al. 1994; de Jong 1996). Loan et al. (1996) report inverse optical color gradients in Dw1, however, this may be the result of active star formation along the bar as found in some barred spirals (Shaw et al. 1995).
Before we tried to obtain an estimate of the extinction using the infrared colors, we fitted straight lines to assess the variation of the colors with increasing apertures,
| (1) |
| (2) |
| (3) |
where is the semi-major axis in units of arcmin. These color gradients imply a change of mag within the inner 2 arcmin of Dw1, which may cause significant uncertainties in the reddening estimate. The smaller field of view of the and images prevents us from obtaining the total colors of Dw1. However, the total flux in the bands is dominated by the inner -diameter region (see Figure 2, bottom panel). Hence, we adopt the total observed colors at radial distance of 1 arcmin from the center of the galaxy to be representative for the whole galaxy (mag, mag, mag). To estimate the color excesses we compared these colors to the mean integrated colors of SBb-SBcd galaxies: mag, mag, mag (Aaronson 1977). We have increased the errors in Aaronson’s colors to account for the uncertain Hubble type of Dw1. The color excesses were converted into -band (), visual () and -band () extinctions using Rieke & Lebofsky (1985, RL85) and Mathis (1990, M90) extinction laws. The results are summarized in Table 3. Henceforth we will use mag from Mathis (1990) extinction law for the sake of compatibility with previous work. This value is close to the estimate based on the IRAS m flux (Loan et al. 1996).
Finally, we used the combined optical - near infrared colors to verify our result. Loan et al. (1996) reported the following total apparent (not corrected for reddening) magnitudes for Dw 1: mag, mag, and mag. We measured a total -band magnitude mag, and compared the observed colors with the intrinsic colors as determined by de Jong (1996): mag, mag, and mag. Mathis (1990) extinction law yields mag, mag, and mag respectively, in good agreement with our infrared estimates.
3.2 Tully-Fisher Distance to Dw1
In order to determine the distance to Dw1, we chose to apply the IRTF relation because of its lower intrinsic dispersion and the reduced extinction in the -band, with the additional advantage that the extinction and the distance are estimated at the same wavelength. The IRTF relation was pioneered by Aaronson et al. (1979). However, we chose to employ the IRTF relation calibrated by Freedman (1990) using local galaxies with Cepheid based distances, and the relations of Peletier & Willner (1993) calibrated relative to the distance of the Ursa Major galaxy cluster.
Freedman’s (1990) calibration for the IRTF relation leads to the following expression: , where is the inclination corrected level H i velocity profile width in km s-1. is the absolute -band magnitude within a circular aperture with diameter , for which , with being the -band isophotal diameter at mag arcsec-2. Using km s-1, which is Burton et al.’s (1996) value corrected for the inclination of the galaxy, the above expression predicts an absolute -band magnitude mag.
Although -band surface photometry for Dw1 is not available, we can make use of the intrinsic integrated colors for Sb-Sc galaxies (de Jong 1996) to estimate . The mag arcsec-2 isophote corresponds to an -band surface brightness (corrected for extinction) of mag arcsec-2. Taking into account the -band extinction this is equivalent to an observed (not corrected for extinction) value of mag arcsec-2. As can be seen from Figure 2 (upper panel), this value exceeds the boundaries of the -band mosaic. However, the surface brightness profile can be easily extrapolated. We fitted an exponential disk (, where is the semi-major axis and is the disk scale length) to the surface brightness profile from a radial distance of 2 arcmin outwards where the bulge contribution in negligible, and estimated a value of arcmin. The apparent -band magnitude (not corrected for extinction) for a circular aperture with diameter of arcmin is then mag, which provides a distance modulus of and a distance of Mpc.
The IRTF relation was initially calibrated for circular apertures because only single-pixel detectors were used at the time (Aaronson, Huchra, & Mould 1979). Naturally, one would expect a transition to elliptical apertures to reduce the internal dispersion of the IRTF relation because they correct for the galaxy inclination. Peletier & Willner (1993) studied the problem in detail and reported no significant change in the calibration of the IRTF relation when elliptical apertures were used. A possible explanation is that the higher internal absorption, which increases with inclination, may cancel out the projection effect. Peletier & Willner (1993) used elliptical apertures and obtained the following calibration for spiral galaxies in the Ursa Major galaxy cluster: . We used a distance modulus to Ursa Major Cluster of mag (Pierce & Tully 1988). This gives mag. However, we are still left with the problem of extrapolating the observed total luminosity profile out to . The measured total (not corrected for extinction) -band magnitude within an elliptical aperture with major axis arcmin and axial ratio 1.56 (Loan et al. 1996) is mag. Correcting for the reddening, we obtained a distance modulus of mag and distance Mpc. The intrinsic spread of Peletier & Willner (1993) IRTF relation and the uncertain distance to the Ursa Major Cluster account for the increased errors of this estimate.
We can now use our reddening estimate to correct the optical and -band photometry of Loan et al. (1996), and use the optical Tully-Fisher relations to obtain another distance estimate. The two reddening laws discussed in the preceding section predict the same / ratio within a few percent. Adopting Mathis (1990) extinction law, we find - and -band extinctions of mag, and mag lower than mag in Loan et al. (1996). This puts Dw1 at an average distance of Mpc.
These distance determinations place Dw1 behind NGC 1560 at Mpc, UGCA 105 at Mpc (Krismer, Tully, & Gioia 1995), and Maffei 1 at Mpc (Luppino & Tonry 1993).
4 Conclusions
We have obtained deep near-infrared imaging of the highly obscured galaxy Dw1. The observed infrared colors were used to obtain a very accurate estimate of the extinction in the -band, mag. This value was confirmed by the optical - near infrared color excesses, and is close to the estimate based on the IRAS m flux (Loan et al. 1996). Our approach is more reliable than previous works in that we did not make any additional assumptions for the relation between and H i, or the IRAS m emission. In addition, the IRTF relation allowed us to estimate both the reddening and distance at the same wavelength range. This makes our results largely independent of the choice of the reddening law, with the additional advantage that the IRTF shows a smaller dispersion than its optical counterpart. Finally, the infrared reddening estimates are more reliable than those in the optical because infrared colors of spiral galaxies show a smaller intrinsic dispersion, and are less sensitive to the history of star formation than optical colors (Vazdekis et al. 1996).
The IRTF relation (Freedman 1990) yielded a distance of Mpc which places Dw1 at the far end of the IC 342/Maffei 1 & 2 group. We also confirmed that Dw1 has an angular diameter greater than 7 arcmin, larger than the originally measured value of 4.2 arcmin.
During the course of this work VDI and AA-H were supported by the National Aeronautics and Space Administration on grant NAG 5-3042 through the University of Arizona. The camera was supported by NSF Grant AST-9529190. We are grateful to the anonymous referee for comments which helped improve the paper.
References
- (1)
- (2) Aaronson, M. 1977, Infrared Observations of Galaxies, Ph.D. Thesis Harvard Univ., Cambridge, MA
- (3) Aaronson, M., Huchra, J. & Mould, J. 1979, ApJ, 229, 1
- (4) Burton, W.B., Verheijen, M.A.W., Kraan-Korteweg, R.C. & Henning, P.A. 1996, A&A, 309, 687
- (5) de Jong, R.S. 1996, A&A, 1996, 313, 377
- (6) Elias, J.H., Frogel, J.A., Matthews, K. & Neugebauer, G. 1982, AJ, 87, 1029
- (7) Freedman, W.L. 1990, ApJ, 355, L35
- (8) Huchtmeier, W.K., Lercher, G., Seeberger, R., Saurer, W. & Weinberger, R. 1995, A&A, 293, L33
- (9) Hunt, L.K., Mannucci, F., Testi, L., Migliorini, S., Stanga, R.M., Baffa, C., Lisi, F. & Vanzi, L. 1998, AJ, 115, 2594
- (10) Hurt, R.L., Merril, K.M., Gatley, I. & Turner, J.L. 1993, AJ, 105, 121
- (11) Kraan-Korteweg, R.C., Loan A.J., Burton, W.B. et al. 1994, Nature, 372, 77
- (12) Krismer, M., Tully R.B. & Gioia, I.M. 1995, AJ, 110, 1584
- (13) Loan, A.J., Maddox, S.J., Lahav, O., et al. 1996, MNRAS, 280, 537
- (14) Luppino, G.A. & Tonry, J.L. 1993, ApJ, 410, 81
- (15) Marinoni, C., Monaco, P., Giuricin, G. & Costantini, C. 1998, ApJ, 505, 484
- (16) Mathis, J. S. 1990, ARA&A, 28, 37
- (17) McCall, M.L. & Buta, R.J. 1997, AJ, 113, 981
- (18) Peebles, P.J.E. 1994, ApJ, 429, 43
- (19) Peletier, R. F. & Willner, S. P. 1993, ApJ, 418, 626
- (20) Persic, M., Salucci, P. & Stel, F. 1996, MNRAS, 281, 27
- (21) Persson, S. E., Murphy, D. C., Krzeminski, W., Roth, M., & Rieke, M. J. 1998, AJ, 116, 2475
- (22) Phillipps, S. & Davies, J. I. 1997, A&A, 327, 963
- (23) Pierce, M.J. & Tully, R.B. 1988, ApJ, 330, 579
- (24) Rieke, G. H. & Lebofsky, M. J. 1985, ApJ, 288, 618
- (25) Shaw, M., Axon, D., Probst, R. & Gatley, I. 1995, MNRAS, 274, 369
- (26) Terndrup, D.M., Davies, R.L., Frogel, J.A., DePoy, D.L. & Wells, L.A. 1994, ApJ, 432, 518
- (27) Vazdekis, A., Casuso, E., Peletier, R.F. & Beckman, J.E., 1996, ApJS, 106, 307
Figure Captions
Figure 1.— -band mosaic of Dw1 displayed on a logarithmic scale. The orientation is north up, east to the left. The field of view is .
Figure 2.— Upper panel: Observed surface brightness profiles in , and as a function of the semi-major axis. The dashed line is our exponential disk fit (see text). Middle panel: Radial distribution of the , and colors. The straight lines represent a linear fit to the color gradients as a function of the semi-major axis (see text). Bottom panel: Observed total magnitude as a function of the semi-major axis in , and . In all three panels, the vertical bars represent errors.
| Detector | Filter | Date | Conditions | seeing | |
|---|---|---|---|---|---|
| (s) | (arcsec) | ||||
| 600 | Nov 5 1998 | photometric | 1.2 | ||
| 780 | Jan 1 1999 | non-photometric | 1.5 | ||
| 1800 | Dec 30 1998 | non-photometric | 1.1 | ||
| 720 | Nov 5 1998 | photometric | 1.1 | ||
| 760 | Jan 6 1999 | photometric | 1.0 |
| Semi-major | ||||||
|---|---|---|---|---|---|---|
| (1) | (2) | (3) | (4) | (5) | (6) | (7) |
| 1.2 | 18.35 | 0.14 | 17.21 | 0.15 | 16.80 | 0.18 |
| 3.6 | 18.87 | 0.06 | 17.88 | 0.06 | 17.42 | 0.07 |
| 6.0 | 19.09 | 0.07 | 18.05 | 0.06 | 17.63 | 0.07 |
| 8.4 | 19.29 | 0.07 | 18.18 | 0.06 | 17.74 | 0.07 |
| 10.8 | 19.39 | 0.07 | 18.36 | 0.06 | 17.88 | 0.07 |
| 13.2 | 19.57 | 0.06 | 18.50 | 0.06 | 18.07 | 0.07 |
| 15.6 | 19.72 | 0.06 | 18.62 | 0.07 | 18.20 | 0.07 |
| 18.0 | 19.88 | 0.06 | 18.74 | 0.07 | 18.33 | 0.07 |
| 20.4 | 19.98 | 0.06 | 18.87 | 0.07 | 18.47 | 0.07 |
| 22.8 | 20.08 | 0.06 | 18.96 | 0.07 | 18.56 | 0.07 |
| 25.2 | 20.18 | 0.06 | 19.07 | 0.07 | 18.69 | 0.07 |
| 27.6 | 20.27 | 0.06 | 19.15 | 0.07 | 18.78 | 0.07 |
| 30.0 | 20.36 | 0.06 | 19.25 | 0.07 | 18.88 | 0.07 |
| 32.4 | 20.40 | 0.06 | 19.29 | 0.07 | 18.91 | 0.07 |
| 34.8 | 20.46 | 0.06 | 19.34 | 0.07 | 19.00 | 0.07 |
| 37.2 | 20.50 | 0.06 | 19.41 | 0.07 | 19.06 | 0.07 |
| 39.6 | 20.55 | 0.06 | 19.49 | 0.06 | 19.09 | 0.07 |
| 42.0 | 20.59 | 0.06 | 19.55 | 0.06 | 19.15 | 0.07 |
| 44.4 | 20.64 | 0.06 | 19.59 | 0.06 | 19.19 | 0.07 |
| 46.8 | 20.70 | 0.06 | 19.62 | 0.06 | 19.27 | 0.07 |
| 49.2 | 20.74 | 0.06 | 19.69 | 0.06 | 19.33 | 0.07 |
| 51.6 | 20.76 | 0.06 | 19.76 | 0.06 | 19.38 | 0.07 |
| 54.0 | 20.80 | 0.06 | 19.79 | 0.06 | 19.43 | 0.07 |
| 56.4 | 20.87 | 0.06 | 19.83 | 0.06 | 19.43 | 0.07 |
| 58.8 | 20.91 | 0.06 | 19.89 | 0.06 | 19.47 | 0.07 |
| 61.2 | 19.91 | 0.06 | ||||
| 70.8 | 20.04 | 0.06 | ||||
| 80.4 | 20.13 | 0.06 | ||||
| 90.0 | 20.21 | 0.06 | ||||
| 99.6 | 20.35 | 0.06 | ||||
| 109.2 | 20.44 | 0.07 | ||||
| 118.8 | 20.53 | 0.07 | ||||
| 128.4 | 20.68 | 0.07 | ||||
| 138.0 | 20.85 | 0.07 | ||||
| 147.6 | 21.01 | 0.08 | ||||
| 157.2 | 21.13 | 0.08 | ||||
| 166.8 | 21.08 | 0.21 | ||||
| 176.4 | 21.38 | 0.10 |
Note. — Column (1) is the semimajor axis in arcsec. Columns (2), (4) and (6) are the observed surface brightnesses expressed in mag arcsec-2 in , , and . Column (3), (5) and (7) are the 3 errors (see text).
| ColorsaaColors (not corrected for extinction) at 1 arcsec radial distance as obtained from the fits (see text). | |||
| Photometric errors | |||
| Fit errors ††footnotemark: | |||
| Total errors | |||
| Intrinsic colors | |||
| Color excesses | |||
| (M90) | |||
| (RL85) | |||
| (M90) | |||
| (RL85) | |||
| (M90) | |||
| (RL85) |