Effect of the large scale environment on the stellar content of early-type galaxies ††thanks: Based on observations collected at the Observatoire de Haute-Provence
Abstract
In order to study the influence of the environment on the stellar population of early-type galaxies we have analyzed the relations between the density of the environment and the residuals to the – relation, , and between and the residuals to the Fundamental Plane, . Our sample of galaxies covers the range of densities, between field galaxies and poor clusters. We confirm the existence of a slight environmental bias on the mean stellar population and we show that this effect is due to a small fraction of galaxies containing a younger stellar sub-population while the majority of galaxies, in any environment, are equally old. The galaxies which are likely to contain a young stellar sub-population (negative and ) are preferentially found in the less dense environment.
This segregation of the stellar population may reflect the morphology-density relation or may result from a higher rate of recent star formation activity in sparse environments. Using the rotational support, , to assess the presence of a disk and to parameterize the morphology, we subtracted the contribution of the morphological segregation to population segregation. It is not yet possible to rule out that the morphology-density relation is at the origin of the population-density relation.
Key Words.:
galaxies: general – galaxies: elliptical and lenticular, cD – galaxies: fundamental parameters – galaxies: stellar content – galaxies: formation1 Introduction
The comparison of the stellar populations at different distances (e.g., Bender et al. Be+93 (1993), Ziegler & Bender ZB97 (1997), Stanford et al. Stan98 (1998)) shows that early-type galaxies (E and S0) are essentially old and undergo only a passive evolution. Even in sparse environments, where hierarchical models of galaxy formation predict a younger age, the mean ages are not dramatically younger (Jørgensen Jor97 (1997), Bernardi et al. Ber98 (1998)). However, a fraction of elliptical galaxies contains also a younger component. This is apparent from statistical analyses, eg. Forbes et al. (For98 (1998)), and strong evidence comes from the observation of merger remnants (e.g., NGC 7252, Schweizer Sch82 (1982)) which will turn into “normal” ellipticals after a couple of gigayears.
These intermediate-age sub-populations provide the framework for understanding the connection between fine structures and spectral peculiarities (Schweizer et al. S+90 (1990)) and probably also for interpreting the peculiar velocities found in clusters (Gregg Gr92 (1992)) and residuals to the Fundamental Plane (Prugniel & Simien PS96 (1996)).
It is generally accepted that the rate of star formation in early-type galaxies is enhanced in low-density environment (Schweizer & Seitzer SS92 (1992), de Carvalho & Djorgovski dCD92 (1992), Guzmán et al. G+92 (1992), Rose et al. Ros94 (1994), Jørgensen & Jønch-Sørensen JJ98 (1998)). It results in a population – density relation: The metallic features in the spectra (eg. ) are weaker and the Balmer lines stronger in low-density regions.
However, the interpretation of this environmental dependence is not straightforward. For example, Mehlert et al. (M+98 (1998)) interpret the dependence of on the distance to the center of the Coma cluster, previously found by Guzmán et al. (G+92 (1992)), as a bias in the morphological classification. The “young” early-type galaxies found in the outskirts of Coma would actually be lenticular galaxies, and the population segregation would simply reflect the morphological segregation.
Because the stellar population varies with the Hubble type, at least part of the population – density relation is likely a by-product of the morphology-density relation (Dressler Dr80 (1980), Dr84 (1984), Whitmore et al. WGJ93 (1993); the fraction of early-type galaxies is higher in dense regions). Conversely, the population segregation may bias the morphological classification (for spiral galaxies) and hence contribute to the morphological segregation (Koopmann & Kenney KK98 (1998)).
The question left open is to determine the fraction of the population segregation due the morphological segregation. It is connected with that of the origin of the morphological segregation (Martel et al. Mar98 (1998)). This segregation may be due to initial conditions, morphological evolution (due to gas stripping and mergers), or a combination of both. The first hypothesis is difficult to defend in the light of the existence of clear cases of merger remnants. If the environment is responsible for a significant morphological evolution, it will also be at the origin of a population segregation (at a given morphological type) because the morphological transformations are accompanied with star formation.
In elliptical galaxies, the “young” stellar sub-populations are likely due to merging with a gas-rich companion that occurred at maximum a couple of gigayears ago. In lenticular galaxies, the recent populations may be the result of the residual star formation in the gaseous disk. The first class of object will not be subject to the morphological segregation, while the second will be (in this case the morphology is related to the importance of the disk). Subtracting the contribution of the morphological segregation to the observed population segregation, would in principle allow to determine the present rate of environmentally triggered star formation.
The aim of this Letter is to study the population segregation in the sample of nearby early-type galaxies presented in Prugniel & Simien (PS96 (1996)), and to address the question of its origin. We will first parameterize the density of the environment using the HYPERCAT database (http://www-obs.univ-lyon1.fr/hypercat). Then we will use two diagnostics to detect the presence of a young stellar sub-population. The first one is the analysis of the residuals, , to the well-known relation between the magnesium line strength index and the central velocity dispersion (Terlevich et al. Ter81 (1981), Bender et al. Be+93 (1993)). The second approach similarly analyses the residuals to the Fundamental Plane (FP), , following the line of Prugniel & Simien (PS94 (1994), PS96 (1996), and PS97 (1997), collectively referred as PS). The analysis of the rotational support of the galaxies where a young sub-population is detected will allow to determine if the age segregation is linked to the morphology-density relation.
2 Analysis
Our sample of galaxies, described in PS, consists in nearby early-type galaxies in different environments. Photometric and kinematic observations were obtained using the 1.20m and 1.93m telescopes of Observatoire de Haute Provence and the CARELEC long-slit spectrograph. This material is already presented in details in Prugniel & Héraudeau (PH98 (1998)), Prugniel & Simien (PS94 (1994)), Simien & Prugniel (1997a , 1997b , and 1997c ), and Golev et al. (Go+99 (1999)). All the data are also available through HYPERCAT. Both (Lick system) and are aperture corrected and standardized to an homogeneous system (see Golev & Prugniel GP98 (1998)).
The sample includes bona-fide elliptical and lenticular galaxies as well as merger remnants. The classification was made on the basis of literature assessments and presence of peculiarities: galaxies with morphological disturbances, dust-lanes, post-mergers … were rejected from the bona-fide elliptical subsample (Prugniel & Simien PS96 (1996)). This classification is clearly subjective, and some of the bona-fide ellipticals may actually hide a disk and should be re-classified as lenticular. This is a general drawback of the morphological classification of galaxies (see Kormendy & Bender KoBe96 (1996), Andreon AND98 (1998)). In this paper, the bona-fide ellipticals subsample will be used as a reference for determining the FP and – relations.
2.1 Parmeterizing the density
To study environmental effects, we will define a parameter to measure the density of the environment. Ideally, the density of the environment should be the number of galaxies per megaparsec cubes locally measured in a given volume around a galaxy. For our purpose, the smoothing-volume will be the group or cluster the galaxy belongs to. The underlying idea is to characterize the mean environment of a galaxy over its years life in order to connect the density of this environment with the stellar population built over the same period.
We will start from the sample of galaxies with measured radial velocity smaller than 9000 km sec-1extracted from HYPERCAT (the velocity data compilation primarily comes from the LEDA database111 http://www-obs.univ-lyon1.fr/leda ). It contains 22689 galaxies, but is not complete in apparent magnitude or diameter. Extracting a magnitude-limited whole-sky sample would produce a list of galaxies too restricted to allow proper determinations of the density of the environment. We prefer to apply completeness corrections to the present sample. Since the number of galaxies per 1000 km sec-1shell is almost constant in the sample, assuming a uniform distribution of the galaxies in all the volume suggests a completeness correction: (where and are respectively the un-corrected and corrected densities, in relative units, and the distance of the group or cluster in km sec-1). We do not apply correction for galaxies nearer than km sec-1. This correction supposes that the list of galaxies with known redshift uniformly samples the real distribution of galaxies. This is a crude hypothesis, since most redshift surveys concentrated on limited regions (in particular clusters), and this could lead to an overestimation of the density in the regions of deep redshift surveys. To check the magnitude of this bias, we compared the redshift sample with the UGC and ESO samples (which are diameter limited). We found, that the density projected on the sky of the redshift catalogue, normalized to the density in the UGC and ESO samples, fluctuates by a factor 2 rms (the density was smoothed in 5 degree diameter disks). We did not attempt to use this result to modify the completeness correction, because that would have supposed to apply a further correction to the UGC/ESO samples, making assumptions on the luminosity function of galaxies, which would carry uncertainties not smaller than a factor 2 also.
The algorithm to group the galaxies is described in Golev & Prugniel (GP98 (1998)). It associates a group to all the galaxies in the sample, returning the mean (flow) velocity, the radius and the number of galaxies grouped. This is used to compute the density and also the aperture corrections which are applied to the and data. Rescaled to the mean density of Virgo, this algorithm gives for Fornax, 4 for Coma and about 0.3 for Leo or NGC 5846 groups. These values restore the hierarchy of concentrations between these different groups and clusters, thus validating our measurements of . The density provides a smooth parameterization of the field-group-cluster classification. Our sample covers mostly the range of low densities, from field galaxies to poor clusters.
2.2 Residuals to the - relation
The existence of a tight correlation between and was discovered by Terlevich et al. (Ter81 (1981)) and further discussed in Burstein et al. (Bur88 (1988)) and Bender et al. (Be+93 (1993)). The slope of this relation is clearly due to the metallicity, and not age, as assessed by the constancy of the slope of the color-magnitude relations out to z0.9 (Stanford et al. Stan98 (1998), Kodama et al. Kod98 (1998)). At variance, the spread around this relation is likely due to the contribution of young sub-populations which results in a skewness of the residuals (Burstein et al. Bur88 (1988), Prugniel & Simien PS96 (1996)).
We have used the subsample of bona-fide ellipticals to fit the relation between and taking properly into account the errors on both coordinates. The residuals, , fitted on 308 objects, are defined as:
| (1) |
The estimated error on calculated is . This fit is in agreement with Guzmán & Lucey (rguz193 (1993)) and with Davies et al. (rldav187 (1987)) who both find a slope of .
Separating this sample in two parts according to the density, we find (154 galaxies) and (154 galaxies) respectively for the high- and low- density subsamples. The difference, , perfectly agrees with similar estimates by Jørgensen (Jor97 (1997)) and Bernardi et al. (Ber98 (1998)).
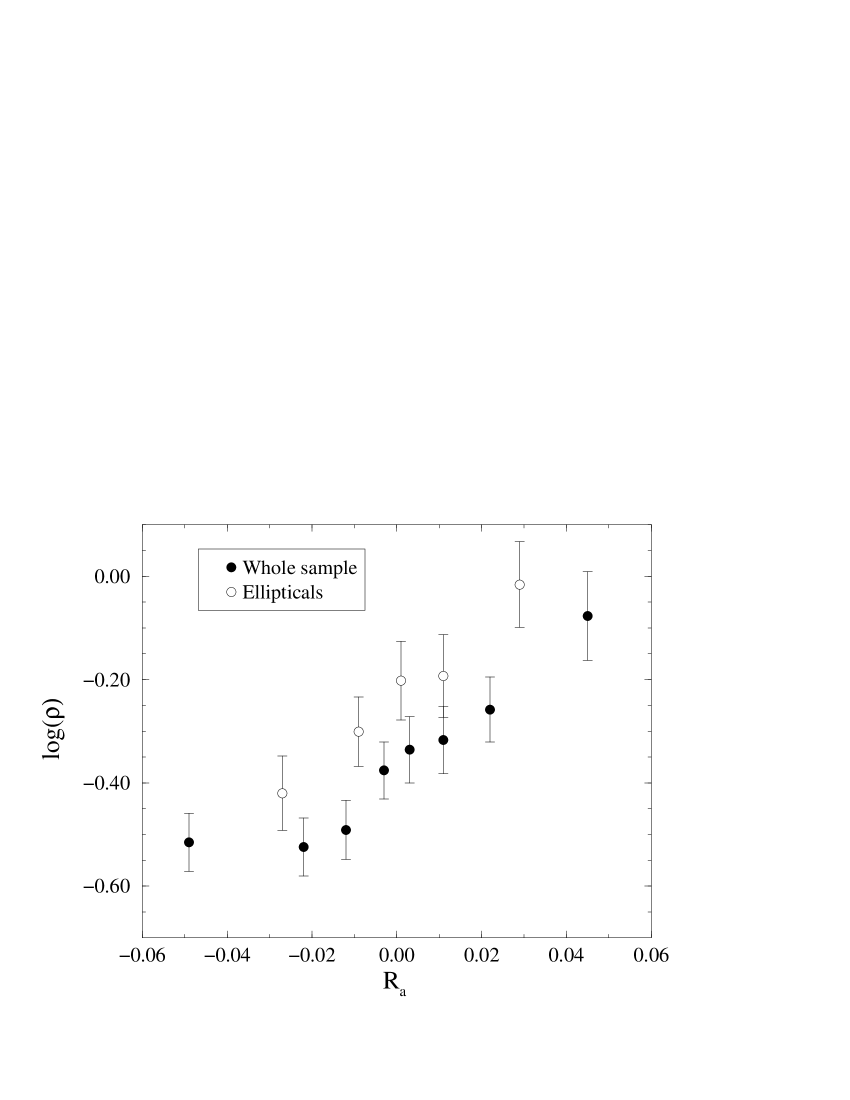
In the present analysis, we are interested in the nature and environment of early-type galaxies hosting a young sub-population. For this purpose, Fig. 1 presents the average as a function of . The galaxies are grouped in bin of similar (ie. presumably similar stellar population). The trend for galaxies with most negative residuals to be located in lower density environment is clear.
We have over-plotted in Fig. 1 the subset of elliptical galaxies, it is interesting to note that the same tendency is observed, but with a slight offset toward higher density at a given . This offset probably reflects the morphology-density relation: For a given , elliptical galaxies reside in denser environments than lenticular galaxies. In addition, assuming that our sample of elliptical galaxies is morphologically homogeneous, ie. not contaminated by S0 galaxies, the fact that they are also segregated indicates that the population-density relation may be more than a by-product of the morphology-density relation.
Negative values may be due either to a low or symmetrically to a high . While the first hypothesis is the most favored in the frame of the usual interpretation, the second may result from the dynamical evolution of galaxies harassed by gravitational encounters. In order to check this possibility we will analyze the residuals to the FP: A low or a high will result in opposite residuals.
2.3 Residuals to the Fundamental Plane
We performed a fit of the FP using the subsample of 291 bona-fide elliptical galaxies (17 galaxies were excluded from the 308 galaxies sample because of the lack of reliable photometry):
| (2) |
is the residual to the FP, , the central velocity dispersion (in km sec-1) and respectively the asymptotic magnitude and mean surface brightness within the effective aperture in the B band, and are the free parameters. Their best fit values are: , , similar to the values previously reported in PS.
Note that we fitted the classical FP, ie., we did not include the additional terms accounting for the stellar population, the rotational support and the non-homology of the spatial structure (see PS). Since we precisely want to use the residuals to the fundamental plane as a parameterisation of the stellar population, we did not include the first scaling relation in the FP equation. Including the two latter would have dramatically reduced the size of the sample and is not useful to the present goal.

In Fig. 2 we present the average of as a function of . Each point on the figure represents 40 galaxies. There is a (somewhat marginal) tendency for the galaxies with the more negative residuals to be found in lower density environments.
Splitting the sample in two parts, we find for , (154 galaxies), and for , (264 galaxies). The uncertainty on the mean being about 0.06, the difference is significant at the 3 level.
Repeating this on arbitrary extracted subsamples of half the total size produce the same result. Therefore, we conclude that the trend is significant. Since there is no reason why the measurement errors could be connected with the environment, we conclude that the relation is physically significant.
Combining the results from the and analyses, we confirm the existence of a population segregation, and extend it to the low-density environments.
3 The origin of the population segregation
Our result fits in the frame of the current paradigm suggesting a reduced rate of star formation in high density environments. The morphology-density relation, the HI deficiency of cluster spirals or the relative isolation of shell galaxies are classically interpreted as the result of past gravitational interactions which both stimulated the star formation earlier in the life of the galaxies and stripped the dense gas, prohibiting present-epoch star formation.
We will now try to extract the fraction of the population segregation due to recent merging or accretion of a gas-rich companion, which cannot be accounted for by the morphological segregation.
3.1 Evidence for recent merging events and star formation triggered by gravitational encounters
Apart the violent cases of star forming galaxies often associated with strong interactions or mergers, the “weak” interactions have also been related with the presence of a young stellar component. In particular, Schweizer et al. (S+90 (1990)) and Schweizer & Seitzer (SS92 (1992)) found clear correlations between the anomalies on the colors, , and CN, and the fine structure index (indicating the amount of shells, ripples, boxiness, etc.). Gregg (Gr92 (1992)) showed that the -index is also correlated with the residuals to the FP (peculiar velocities in his terminology). To summarize, the presence of a “young” sub-population is clearly associated with merging events or gravitational encounters. Hence, this population effect is expected to depend on the environment.
Indeed, Guzmán et al. (G+92 (1992)) found a difference between the galaxies located in the outer and inner regions of the Coma cluster. The former have negative residuals (i.e. they are younger or less metallic). Bower et al. (Bo+92 (1992)) found a difference between the Coma and Virgo clusters, but this could also be an observational effect due to the difference in the projected slit sizes. Recently Jørgensen & Jønch-Sørensen (JJ98 (1998)) showed that the colors and the absorption-line indices of E and S0 galaxies belonging to the poor cluster S 639 indicate that the stellar populations in these galaxies are probably younger (or less metallic) than those in rich clusters. This is in agreement with the results by de Carvalho and Djorgovski (dCD92 (1992)), Jørgensen (Jor97 (1997)) and Bernardi et al. (Ber98 (1998)).
It is important to note that these previous works searched for mean-age differences as a function of the environment. For instance, Bernardi et al. (Ber98 (1998)) found a zero-point difference on the – relation of between cluster and field ellipticals, compatible with our comparison between the high- and low-density subsamples. Assuming a single burst stellar population model (Worthey Wor94 (1994)), this corresponds to an age difference of about 1 Gyr.
In the present work, we found a much stronger difference when grouping the galaxies according the or residuals. The galaxies containing a younger stellar population are clearly found in lowest-density environment, but, in any environment, the majority of the early-type galaxies have only an old population. The rare galaxies containing young stars form the tail of negative residuals noted in Burstein (Bur88 (1988)) and Prugniel& Simien (PS96 (1996)). This same skewness is also apparent in the distribution of the color-magnitude diagrams. It is also reminiscent of the population of blue galaxies in clusters (Butcher-Oemler effect; Aragón-Salamanca et al. Ara91 (1991)). If we compare the median of , less sensitive to the skewness, instead of the average, the difference between the high- and low-density subsamples vanishs.
We also tried to connect the residuals with the small-scale density of the environment by weighting the galaxies according to their separation on the sky when computing the density, with the scope of defining a “strength of the tidal field”. We experimented different weightings, but failed to find evidence for an effect related with the “tidal” field. Only the large scale environment correlates with the stellar content.
3.2 Subtracting the morphological segregation
If the morphological segregation results from the morphological segregation, should also correlate with any other parameter dependent on the morphological type. Such parameter could be the signature of a disk, as detected from image analysis (Scorza and Bender Sco95 (1995)) or from the rotational support (, where is the observed maximum rotational velocity). Both of these parameters are affected by projection effects and are available only for a restricted subsample. We will use , taken from HYPERCAT.
In our sample, is available for 272 galaxies: 157 ellipticals and 115 lenticulars, the mean values are respectively: and (The corresponding mean are: and ). The difference is clear and shows that is fairly correlated with the morphology, but the morphology-density relation is here very marginal.
Because of the smaller statistics the – correlation is much noisier than in Fig. 1, but the effect is still marginally observed in the subsample: The mean for is (162 galaxies) and for (114 galaxies). The corresponding mean are: and . The difference is marginally significant
The – correlation, represents the morphology – density relation, it is fitted as: . It predicts a difference in between the two subsamples, and , of: . This is about of the observed effect. However, taking into account the large uncertainties, it is not possible to reject the possibility that the totality of the stellar population segregation may be due to the morphology – density relation.
Repeating the analysis on reproduces the dynamical effect found by Prugniel & Simien (PS94 (1994)) and does not help to understand the origin of the population segregation.
4 Conclusion
Analyzing the residuals to the – and Fundamental Plane relations as a function of the large scale density of the environment, we find a segregation of the stellar population. The early-type galaxies with a line strength index weaker than expected from their value of are preferentially found in low-density regions. These galaxies are likely to contain an excess of young stars, presumably formed after a gravitational encounter or merging event that occurred in the last gigayears. This extends previous results to very sparse environments.
However, we cannot rule out that this effect is a by-product of the morphological segregation. Indeed, even our subsample of bona-fide ellipticals may still be contaminated by some lenticular galaxies seen almost face-on or with a weak disk, and the observed segregation could be due to residual star formation in these galaxies expected to be found mostly in low-density regions. We tried to use the observed rotational support, , to parameterize the morphology, as it traces the presence of a disk. The morphology-density relation seems to account for part of the segregation observed on stellar population, but the data are still too noisy to exclude that it is the totality. New data on a larger sample are needed.
Acknowledgements.
We are grateful to the telescope operators at Observatoire de Haute-Provence for their help during the observations. VG thanks the CRAL-Observatoire Astronomique de Lyon for an invited-astronomer position. We thank Guy Worthey for remarks that have improved the paper.References
- (1) Andreon, S., 1998, ApJ 501, 533
- (2) Aragón-Salamanca, A., Ellis, R., Sharples, R., 1991, MNRAS 248, 128
- (3) Bender, R., Burstein, D., Faber, S. M., 1993, ApJ 411, 153
- (4) Bernardi, M., Renzini, A., da Costa, L.N. et al. 1998, ApJ 508, L143
- (5) Burstein, D., Davies, R., Dressler, A. Faber, S., Lynden-Bell, D. 1988, in Towards understanding galaxies at large redshift, 17
- (6) Bower, R. G., Lucey, J. R., Ellis, R. S., 1992, MNRAS 254, 601
- (7) Davies, R. L., Burstein, D. , Dressler, A. , et al. , 1987, ApJS 64, 581
- (8) de Carvalho, R. R., Djorgovski, S., 1992, ApJ 389, L49
- (9) Dressler, A., 1980, ApJ 236, 351
- (10) Dressler, A., 1984, ARA&A 22, 185
- (11) Forbes, D.A., Ponman, T., Brown, R, 1998, ApJ 508, L43
- (12) Golev, V., Prugniel, Ph., 1998, A&AS 132, 255
- (13) Golev, V., Prugniel, Ph., Simien, F., Longhetti, M., 1999, A&AS, in press
- (14) Gregg, M., 1992, AJ 384, 43
- (15) Guzmán, R., Lucey, J. R., Carter, D., Terlevich, R. J., 1992, MNRAS 257, 187
- (16) Guzmán, R. & Lucey, J. R., 1993, MNRAS 263, L47
- (17) Jørgensen, I., 1997, MNRAS 288, 161
- (18) Jørgensen, I., Jønch-Sørensen, H., 1998, MNRAS 297, 968
- (19) Kodama, T., Arimoto, N, Barger, A.J., Aragón-Salamanca, A., 1998, A&A 334, 99
- (20) Kormendy, J. Bender, R., 1996, ApJ 464, L119
- (21) Koopmann, R.A., Kenney, J.D., 1998, ApJ 497, L75
- (22) Kuntschner, H., Davies, R. L., 1998, MNRAS 295, L29
- (23) Martel, H., Premadi, P., Matzne, R., 1998, ApJ 497, 512
- (24) Mehlert, D., Bender, R., Saglia, R., Wegner, G., 1998, A&A 332, 33
- (25) Prugniel, Ph., Héraudeau, Ph., 1998, A&AS 128, 299
- (26) Prugniel, Ph., Simien, F., 1994, A&A 282, L1
- (27) Prugniel, Ph., Simien, F., 1996, A&A 309, 749
- (28) Prugniel, Ph., Simien, F., 1997, A&A 321, 111
- (29) Rose, J., Bower, R., Caldwell, N. et al. 1994, AJ 108, 2054
- (30) Schweizer, F., 1982, ApJ 252, 455
- (31) Schweizer, F., Seitzer, P., 1992, AJ 104, 1039
- (32) Schweizer, F., Seitzer, P., Faber, S. M., Burstein, D., Dalle Ore, C., González, J. J., 1990, ApJ 364, L33
- (33) Scorza, C., Bender, R. 1995 A&A 293, 20
- (34) Simien, F., Prugniel, Ph., 1997a, A&AS 112, 521
- (35) Simien, F., Prugniel, Ph., 1997b, A&AS 126, 15
- (36) Simien, F., Prugniel, Ph., 1997c, A&AS 126, 519
- (37) Stanford, S., Eisenhardt, P., Dickinson, M. 1998 ApJ 492, 461
- (38) Terlevich, R., Davies, R., Faber, S., Burstein, D., 1981, MNRAS 196, 381
- (39) Whitmore, B., Gilmore, D., Jones, C., 1993, ApJ 407, 489
- (40) Worthey, G., 1994, ApJ 418, 947
- (41) Ziegler, B. L., Bender, R., 1997, MNRAS 291, 527