email: skomossa@xray.mpe.mpg.de
The central radio source in the NGC 383 group:
jet - IGM interaction ?
Abstract
The NGC 383 group is a rich group of galaxies that harbours the central radio source 3C 31 = NGC 383. After presenting results from the X-ray analysis of the extended intra-group medium and the central radio galaxy, we discuss the spatial morphology of X-ray emitting gas as compared to the radio plasma and perform a comparison of the pressures of both components.
To appear in the proceedings of the Ringberg workshop on
‘Diffuse Thermal and Relativistic Plasma in Galaxy Clusters’
(Ringberg castle, April 19-23, 1999); MPE Report.
1 Introduction
The rich group of galaxies around NGC 383 at redshift =0.017 is located in the Perseus Pisces filament (e.g., Zwicky et al. 1961, Arp 1966, Sakai et al. 1994). The brightest member galaxy, NGC 383 = 3C 31, is a moderately bright radio galaxy and has been extensively studied at radio wavelengths in the past (e.g., Klein & Wielebinski 1979, Ekers et al. 1981, Condon et al. 1991, Artyukh et al. 1994, Lara et al. 1997). It shows a symmetric edge darkened double-source structure with two strong jets. The origin of the structures seen in the radio morphology of dominant cluster/group members is still not well understood. The structures of the jets of NGC 383 were interpreted by Blandford & Icke (1978) as arising from the tidal interaction with the companion galaxy NGC 382. However, based on optical data Fraix-Burnet et al. (1991) found no evidence for interaction between the two galaxies.
Here, we present an analysis of the X-ray properties of NGC 383, the extended intra-group medium (IGM), and a search for radio-X-ray relations on the basis of our ROSAT PSPC observations. These data presented here have been previously partly analyzed by Trussoni et al. (1997; T97 hereafter) in a study of hot coronae in nearby radio galaxies. A re-analysis of the ROSAT data and new ASCA results have been recently presented by Hwang et al. (1999). For details on the present study, see Komossa & Böhringer (1999).
Physical parameters are calculated for = 50 km/s/Mpc and = 0.5. For the distance of the NGC 383 group, 1′′ corresponds to a scale of 0.5 kpc.
2 X-ray analysis of the intra-group medium
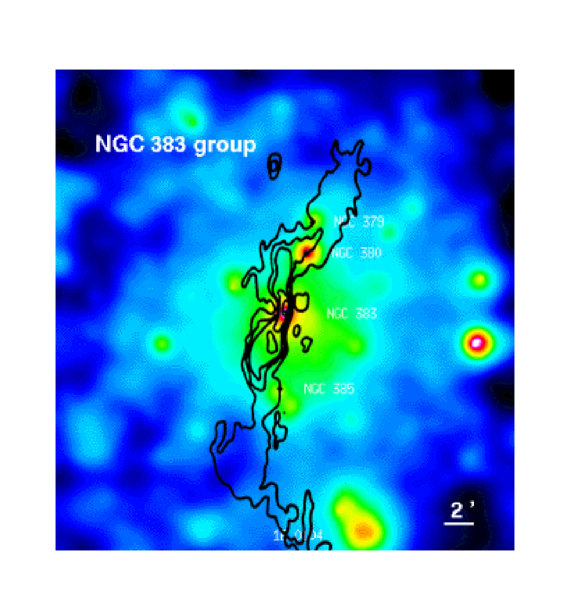
Widely extended X-ray emission is present (Fig. 1). Its spectrum is best described by thermal ‘Raymond & Smith’ emission with a temperature of 1.5 keV (using metal abundances of 0.3 solar), approximately constant in the measured region. The total (0.1-2.4 keV) X-ray luminosity is erg/s.
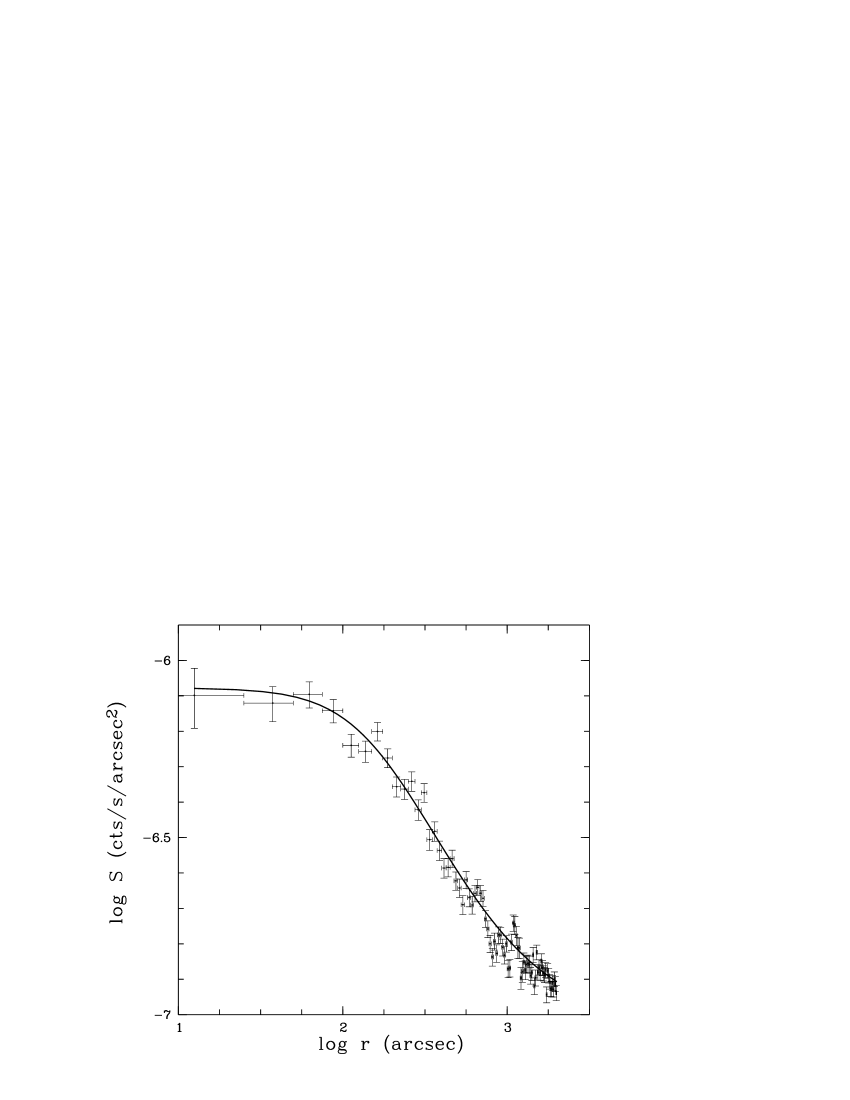
The extended X-ray emission can be traced out to a distance of 33′, corresponding to 1 Mpc. Fitting a standard ‘-model’ of the form
| (1) |
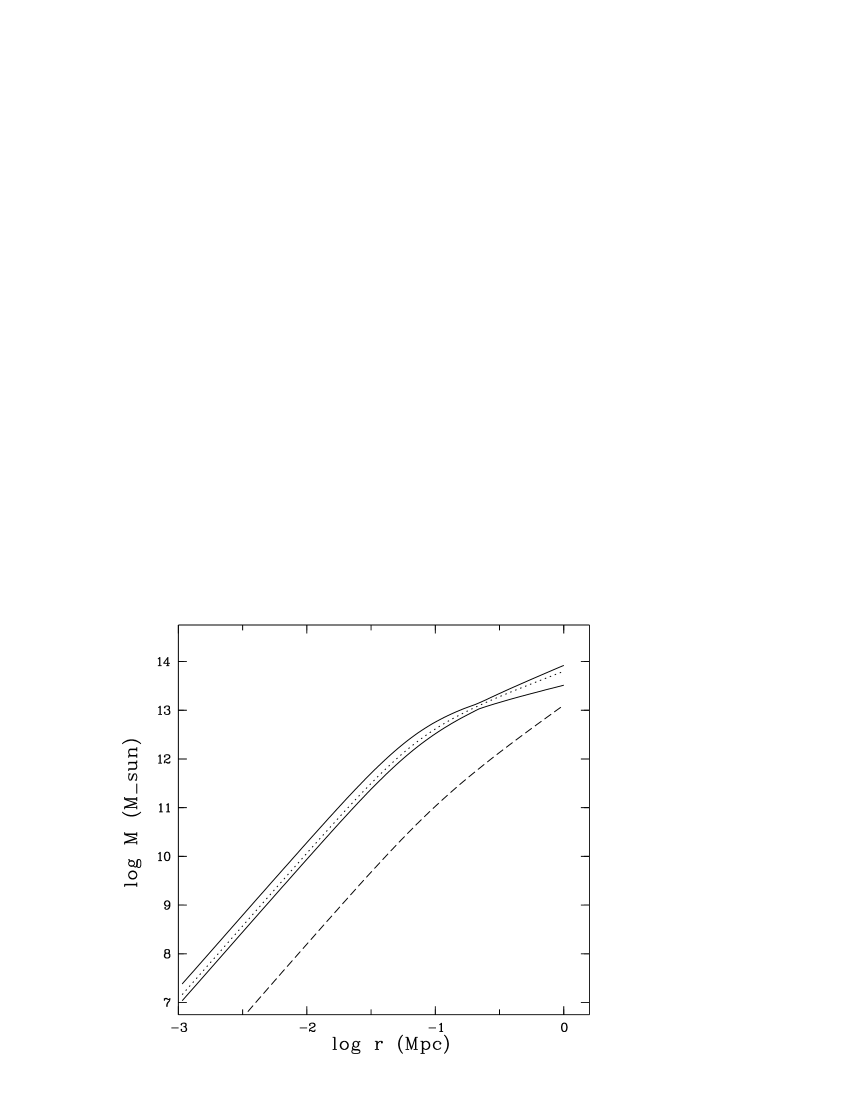
to the azimuthally averaged surface brightness profile yields a slope parameter and a core radius kpc. The gas mass enclosed inside 1 Mpc amounts to = 1.3 1013 M⊙. Assuming spherical symmetry and the group to be approximately in hydrostatic equilibrium, the total gravitating mass is given by
| (2) |
We derive an integrated total mass of = 6.3 1013 M⊙ within 1 Mpc and a gas mass fraction of 21%. The profile of total and gas mass is displayed in Fig. 2.
The cooling time of the gas in the group center is yr, i.e. no ‘large-scale’ cooling flow is expected to have developed. Further, the enhanced X-ray emission from the direction of NGC 383 is consistent with originating from a point source.
| spectral fit: |
| =1.5 keV, = 1.5 1043 erg/s |
| beta-model results: |
| cts/s/arcmin2, , kpc |
| central density, mass: |
| = 1.3 10-3 cm-3; = 0.6 1014 M⊙, |
| gas mass fraction 21% (at = 1 Mpc) |
3 X-ray properties of the central radio galaxy, NGC 383 = 3C 31
The optically and X-ray brightest galaxy of the group is NGC 383. Its spectrum is best described by a two-component model consisting of thermal emission from a Raymond & Smith plasma with 0.6 keV and a hard tail that may correspond to an AGN-like powerlaw. The presence of the hard component can be avoided if the gas abundances are depleted below 0.1 solar. However, such low abundances are unexpected for dominant group galaxies (for a more detailed discussion of the question of metal abundances see, e.g., Buote & Fabian 1998). The amount of cold absorption is consistent with the Galactic value in direction of NGC 383.
The luminosity in the hard component, erg/s, significantly exceeds the contribution expected from discrete stellar sources, and likely originates from the active nucleus.
A temporal analysis of the X-ray emission from NGC 383 reveals constant source flux throughout the observation.
The spatial position of NGC 383 is found to be slightly off-set from the center of the extended X-ray emission, and thus presumably from the center of the dark matter potential. Such off-sets of cD galaxies have also been observed in a number of other systems. Lazzati & Chincarini (1998) trace this back to a small-amplitude oscillation of the cD galaxy around the bottom of the cluster potential.
| 10-2 cts/s | keV | erg/s | erg/s |
| 2.40 | 0.6+pl | 4.7 1041 | 5.1 1043 |
4 Radio – X-ray relations
4.1 Spatial correlation ?
NGC 383 shows bright radio jets. Given the spectacular examples of pressure interaction between the radio and X-ray gas in some clusters of galaxies (e.g., Harris et al. 1994, Böhringer et al. 1993, 1995), we searched for such signatures in the NGC 383 data.
In the present case, we do not find conspicuous morphological correlations between radio- and X-ray emission (Fig. 1). This may be partly due to the narrowness of the jet, the still limited spatial resolution of the ROSAT PSPC, and the 2D view of the 3D source structure. We note, though, that the largest extent of the southern jet transverse to its flow direction coincides with a local minimum in the X-ray emission (Fig. 1).
Changes of the jet orientation angle near the locations of some optical chain galaxies, now also detected as strong X-ray sources, were already noted by Strom et al. (1983).
4.2 Pressure estimates
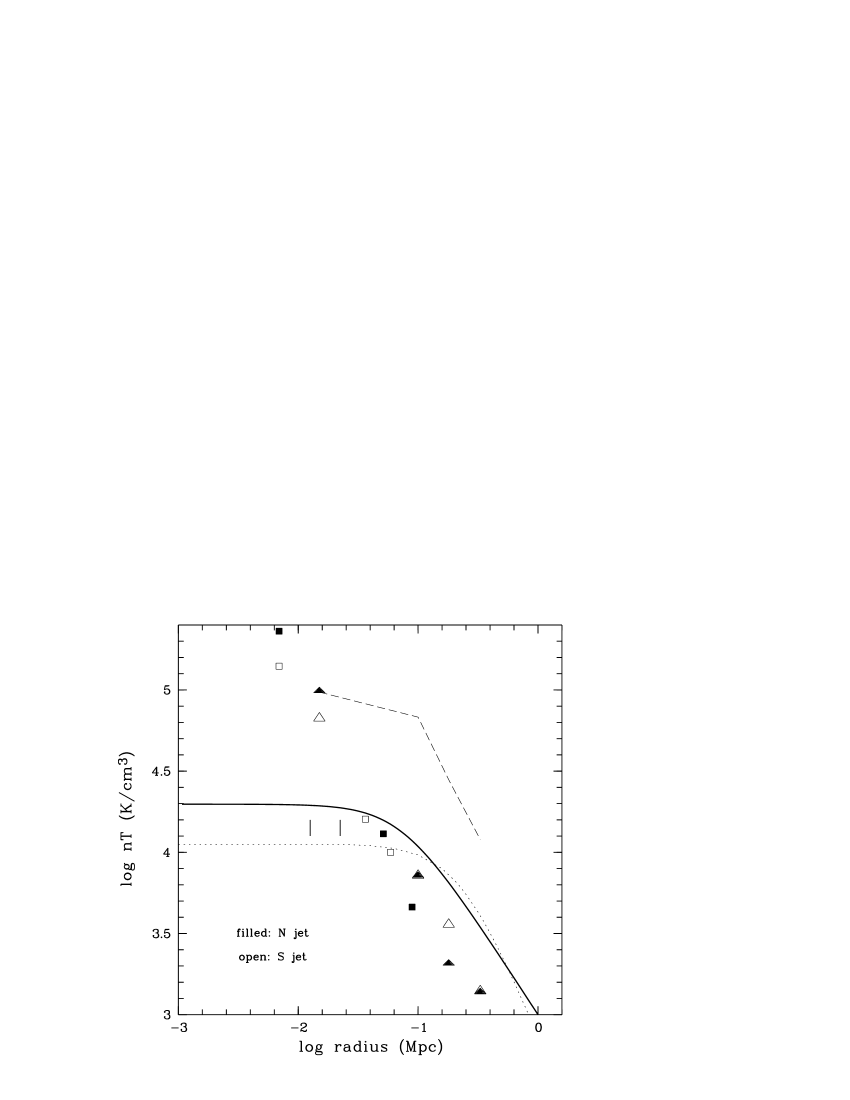
The gas density and temperature derived for the X-ray gas allow a comparison with the pressure of the radio gas, and an assessment of the confinement of the jet material. In Fig. 3 we compare the pressure of the radio emitting region as given in Strom et al. (1983) and Morganti et al. (1988)111To derive the equipartition pressure, they used the equations of Pacholczyk (1970) and made the standard assumptions of equal energy density in protons and electrons, filling factor of 1, and a powerlaw representation of the radio spectrum with cut-offs at 10 MHz and 100 GHz. with the thermal pressure of the X-ray gas derived from the density profile (Sect. 2) and a temperature of =1.5 keV. Pressure equilibrium is reached at about 35 kpc (projected distance from the center). Further out the thermal pressure increasingly exceeds the nonthermal pressure.
It is interesting to note that Bridle et al. (1980) find the expansion rate of the jets of 3C 31 transverse to their length to decrease with increasing distance from the radio core. This may be related to the relative increase of the thermal pressure of the ambient medium with increasing radius. While Bridle’s trend refers mainly to the presently in X-rays barely resolved core region it may be interesting to explore this relation further once higher-resolution X-ray data become available.
A similar comparison of thermal vs. non-thermal pressure was performed in T97. They derived a somewhat different surface brightness profile and thus change in thermal pressure with the consequence that the radius where both pressure values are of the same order shifts further out which led them to suggest that NGC 383 might have a giant halo that escaped detection in a (short) HRI exposure.
5 Summarizing conclusions
We presented results from an analysis of the X-ray properties of the NGC 383 galaxy group based on ROSAT PSPC and HRI data. X-ray emission can be traced out to Mpc, the estimated virial radius of the system. We determine a total mass of M⊙ for the group inside this radius with a gas mass fraction of 21%. The intragroup gas temperature of keV is both consistent with the galaxy velocity dispersion and the X-ray luminosity - temperature relation of groups and clusters suggesting that the group is fairly relaxed.
The X-ray properties of the radio galaxy NGC 383 (3C 31) which is located near the center of the group were discussed, extending the work of T97. Its spectrum is best described by a two-component model, consisting of emission from a low-temperature Raymond-Smith plasma, and a hard tail. The emission from NGC 383 is not resolved by the ROSAT HRI.
The possible interaction of the radio jets of 3C 31 with the IGM was studied. We do not find any conspicuous spatial correlation of X-ray emission and radio jet which might be partly due to the narrowness of the jet, the 2D view of the 3D source structure, and the limited spatial resolution of the ROSAT PSPC. With its bright extended X-ray emission, its central well-studied radio source, and several individually detected X-ray bright member galaxies, the NGC 383 group certainly is an interesting target for future X-ray missions like XMM and AXAF.
Acknowledgements.
We acknowledge support from the Verbundforschung under grant No. 50 OR 93065. The ROSAT project is supported by the German Bundesministerium für Bildung, Wissenschaft, Forschung und Technologie (BMBF/DLR) and the Max-Planck-Society.Preprints of this and related papers can be retrieved from our webpage at http://www.xray.mpe.mpg.de/skomossa/
References
- [1] Arp H., 1966, Atlas of peculiar galaxies, Pasadena: Cal. Inst. of Techn.
- [2] Artyukh V.S., Ogannisyan M.A., Tyul’bashev C.A., 1994, Astr. Let. 20, 211
- [3] Blandford R.D., Icke V., 1978, MNRAS 185, 527
- [4] Böhringer H., et al., 1993, MNRAS 264, L25
- [5] Böhringer H., et al., 1995, MNRAS 274, L67
- [6] Bridle A.H., et al., 1980, ApJ 241, L145
- [7] Buote D.A., Fabian A.C., 1998, MNRAS 296, 977
- [8] Condon J.J., Frayer D.T., Broderick J.J., 1991, AJ 101, 362
- [9] Ekers R.D., et al., 1981, A&A 101,194
- [10] Fraix-Burnet D., Golombek D., Macchetto F.D., 1991, AJ 102, 562
- [11] Harris D.E., Carilli C.L., Perley R.A., 1994, Nat 367, 713
- [12] Hwang U., et al., 1999, to appear in ApJ
- [13] Klein U., Wielebinski R., 1979, A&A 72, 229
- [14] Komossa S., Böhringer H., 1999, A&A 344, 755
- [15] Lara L., et al., 1997, ApJ 474, 179
- [16] Lazzati D., Chincarini G., 1998, A&A 339, 52
- [17] Morganti R., et al., 1988, A&A 189, 11
- [18] Pacholczyk A.G., 1970, Radio Astrophysics, (Freeman & Co., San Francisco)
- [19] Sakai S., Giovanelli R., Wegner G., 1994, AJ 108, 33
- [20] Strom R.G., et al., 1983, A&A 122, 305
- [21] Trussoni E., et al., 1997, A&A 327, 27 (T97)
- [22] Zwicky F., et al., 1961-1968, Catalogue of Galaxies and Clusters of Galaxies