Nova Sagittarii 1994 #1 (V4332 Sagittarii): The Discovery and Evolution of an Unusual Luminous Red Variable Star
Abstract
We report photometry and spectroscopy of the evolution of Nova Sagittarii 1994 #1 (V4332 Sagittarii) during outburst. We compare the photometric and spectral evolution of this outburst to known classes of outbursts – including classical novae and outbursts occurring on symbiotic stars – and find this object does not conform to any known class of outburst. The closest match to the behavior of this unusual object is M31 RV, an extremely luminous and red variable object discovered in the bulge of M31 in 1988. However, the temporal behavior and maximum luminosity of the two events differ by several orders of magnitude, requiring substantial intrinsic variation if these two events are members the same type of outburst.
Our model of the spectroscopic evolution of this outburst shows that the effective temperature cooled from 4400 K to 2300 K over the three month span of our observations. In combination with line diagnostics in our later spectra, including [OI] and the dramatic increase in the H to H ratio, we infer the existence of a cool, dense ( cm-3) envelope that is optically thick in the Hydrogen Balmer recombination lines (case C). We suggest that a nuclear event in a single star, in which a slow shock drove the photosphere outwards, can power the observed luminosity evolution and the emission spectrum.
To appear in The Astronomical Journal, August 1999
1 Introduction
On 1994 February 24, M. Yamamoto discovered an apparent nova in Sagittarius, Nova Sagittarii 1994 #1 (hereafter V4332 Sgr; Hayashi & Yamamoto 1994). A confirmation spectrum obtained by R. Bertram with the Perkins telescope on 1994 March 4 indicated that this object was not a classical nova early in its outburst (Wagner 1994) since it lacked the spectral features characteristic of classical novae in outburst. Subsequent spectra also showed this object to undergo approximately a one magnitude decline in flux and a change in spectral type from approximately MO to M5 in only 5 days (Tomaney et al. 1994). Based upon its evolution towards later spectral type and the lack of any emission other than narrow Balmer lines, Tomaney et al. (1994) proposed that V4332 Sgr was of the same type as an extremely luminous red variable observed in the bulge of M31 (hereafter M31 RV) in 1988 (Rich et al. 1989; Mould et al. 1990; Sharov 1990; Tomaney & Shafter 1992; Sharov 1993). M31 RV similarly exhibited only narrow Balmer emission, although this object evolved on a much longer timescale and attained a much brighter absolute magnitude than V4332 Sgr.
In this paper, we compile all available observations of V4332 Sgr during outburst and show that its spectroscopic and photometric evolution are inconsistent with any known class of outburst. In §2, we describe the discovery and identification of V4332 Sgr. In §§3 and 4 we trace its photometric and spectroscopic evolution, while in §5 we discuss our model fits to our spectra and derive effective temperatures for the expanding shell as a function of time. In §6 we describe high-resolution spectroscopy of H at two epochs, while in §§7 and 8 we compare V4332 Sgr with other known classes of outbursts and M31 RV. We briefly discuss the possible nature of the object and this outburst in §9 and we summarize our results in §10.
2 Discovery, Identification & Astrometry
V4332 Sgr was discovered by Minoru Yamamoto on an exposure with P-MAX 400 film on 1994 February 24.85 UT at a magnitude of 8.9 (Hayashi 1994). The presence of the new object was confirmed visually by Hirosawa (1994) on February 25.85 at a magnitude of about 8.4. Further observations by Yamamoto (1994) on February 25.84 gave a magnitude estimate of 8.5, consistent with the results of Hirosawa. V4332 Sgr should not be confused with a second nova in Sagittarius (Nova Sagittarii 1994 #2) discovered by Sakurai (Sato 1994) on 1994 May 20.7.
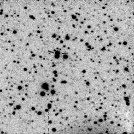
In Figure 1, we show the location of V4332 Sgr based on a 10 s R-band CCD image obtained on 1994 March 22 using the Imaging Fabry-Perot Spectrometer (Pogge et al. 1995) in direct imaging mode and a TI pixel CCD mounted on the Perkins telescope of the Ohio Wesleyan and Ohio State Universities at the Lowell Observatory. Figure 1 covers a region at a scale of 05 per pixel. The seeing was approximately FWHM.
Kilmartin (1994) obtained astrometry of V4332 Sgr by utilizing the Parallax and Proper Motion Catalog (PPM) based on two exposures obtained by A. C. Gilmore with the 0.15 m f/15 astrograph at Mt. John Observatory on March 2.62 UT. Kilmartin determined a mean FK5/J2000 position of . Skiff (1994) examined the Palomar Observatory Sky Survey (POSS) O and E prints and found a possible progenitor of the nova at this position with R = 16 mag and B = 18 mag at a mean position of (J2000). With our estimated extinction of (see below), this is roughly consistent with a K star. This is also consistent with the initial spectral type of the outburst.
From the R-band CCD images we obtained on 1994 March 22, we derived an astrometric solution for 27 stars which were in common with our CCD image and the Digitized Sky Survey based upon a grid of 18 PPM stars in a field centered on V4332 Sgr. Using our plate solution, we obtained a position of (J2000) with a formal uncertainty of 026 in both coordinates. Our position is consistent at the 1 level with the position derived by Kilmartin (1994) and with the position of the possible progenitor on the POSS print discovered by Skiff (1994).
3 Light Curve
In Figure 2a, we plot the light curve of V4332 Sgr as compiled by VSNET, the AAVSO, and photometry reported in the IAU Circulars (Nos. 5943, 5944, and 5949). We show digital measurements obtained by photoelectric photometry or with CCDs as filled circles, while we denote visual magnitude estimates by open circles. Visual estimates were obtained and kindly communicated to us by Mr. Albert Jones of the Variable Star Section of the Royal Astronomical Society of New Zealand using a 0.32 m telescope. These points are shown as open triangles. The photographic observations, primarily by Sakurai (1994), largely precede the discovery observation and are shown as filled triangles. For convenience, we have included the results of published photoelectric photometry in Table 1.
The light curve is characterized by a slow rise in brightness to a relatively flat maximum. Maximum brightness appears to have been reached on JD 2,449,412 (1994 February 28) at a visual magnitude of . This broad maximum was then followed by a relatively fast decay in which the time to decline by 2 and 3 magnitudes in was and days, respectively. In addition, the visual magnitude measurements suggest that the rate of decline slowed after JD 2,449,424 (1994 March 12). We performed a crude linear back-extrapolation of the pre-maximum light curve data (filled triangles in Figure 2a) and estimate that the object took 200 days to reach maximum brightness, assuming a quiescent magnitude of mag based on Skiff’s (1994) proposed progenitor. Archival plates examined by Wenzel (1994) indicate that V4332 Sgr was not visible on 561 Sonneberg sky patrol plates taken between 1926 and 1983 to a limiting photographic magnitude of 11-13.5. We note that this object was just becoming visible in the morning sky when it was discovered and therefore more complex photometric behavior prior to its discovery can not be excluded.
In Figure 2b, we show the color evolution taken from the photometry reported by Gilmore (IAUC Nos. 5943, 5944, and 5949) starting from maximum light and extending for 11 additional days (see also Table 1). During this time, the slope of the continuum of V4332 Sgr as measured by the color became redder by 1.5 mag while the object faded by 2.5 mag in . This suggests that much of the steep decline in the visual magnitude was the result of a rapidly reddening continuum. This behavior is confirmed by the spectral evolution of V4332 Sgr discussed below.
4 Spectral Evolution
We followed the early spectral evolution of V4332 Sgr from 1994 March 4 to June 6 at a variety of telescopes (Table 2). In Figure 3, we present spectra of V4332 Sgr obtained at the Perkins telescope on 1994 March 4.5 (Figure 3a) and 9.5 UT (Figure 3b) with the Boller and Chivens CCD spectrograph. We employed a 350 grooves mm-1 grating centered at 5100 Å and a 2″ wide slit to cover the spectral region from Å at a resolution of 5 Å. Upon comparing this spectrum with the Turnshek et al. (1985) atlas of cool stars and the spectra presented by Jacoby, Hunter, & Christian (1984) we concluded that the the March 4 spectrum (Figure 3a) most closely resembles a K3-4 III-I star. In addition to the stellar absorption features, a narrow and unresolved H emission line with an equivalent width of 3 Å is present. The March 9 spectrum (Figure 3b), only 5 days later, shows the rapid spectral evolution of V4332 Sgr. During this interval, the spectral type changed from that of a K3-4 III-I star to that of a M3 III-I star, although atmospheric model fitting (see §5 below) yields an effective temperature consistent with a K5 III. This discrepancy is probably due to the limited wavelength range of this spectrum (see Table 2). Over this same 5-day period the band brightness decreased by approximately one magnitude. Unresolved H emission is present in this spectrum with an equivalent width of 11.4 Å. The TiO absorption features which were weak or absent on March 4 are now conspicuous in the spectrum. Without more detailed spectra at higher spectral resolution in the blue or the near infrared it is difficult to distinguish between luminosity classes of III and I at this spectral type. In any event, using luminosity classifications meant for static atmospheres on an outburst are likely to be very uncertain.
Beginning on March 11, we were able to secure spectra which covered a much larger portion of the visible-wavelength region than our previous observations. In Figure 4a, we show the spectrum of V4332 Sgr obtained on 1994 March 11.4 with the 3.6 m telescope at La Silla using EFOSC. The spectrum covers the region Å at a resolution of 7 Å and was obtained under non–photometric conditions. Comparison with M–star templates from the sources cited above suggests that the spectrum is that of a M5-6 III or M5-6 Ib-II star. At our resolution, it is difficult to distinguish between these luminosity classes. Emission lines arising from the Balmer series are now striking over our extended spectral range. The observed ratios of the H, H, and H emission lines to H are 2.6, 0.8, and 0.8, respectively, with a formal measurement uncertainty of 10%, though we note that there is significant additional uncertainty in estimating the true level of the underlying stellar continuum as well as absorption from the photosphere. In particular, our high-resolution spectra (see below) show absorption in the H profile, so clearly these line ratios are very approximate. These caveats apply to all of our reported line ratios.
On March 20.4, we obtained another spectrum with the 3.6 m telescope and EFOSC under photometric conditions at a resolution of 13 Å and covering the range Å (Figure 4b). This spectrum is more typical of a M6.5-7 III or II star since the VO Bands at 7400 Å and 7900 Å are now discernible. The observed ratios of the H, H, and H emission lines to H are 7.5, 0.6, and 0.7, respectively, with a formal measurement uncertainty of 10%. Weak emission due to Mg I at 4571 Å is also visible in both spectra, although no forbidden lines are apparent.
In Figure 5 we present a composite spectrum of V4332 Sgr obtained on 1994 June 5 & 6 using the 4.5-m Multiple Mirror Telescope (MMT) and the Blue Channel CCD spectrograph. The June 5 spectrum covers the region Å and the June 6 spectrum covers the region Å, both at a resolution of 3.5 Å. The spectrum continued to evolve strongly towards later spectral types and decrease overall in absolute flux from early March, although we cannot infer a magnitude from the spectrum due to slit losses. From the strength of the VO bands, we classify this spectrum as an M8-9 III. In addition to the narrow Balmer emission lines present in earlier spectra, emission lines arising from Mg I, Na I, [O I], Fe I, and Fe II are also present. The observed ratios of the H, H, and H emission lines to H are 18.6, 0.26, and 0.12 respectively, again with a formal measurement uncertainty of 10%. The equivalent widths of the Balmer series and other prominent lines are listed in Table 3.
Figure 6 shows the color excess evolution of V4332 Sgr for 3 dates on which we obtained spectra and also have relatively coincident color information. The points plotted in this figure represent the observed color excess of V4332 Sgr which we derived from the difference between the published photoelectric photometry in Table 1 and the nominal color of giant stars (Johnson 1966) of our observed spectral type. The errorbars represent an assumed uncertainty of 1 spectral type. This figure shows that the average is relatively constant and consistent with the value we infer for March 4, . If this component is due to interstellar reddening, then mag (assuming ). Both and appear to be somewhat bluer than the assumed colors for static atmospheres; this may be due to a poor match between the inferred temperatures and static atmosphere colors or scattering in the expanding envelope. The effect seen in Figure 6 is in the opposite sense of what one would expect if dust were forming in the envelope.
5 Modeling of the Spectra
We have modeled the spectra using the PHOENIX model atmosphere code (Hauschildt & Baron 1998; Hauschildt, Allard, & Baron 1998). The presence of molecular bands in the observed spectra indicates low effective temperatures. Therefore, we have calculated models using essentially the same input physics as described in Hauschildt, Allard, & Baron (1998). However, we have used spherical (rather than plane parallel) geometry for the model construction due to the geometrical extension of the changing atmosphere. In addition, the models presented here were calculated using the AMES water line list (300 million lines: Partridge & Schwenke 1997) which replace the older water data used in Hauschildt, Allard, & Baron (1998). For this preliminary modeling we have neglected the small expansion velocity (see below) of the shell and used static atmosphere models in order to save computational time. The formation of the molecules and their lines were treated in LTE (molecular NLTE models are in preparation but have not yet been finalized) and all models were calculated assuming solar abundances. Before the modeling, the observed spectra were corrected for interstellar reddening assuming as derived above.
The largest difference between the spectra of V4332 Sgr and that of a “normal” classical nova atmosphere early in its outburst (the “iron curtain phase”) is the significantly lower effective temperature. The emission lines that are apparent in the observed spectra are true emission features, evident by a comparison of the model spectra with the observed data. The models do not include a circumstellar shell where these lines probably form and thus cannot be expected to reproduce them. Our spectra do however resemble active M-type spectra (the gravities in the dMe’s are larger however) more than classical nova spectra. In a statistical sense, the model spectra do not reproduce the observed spectra very well. In part this is due to the model simplifications (abundances, LTE). Another major problem is the incomplete line list data for TiO we had to use in these models (Hauschildt et al, in preparation), as well as unknown line data for molecules like VO and FeH. However, we can say that the effective temperature of the spectra dropped throughout the observed time period by nearly a factor of 2 while the spectra continued to stay optically thick. This is in sharp contrast to normal novae, where the effective temperature of the shell increases and it becomes optically thin.
Our models fits to the March 4 and March 9 spectra show a decline in temperature from K to 3800 K. While the March 4 fit is in good agreement with our spectral classification of K3 (see Figure 7), our March 9 fit yields a hotter temperature than our spectral classification. This inconsistency is probably due to the narrow observed spectra range on this data. The model fits to March 11 ( K), March 20 ( K), and June 5/6 ( K) are all consistent with the spectral classification discussed above. Our derived effective temperatures for each of the spectra are listed in Table 2. In Figure 7 we show the observed spectra (bold tracing) along with the model fits (thin tracing).
The static atmosphere models we have used to obtain temperature estimates also provide us with a way to compare the change in apparent magnitude to the change in the bolometric luminosity. As shown on Table 1, V4332 Sgr decreases by approximately 10 magnitudes in over the 3 month period from the beginning of March to the beginning of June, over the same period when our model fits show a decrease in effective temperature from 4400 K to 2300 K. When we use the bolometric corrections of these models to calculate the change in the bolometric luminosity over this time, we find that the bolometric luminosity decreases by a factor of over this 3 month period.
6 Line Profiles
In order to learn more about the dynamics of the cool, evolving envelope indicated by our low dispersion spectroscopy, we obtained a higher dispersion spectrum on 1994 March 7 in the H region using the 3.5 m New Technology Telescope (NTT) at La Silla with EMMI. Using a 11 wide entrance slit and a 1200 grooves mm-1 grism, we obtained a spectrum covering the range Å at a resolution of 1.4 Å. The region from Å is shown in Figure 7a in which the continuum normalized H profile is represented by crosses. The line profile consists of a narrow emission line blended with a redshifted but narrower absorption line which together form an inverse P Cygni profile.
To extract quantitative information from this profile we deconvolved the two components by Gaussian fitting with a non–linear least squares technique. Our best–fit is shown as a solid line superposed on the observations in Figure 7a. We find that the absorption component is redshifted with respect to the emission component by 17 km s-1. The FWHM of H emission is 200 km s-1 while that of H absorption is 70 km s-1, both corrected for instrumental resolution. These results suggest that the H line emitting region is expanding with a velocity of about 100 km s-1. If the emission and absorption components are moving with respect to the same center of mass, an infall velocity of about 20 km s-1 is required of a component of the envelope projected against the continuum source. Another striking aspect of Figure 7a is that the systemic velocity of the mean H profile is blueshifted with respect to line center by 180 km s-1. This blueshift is also evident in our other spectra (see, e.g. Table 3) and may be due to an occulting source in or near to the emission line region, the effects of an opacity source in the envelope such as dust obscuring the far side of the emitting envelope, the actual heliocentric radial velocity of V4332 Sgr, or a combination of all of these effects.
On 1994 April 26 we obtained a second high resolution spectrum of V4332 Sgr using the Palomar Observatory 1.5-m telescope and echelle spectrograph at a resolution of 1 Å. The spectrum covers the region from Å in 58 orders. We were unable to perform a sky subtraction or flux calibration for this spectrum as we lacked the appropriate calibration data. The emission lines we identified in the spectrum include the Balmer series of hydrogen and emission lines arising from Ca I 4226 Å, Ca II H & K lines, the Ca II infrared triplet, O I 8446 Å, weak [O I] 6300 Å and 6363 Å, Na I D, and Mn I multiplets 1 and 2 at 5394 Å, 5432 Å, and 4030 Å and numerous emission lines from Fe I and Fe II. The lack of sky subtraction makes positive identifications of other emission lines ambiguous. All of the identified emission lines exhibit the blueward shift described above. The [O I] detections are clearly not the telluric features as they are shifted blueward of the telluric lines. In Figure 7b, we show the H line profile obtained on April 26. The same basic structure is present in the line profile at this epoch as observed on March 7 except that the relative emission and absorption line strengths have changed and the line widths are narrower.
7 Comparison with Known Outbursts and Variable Stars
This object was referred to as a nova before the identification spectrum obtained by Wagner (1994) showed that its spectrum was completely inconsistent with this classification. The collection of observations we present here show that this object also had a drastically different ejection velocity and temporal evolution from classical novae (Gallagher & Starrfield 1978). Since novae do not fit the characteristics of this event, we investigated the possiblility that this object could be another type of previously cataloged outburst. Symbiotic stars, for example, constitute a fairly diverse class of objects which exhibit a range of outburst phenomena (Kenyon 1986). The different classes of outburst exhibited by symbiotic stars, however, all include high ionization emission lines and have much lower amplitudes than the observed magnitude variation in V4332 Sgr. Finally, the relatively rapid luminosity evolution of this object, lack of evidence for periodicity, and the different spectral features make it unlikely that this object is an asymptotic giant branch star undergoing a final helium shell flash, such as FK Sgr.
8 Comparison with M31 RV
From the above comparison with known types of outbursts and variable stars, we find that V4332 Sgr does not conform to the criteria for membership in any of these classes. What is particularly striking is its unique spectral development from K3 III-I to M6 III-I in just one week and subsequently to M8-9 III in less than 3 months. Only the extremely luminous outburst in M31 in 1988, M31 RV (Rich et al. 1989; Mould et al. 1990), exhibited similar spectral evolution. Both M31 RV and V4332 Sgr were characterized by a rapidly evolving late-type stellar absorption line spectrum and narrow Balmer emission lines with a rapidly increasing H to H ratio with time. Both outbursts were not characteristic of classical novae, symbiotic stars, other known types of outbursts, or known variable stars and neither have exhibited evidence of periodicity. In addition, the spectra of both objects exhibited no other emission lines than narrow Balmer emission lines until at least days after maximum.
M31 RV was discovered as a 15th mag red variable star 3′ from the center of M31 on 1988 September 3 by Rich et al. (1989) during the course of a survey of luminous M giants in the bulge of M31. It was independently discovered by Tomaney & Shafter (1992) on 1988 August 18 during their study of novae in the bulge of M31 and by Bryan & Royer (1992) on 1988 July 13 during their photographic survey for M31 novae at the Ford Observatory. The time of the outburst was constrained by Bryan & Royer (1992) to have taken place sometime between 1988 June 14 and July 13 based on independent photographs of M31 obtained by A. N. Sollee (1990).
Spectroscopy of M31 RV obtained by Rich et al. (1989) on 1988 September 5 exhibited unresolved H and H emission, Na absorption, weak TiO bands, and a strong Ca II IR triplet. Based on the strength of the Ca II triplet, the lack of CaH absorption, and the strength of the blend (Ba II, Ca I, and Fe I absorption blend), Rich et al. classified it as M0 Ie. Additional spectra (Mould et al. 1990) were obtained in early October and November 1988 and indicated that the spectrum of M31 RV had changed to later M types. By 1988 Nov 1, the spectrum was classified as M6 Ie. No emission lines other than the Balmer series were reported. Rich et al. reported dramatic variations in its radial velocity in their September 5 spectra in both the emission and absorption lines. Subsequent spectra obtained by Mould et al. (1990) gave a blueshift relative to the systemic velocity of M31 of km s-1.
The light curves of M31 RV and V4332 Sgr are very different in their relative rates of decline after maximum brightness. As measured by the time to decline 2 mag in brightness from maximum, the rate of decline for V4332 Sgr was days whereas for M31 RV 78 days. We note, however, that the time of maximum of both of these objects is somewhat uncertain. The maximum of M31 RV has been constrained by observation to only within a few weeks (Bryan & Royer 1991; Sharov 1993). The time of maximum brightness of V4332 Sgr could be even more uncertain as it could have reached maximum prior to its discovery. In either scenario, this would impact upon the value of used to characterize the temporal evolution of these objects.
Another difference between M31 RV and V4332 Sgr is the maximum absolute magnitude achieved during their outbursts. M31 RV reached an apparent magnitude of in 1988 July. Assuming mag for M31, the bolometric absolute magnitude was (Rich et al. 1989). While we do not know the distance to V4332 Sgr, there are many lines of evidence, such as the relatively weak interstellar absorption lines and low extinction estimate, which suggest that the progenitor was relatively nearby and similar to a late-type dwarf or giant star, rather than a late-type supergiant. If we assume V4332 Sgr was characteristic of a K giant at maximum, as suggested by Figure 3, the implied distance is pc, before including the effects of extinction. Performing the same exercise for subsequent points in the evolution leads to increasingly larger distance estimates as the object evolves towards later spectral types. The luminosity of this object is therefore not consistent with the observed spectral type and luminosity class, though as the luminosity increases with time over that expected for a star of the same spectral type, the distance estimate of pc derived from the first spectrum may be an upper limit. We note as above that this line of analysis is very uncertain as we do not expect the luminosity class of the object during outburst to provide a reasonable luminosity estimate in any event as these luminosity classifications are based on static stellar atmosphere.
There is a spectroscopic similarity between V4332 Sgr and M31 RV in the strong increase in the H intensity ratio, possibly indicative of greatly increasing reddening at the source such as that produced by dust formation. V4332 Sgr had a H intensity ratio of 2.5 on March 11 ( 15 days, where is the date of discovery: 1994 Feb 24). By June 5 ( 40 days) this ratio had increased to . Mould et al. (1990) reported M31 RV to have an H emission line ratio of 1.8 at days. While by 111 to 119 days this ratio had increased to 9.8 (Tomaney & Shafter 1992). Both Mould et al. (1990) and Tomaney & Shafter (1992) interpret the continuum evolution and increase in the H emission line ratio as due to dust formation. However, as we discuss below, we attribute this change to increasing optical depth in the Hydrogen Balmer recombination lines.
9 Discussion
Both M31 RV and V4332 Sgr do not conform to any known class of outburst. While M31 RV exhibited temporal and luminosity evolution orders of magnitude greater than V4332 Sgr, they may be related based upon their similar spectral evolution. M31 RV and V4332 Sgr evolved rapidly towards the red and exhibited an increasing H to H line emission ratio with time and thus it is possible that both outbursts produced a great deal of dust. However, the behavior of Figure 6 is inconsistent with this interpretation for V4332 Sgr. Except for a minor trend in the color excesses of and with time which might be due to a systematic error with increasing spectral type in the intrinsic colors of M giant stars, there is no indication that dust formation is taking place and resulting in large color excesses that would lead to large intensity ratios. The observed colors are in good agreement with the temperatures derived from our atmosphere model without the addition of dust beyond our estimate of an interstellar extinction of . Instead, large HH intensity ratios can be produced if the Balmer lines become optically thick (case C recombination). This situation would then be similar to that observed in the evolution of the visible-wavelength spectra of type II supernovae. In their model for hydrogen recombination in SN 1987A, Xu et al. (1992) found large values for the H to H ratio in their cm-3, K model for the late-time spectra.
We have independent evidence for such high densities and low temperatures in our spectra which further support these values for the physical parameters. As discussed in section 5, our models show that the temperature changes from K to K over the three month period we have spectra. In addition, we detect [O I] Å in our June 1994 spectrum. The ratio of this line to the Å doublet is approximately 0.08, implying cm-3 (Begelman & Sarazin 1986; Keenan et al. 1995). The ratio of the [O I] Å doublet is , however, indicating the [O I] emission is optically thin. In addition, the absence of forbidden line emission from either outburst within of maximum suggests a high density environment. The critical densities of bright, forbidden emission lines typically seen in outbursts are generally cm-3 and the absence of any of these lines provides a lower limit to the density of the line-emitting region.
Iben & Tutkov (1992) suggested that M31 RV could be a nova-like outburst involving an uncharacteristically large amount of mass loss (). In their scenario, M31 RV could be the first outburst to occur in a short period (80 minutes to 2 hours) cataclysmic variable system, where the high mass loss and large luminosity would then be due to an exceptionally large mass build-up on a cold white dwarf. This large amount of mass loss could also explain the lack of a nebular phase as the large amount of ejected mass may be absorbing all of the ionizing photons from the central source. Our spectral and dynamical analysis of V4332 Sgr is not inconsistent with the Iben & Tutkov (1992) model for M31 RV except for the lack of evidence for dust formation. However, further theoretical modeling is needed to see if such an outburst on a cold white dwarf could also produce the much lower maximum luminosity that V4332 Sgr exhibits. Such a great intrinsic variation in ‘first outburst’ events could be explained, for instance, by highly variable mass-loss and the proportion of energy that is emitted in the form of kinetic energy vs. radiation.
An alternative explanation for this event and M31 RV could be a nuclear event in a single, evolved star which caused a slow shock to propagate through to the photosphere. This would push out the photosphere of the star, increasing the luminosity and correspondingly decreasing the effective temperature. This scenario explains the high densities, low velocities, and timescale we observe. This is also provides a means of powering the event in the absence of any evidence for a source or that this object is in a binary system. Such evidence would consist of radial velocity variations, composite spectra, or evidence for a companion as the object faded, none of which have been observed. Our observations are also consistent with the ejection of a massive and opaque shell of material.
10 Summary
We have presented photometry and spectroscopy that trace the evolution of V4332 Sgr, an unusual luminous red variable star in Sagittarius. Our data clearly rule out the possibility that this object was a nova or any other known type of variable object. In fact the closest match to the spectral evolution of this object is M31 RV, an extremely luminous and red variable that was observed in the bulge of M31 in 1988. However, significant differences exist between these two events. Particularly, the temporal evolution was much longer and the maximum luminosity much brighter for M31 RV. Therefore if these two events are similar, there must be substantial intrinsic variation in the outbursts.
Our model of the spectra observed over a 3 month baseline show that the effective temperature fell from K to 2300 K. Our line diagnostic measurements in the later spectra, particularly the evolution of the H to H ratio and the absence of strong forbidden lines, imply high ( cm-3) densities in addition to the low temperatures. Our observations of this object suggest a simple model in which a nuclear event in a single, evolved star caused a slow shock to drive the photosphere outwards and resulted in the evolution to lower temperatures and the emission spectrum we see after three months. Further study of this object in quiescence as well as theoretical modeling based upon the observational data we present here will hopefully lead to a clearer understanding of the nature of this unusual outburst.
References
- (1) Begelman, M.C. & Sarazin, C.L. 1986, ApJ, 302, L59
- (2) Bryan, J. & Royer, R.E. 1992, PASP, 104, 179
- (3) Duerbeck, H.W. & Wolf, B. 1977, A&AS, 29, 297
- (4) Gallagher, J.S. & Starrfield, S. 1978, ARA&A, 16, 171
- (5) Gilmore, A.C., Kilmartin, P.M., Sakurai, I. & Jones, A.F.A. 1994, IAU Circ., 5943
- (6) Hauschildt, P.H. & Baron, E. 1998, Journal of Computational and Applied Mathematics, in press
- (7) Hauschildt, P.H., Allard, F., & Baron, E. 1999, ApJ, 512, 377
- (8) Hayashi, S.S. & Yamamoto, Y. 1994, IAU Circ., 5942
- (9) Iben, I. & Tutkov, A.V. 1992, ApJ, 389, 369
- (10) Johnson, H.L. 1966, ARA&A, 4, 193
- (11) Keenan, F.P., Aller, L.H., Hyung, S., & Brown, P.J.F. 1995, PASP, 107, 148
- (12) Kenyon, S.J. 1986, The Symbiotic Stars, Cambridge University Press
- (13) Mould, J. et al. 1990, ApJ, 353, L35
- (14) Partridge, H. & Schwenke, D. W. 1997, J. Chem. Phys., 106, 4618
- (15) Pogge, R.W., Atwood, B., Byard, P.L., O’Brien, T.P., Peterson, B.M., Lame, N.J., & Baldwin, J.A. 1995, PASP, 107, 1226
- (16) Rich, R.M., Mould, J., Picard, A., Frogel, J.A., & Davies, R. 1989, ApJ, 341, L51
- (17) Sato, H., Sakurai, Y., Beers, T., Brandner, W., Lehmann, T., Duerbeck, H. W., Della Valle, M., & Smette, A., IAU Circ., 6051
- (18) Sharov, A.S. 1990, Sov. Astron. Lett. 16, 85
- (19) Sharov, A.S. 1993, Sov. Astron. Lett. 19, 33
- (20) Tomaney, A.B. & Shafter, A.W. 1992, ApJS, 81, 683
- (21) Tomaney, A.B., Rich, R.M., Wagner, R.M., & Della Valle, M. 1994, IAU Circ., 5949
- (22) Turnshek, D.E., Turnshek, D.A., Craine, E.R., & Boeshaar, P.C. 1985, An Atlas of Digital Spectra of Cool Stars, Western Research Company
- (23) Wagner, R.M. 1994, IAU Circ., 5944
- (24) Xu, Y., McCray, R., Oliva, E., & Randich, S. 1992, ApJ, 386, 181
| Date of Observation (UT) | |||||
|---|---|---|---|---|---|
| 1994 March 3.67 | 8.67 | +1.22 | +1.65 | +0.93 | +1.82 |
| 1994 March 4.67 | 8.76 | +1.4 | +1.73 | +0.96 | +1.91 |
| 1994 March 7.71 | 9.82 | +1.97 | +1.07 | +2.27 | |
| 1994 March 8.70 | 10.29 | +1.94 | +1.20 | +2.59 | |
| 1994 March 10.71 | 11.18 | +1.85 | +1.32 | +3.09 | |
| 1994 March 11.4 | 12.56 | +1.63 | +2.01 | ||
| 1994 June 5/6 | 18.78 | +0.90 | +4.12 |
Note. — Photometry of Nova Sagittarii 94 by A.C. Gilmore with the 0.6-m f/16 Cassegrain at Mt John Observatory. Typical uncertainties are 0.05 magnitude, and 0.1 in U-B (1). The photometry listed for March 11 and June 5 was obtained by convolving the March 11 (Figure 4) and June 5 (Figure 5) spectra with standard filters. These measurements were then placed on an absolute scale by interpolating the photoelectric V values shown in Figure 2. We estimate the uncertainties to be approximately 10%.
| Date (UT) | Spectral Coverage (Å) | Resolution (Å) | Telescope | Model Temperature (Kelvin) |
|---|---|---|---|---|
| 1994 March 4.5 | 10 | 1.8-m Perkins | 4400 | |
| 1994 March 7. | 1.4 | 3.5-m NTT | ||
| 1994 March 9.5 | 10 | 1.8-m Perkins | 3800 | |
| 1994 March 11 | 7 | 3.6-m La Silla | 3100 | |
| 1994 March 20.4 | 13 | 3.6-m La Silla | 2600 | |
| 1994 April 26 | 0.5 | 1.5-m Palomar | ||
| 1994 June 5 | 3.5 | 4.5-m MMT | 2300 |
Note. — The log of our spectroscopic observations of V4332 Sgr. Column 1 shows the date of observation, columns 2 & 3 the spectral range and resolution of the data, respectively, and column 4 the telescope at which we obtained the data (see §4). Column 5 shows the effective temperature we have derived for each spectrum using the PHOENIX model atmosphere code (see §5).
| Observed Wavelength (Å) | Line Identification(s) | Equivalent Width (Å) |
|---|---|---|
| 3889.3 | Fe I + H8 | 62 |
| 3968.1 | H | 32 |
| 4099.8 | H | 115 |
| 4200.3 | Fe I | 65 |
| 4305.8 | Fe I | 30 |
| 4338.3 | H | 102 |
| 4413.5 | [Fe II] | 36 |
| 4569.0 | Mg I | 172 |
| 4858.3 | H | 305 |
| 5337.9 | Fe I | 90 |
| 5889.7B | Na I | |
| Na I | 40 | |
| 6297.2 | [O I] | 70 |
| 6360.6 | [O I] | 41 |
| 6558.7 | H | 450 |
Note. — The identifications of the brightest lines in the 1994 June 5/6 spectrum shown as Figure 5. Column 1 lists the observed wavelength of the emission feature, while column 2 lists the identification of the line(s). The equivalent widths of the features are given in column 3.