Scattering and Iron Fluorescence Revealed During Absorption Dips in Circinus X-1
Abstract
Rossi X-ray Timing Explorer (RXTE ) All-Sky Monitor light curves of Circinus X-1 show that intensity dips below the 1 Crab baseline occur near phase zero of the 16.55-d cycle of the source. RXTE Proportional Counter Array observations carried out between 1996 September 20–22 provided 60% observing efficiency for 48 hours around phase zero. These observations showed significant dipping activity during much of those two days. The dramatic spectral evolution associated with the dips is well-fit by variable and at times heavy absorption ( cm-2) of a bright component, plus an underlying faint component which is not attenuated by the variable column and whose flux is about 10% of that of the unabsorbed bright component. A prominent iron emission line at 6.4–6.6 keV is evident during the dips. The absolute line flux outside the dips is similar to that during the dips, with equivalent width increasing from as low as 44 eV outside dips to more than 400 eV during dips, indicating that the line is associated with the faint component. These results are consistent with a model in which the bright component is radiation received directly from a compact source while the faint component may be attributed to scattered radiation. Our results are also generally consistent with those of Brandt et al., who found that a partial-covering model could explain spectra obtained in ASCA observations of a low-to-high transition in Cir X-1. The relative brightness of the two components in our model requires a column density of cm-2 if the faint component is due to Thomson scattering in material that mostly surrounds the source. We find that illumination of such a scattering cloud by the observed direct component would produce an iron K fluorescence flux that is in rough agreement with the flux of the observed emission line. We also conclude that if the scattering medium is not highly ionized, our line of sight to the compact source does not pass through such a scattering cloud. Finally, we discuss simple pictures of the absorbers responsible for the dips themselves.
keywords:
Stars:individual(Cir X-1) — stars:neutron — X-rays:starsShirey, Levine, & Bradt \rightheadAbsorption Dips in Cir X-1
1 Introduction
Circinus X-1 exhibits complex X-ray variability during its 16.55-d intensity cycle (e.g., [Kaluzienski et al. 1976]; Dower, Bradt, & Morgan 1982; [Tennant 1987], 1988; [Stewart et al. 1991], Shirey et al. 1996, 1998, hereafter Papers I & II; Shirey, Bradt, & Levine 1999, hereafter [Paper III]). Enhanced mass transfer near periastron of a highly eccentric binary orbit may be responsible for both flaring and dipping behavior ([Murdin et al. 1980]; [Oosterbroek et al. 1995]; [Brandt et al. 1996]). Three type I X-ray bursts seen from Cir X-1 during an EXOSAT observation demonstrate that the system contains a neutron star with a weak magnetic field (Tennant, Fabian, & Shafer 1986).
Rossi X-ray Timing Explorer (RXTE ) All-Sky Monitor (ASM; 2–12 keV) light curves (see Papers I & II and [Shirey 1998]) show that Cir X-1 has maintained a bright baseline level of 1 Crab (1060 Jy at 5.2 keV) since early 1996. Dramatic flares generally begin during the day following phase zero, as given by the radio ephemeris ([Stewart et al. 1991]), of each 16.55-d cycle of the source. The flaring reaches as high as 3.7 Crab and typically lasts 2–5 days, but sometimes persists for most of the cycle. This behavior is similar to that observed in folded Ginga ASM data ([Tsunemi et al. 1989]).
The RXTE ASM light curves of Cir X-1 also show intensity points below the 1 Crab baseline near phase zero of about half of the cycles observed (see Fig. 3-1 of [Shirey 1998]). Because ASM coverage is incomplete (about ten to twelve 90-s exposures per day), it is possible that dips, lasting seconds to hours in duration, might actually occur in all cycles. During such dips, the X-ray intensity reaches as low as 80 mCrab. The dips most often occur during the half day before and after phase zero, but sometimes occur up to two days after phase zero. Occasionally, dips also occur at later phases in the ASM light curve, e.g., near day 4 of the cycle.
X-ray dips are common in the light curves of X-ray binaries. In some cases, dips may be due to a true decrease in the X-ray emission, e.g., due to an accretion disk instability in which the inner part of the disk is ejected ([Greiner, Morgan, & Remillard 1996]; [Belloni et al. 1997]). However, in most cases dips are attributed to absorption by matter passing through the line of sight to the X-ray emitting region (see [White, Nagase, & Parmar 1995] for a recent review). Deep, erratic dips indicate a compact emission region and structure in the absorber, probably near the outer edge of the accretion disk. Shallower, smooth dips occur in systems where the compact source is always obscured by the disk (due to a high inclination) so that only partial covering of an extended corona can occur. In some systems, X-ray eclipses by the companion star occur and are total or partial depending on whether the non-eclipse emission is dominated by a compact source or an extended region such a corona.
An ASCA observation of Cir X-1 at phase zero showed a low-to-high intensity transition ([Brandt et al. 1996]), apparently the egress from a dip similar to those seen with the ASM. Brandt et al. used a partial-covering model to fit the spectra before and after the transition. A strong iron K edge in the low-state spectrum indicated that the obscuring matter had a very high column density, i.e., cm-2. Those authors suggested that scattering by electrons in circumstellar material might be the source of the faint (dip) spectrum.
In Papers I, II, & III we presented RXTE results on the spectral and timing evolution of Cir X-1 during quiescent and active phases, exclusive of the behavior during dips. Those results demonstrate that Cir X-1 at least sometimes exhibits Z-source behavior, including horizontal branch oscillations (HBOs) at unusually low frequencies (1.3–35 Hz), normal branch oscillations (NBOs) at 4 Hz, and only very low frequency noise (VLFN) on the flaring branch. In this fourth paper we focus on spectral evolution during dips observed with the RXTE Proportional Counter Array (PCA).
2 Observations
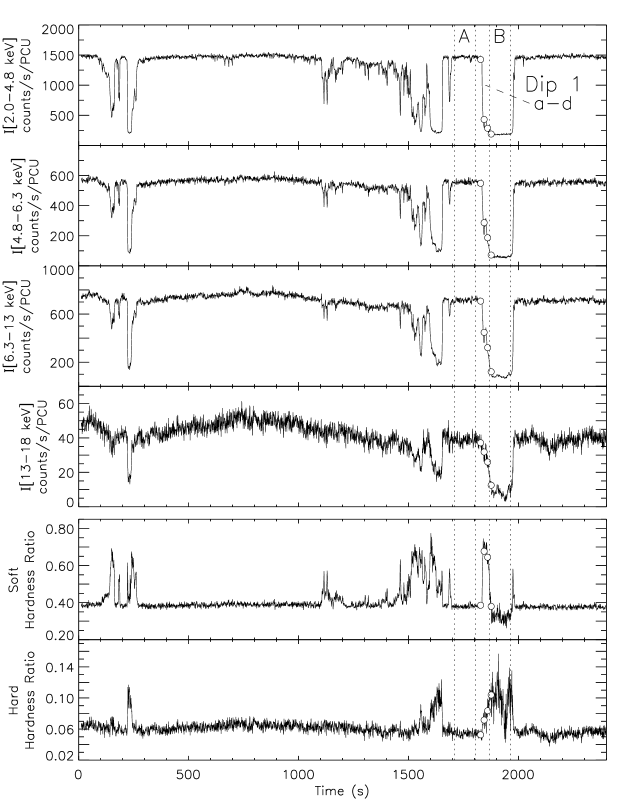
Observations of Cir X-1 with the PCA were made during 1996 September 20–22, covering 48-hours around phase zero with 60% observing efficiency (see Fig. 1). These observations showed significant dipping for about half of the observed time and provided the opportunity to study dip behavior in detail.
The observations began about a half day before phase zero. The intensity of Cir X-1 was very low (an extended dip) during most of the first half day of the observations, and then returned to the much higher “quiescent” level shortly after phase zero. Shorter intermittent dips occurred during the 0.3 days following phase zero. The strongest dips all reached similar minimum levels of about 200–350 counts s-1 PCU-1 (2–18 keV) after background (10 c s-1 PCU-1) was subtracted, where 1 Crab 2600 c s-1 PCU-1. A second episode of significant extended dipping occurred from about 0.5 to 0.9 days after phase zero, followed by “active-state” behavior for the remaining half day of the observation. The active state is characterized by (1) a gradual increase of the average intensity in the lowest-energy PCA band (which dominates the total PCA count rate) accompanied by a significant drop in the high-energy bands, and (2) individual flares on shorter timescales (less than a few hours) which show increased intensity in all PCA energy bands. The former behavior results in gradual shifting of spectral tracks in color-color and hardness-intensity diagrams (CDs/HIDs) and is related to the 16.55-d intensity cycle of Cir X-1. The latter behavior corresponds to motion along branches of the “Z” track in CDs and HIDs. For example, based on tracks in hardness-intensity diagrams and on timing properties, we find that the burst-like events near day 348.0 in Figure 1 correspond to motion up the flaring branch. The final two segments of Figure 1 (after day 348.1) show motion from the NB/FB apex up the normal branch to higher total intensity, and back down. The spectral and timing evolution during the active state of Cir X-1 was discussed in detail in Papers II & III.
3 Evolution of Hardness Ratios During Dips
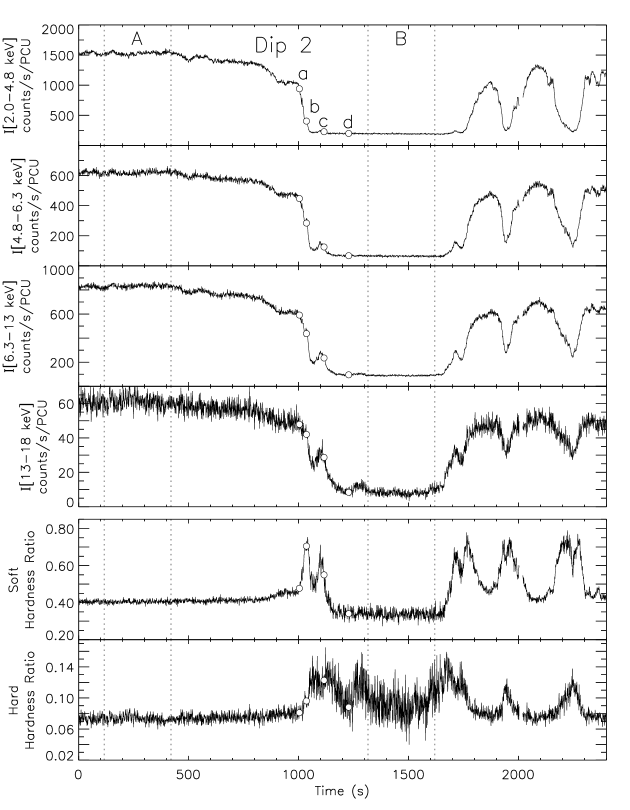
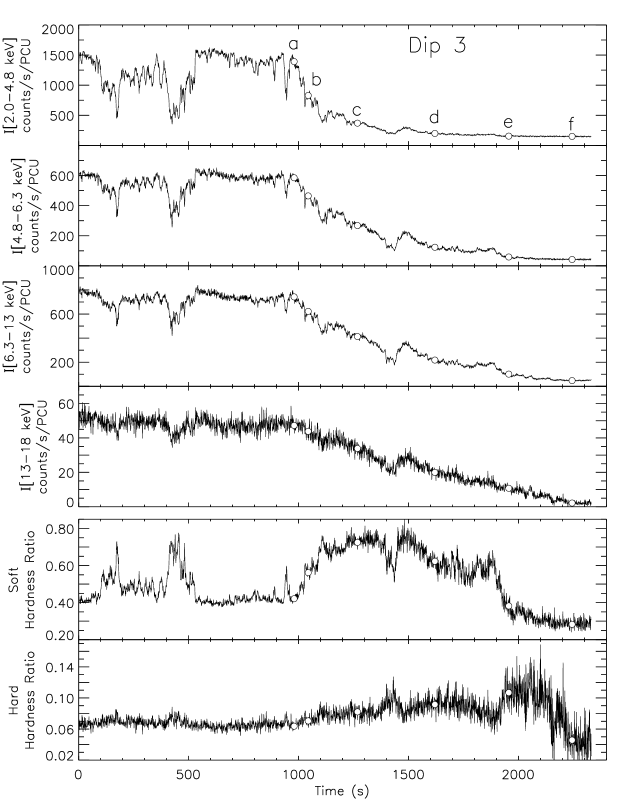
Three dips, each showing a complete transition from the baseline intensity level down to a deep minimum, have been selected for further study and are labeled Dips 1–3 in Figure 1. An expanded 2400-s segment of Figure 1 is shown for each of these dips in Figures 2, 3, and 4. The light curves in multiple PCA energy channels show that the transitions into and out of dips occur more rapidly at low energy that in higher energy bands; this is most pronounced for Dip 3 in Figure 4. The hardness ratios thus initially increase (harden) as the denominator falls more quickly than the numerator. Low-energy count rates are also the first to reach a minimum level well above background. This causes the hardness ratios to decrease (soften) since the denominator approaches a constant while the numerator continues to decrease.
The intensity and hardness ratios from Dip 3 have been used to produce the color-color and hardness-intensity diagrams (CD & HID) shown in Figure 5. The spectral evolution during the dip produces tracks with dramatic bends in both the CD and the HID. A similar CD and HID (Fig. 6) has also been produced for the first three segments of Figure 1 (day 346.31–346.52), during which the intensity was mostly in an extended low/dip state but briefly reached higher intensity.
In the HIDs of Figures 5 and 6, dips produce motion to the left (toward lower intensity) and initially upward (harder), but turn downward (softer) as the count rate in the denominator approaches its bottom level. In the CDs where, by definition, two hardness ratios (hard and soft color) are employed, motion is initially to the right and upward (harder in both colors but mostly in the lower channels). When the lowest channel reaches the bottom level, the track turns to the left but continues upward. When intermediate channels stop decreasing and only the highest channels still drop, the track finally turns downward. The intensity of the second and third lowest energy bands rapidly drop by a factor of two at time 1900 s in Figure 4, just before settling to their lowest levels; this resulted in a gap in the the middle CD branch in Figure 5.
Evolution of the position in CDs and HIDs apart from dips is interpreted in Papers II & III as motion around a “Z” track as well as shifts of the entire “Z” pattern. The exact position of a dip track in the diagrams depends on its starting point, i.e., the baseline intensity and spectrum. Although starting from different positions, all dips below the 1-Crab baseline in PCA light curves of Cir X-1 produce the same general shape in CDs and HIDs. However, the tracks may not be complete for weak dips.
4 Evolution of Energy Spectra During Dips
4.1 Spectral Model
Cold (neutral) matter most effectively absorbs photons at lower energies, so gradually increasing obscuration by cold matter produces dips that are more gradual at high energy than at low energy, as we observe in Cir X-1. However the fact that strong dips in Cir X-1 show a minimum intensity well above background suggests the presence of a faint component unaffected by the dips. Thus, in modeling spectra of dips in Cir X-1, at least two components are necessary: (1) a bright component modified by variable and at times very heavy absorption and (2) a faint component seen through a constant and relatively low column density. From a study of the energy spectrum during non-dip observations ([Paper III]), we found that the 2.5–25 keV spectrum of Cir X-1 was generally fit well with a model consisting of a multi-temperature “disk blackbody” plus a higher-temperature (2 keV) blackbody. We find that a model based on these components also adequately fits the current spectra, so a disk blackbody plus blackbody is adopted for the bright component during dips. For simplicity, we assume that the unabsorbed spectral shape of the faint component is similar to that of the bright component, as might be the case if it is due to scattering, e.g., by a corona or stellar wind, of radiation coming directly from a compact central source back into the line of sight from other initial emission directions. Thus for the faint component we use the same model and parameters as the bright component, but normalized by an energy-independent multiplicative factor which is less than unity. We discuss the validity of this assumption below.
The absorption column density for the faint component is assumed to remain constant throughout a dip, but the column density for the bright component is allowed to vary to produce the dips. The light curves during strong dips show a significant reduction in intensity even at high energy (13–18 keV), indicating very high column densities ( cm-2). Photoelectric absorption is the dominant process responsible for dips at low energy, but the photoelectric cross-section decreases with energy. Thus, above about 10 keV, Thomson scattering (with an approximately energy-independent cross section) becomes dominant. Both photoelectric and Thomson-scattering factors are included in the attenuation calculation for the bright component. For simplicity, the effective hydrogen column density and the Thomson-scattering (electron) column density are taken to be equal; the actual value of the latter will be slightly higher (by 20%) due to atoms (mainly helium) with more than one electron. The complete model used can then be expressed as:
| (1) |
where is the observed flux, and are the photoelectric and Thomson cross-sections, and are the effective hydrogen column densities of the bright and faint components respectively, is the ratio of the unabsorbed flux of the faint component to the unabsorbed flux of the bright component, and is the disk blackbody plus blackbody model. For all model components we assume solar abundances ([Anders & Ebihara 1982]), and we used the photoelectric cross-sections given by Morrison & McCammon (1983).
4.2 Energy Spectra Inside and Outside Dips
We make use of joint fits of spectra from inside and outside a given dip to simultaneously constrain the parameters of the various spectral components. The total value obtained when the model is fit to multiple spectra is minimized by varying the model parameters, but allowing only the absorption column density of the bright component to vary among spectra. Since the disk blackbody and blackbody parameters typically evolve on timescales of hours (see [Paper III]), it is important in this analysis to use a spectrum from immediately before (or after) the dip.
The spectral fits were carried out on background-subtracted PCA pulse-height spectra. A 1% systematic error estimate was added in quadrature to the estimated statistical error (1 ) for each channel of the spectra to account for calibration uncertainties. Fits were carried out only on data from PCUs 0, 1, and 4 and for energy channels corresponding to 2.5–25 keV, since the response model (version 2.2.1) for the other two PCA detectors and for outside that energy range has been determined to be less accurate ([Remillard et al. 1998]). Fit parameters reported are the average values for PCUs 0, 1, and 4. Errors are conservatively estimated as the entire range encompassed by the 90% confidence intervals from each of the detectors.
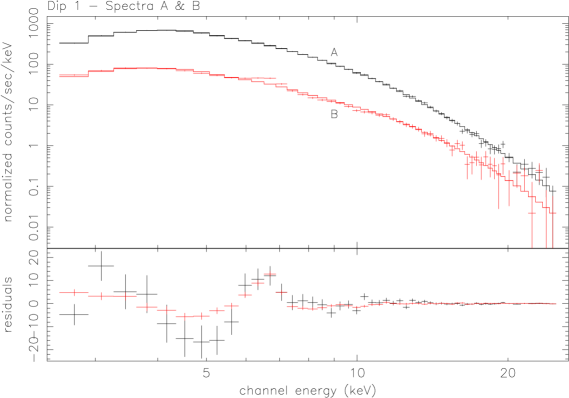
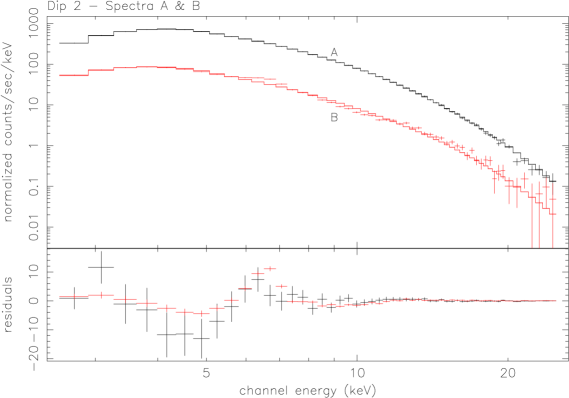
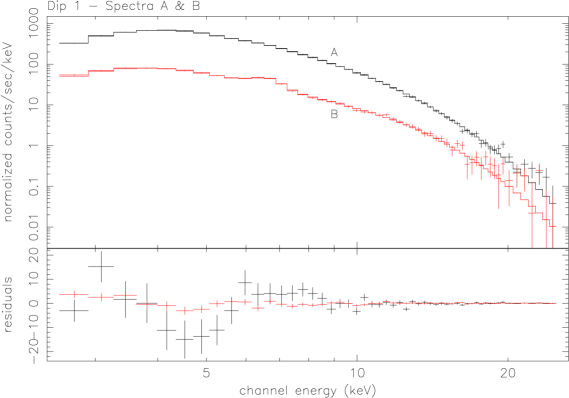
Time segments immediately prior to dips 1 and 2 (“A”) and during the lowest portions of dips 1 and 2 (“B”) were selected for spectral analysis (dashed lines in Figs. 2 and 3). The two segments from Dip 1 were each 96 s in duration, and those from Dip 2 were 304 s in duration. The pulse-height spectra from these two time segments are shown in Figure 7 along with best-fit models. The parameters for the bright and faint component of each best-fit model are listed in the first two lines of Table 1. The distance to Cir X-1 has been estimated to be about 6–10 kpc ([Stewart et al. 1991]; [Goss & Mebold 1977]), so we chose a value of 8 kpc in converting blackbody and disk blackbody normalizations to radii. The column density () of the faint component is given in the table. The column density () of the bright component differs for spectra A and B of each fit and is thus given separately in Table 1.
The disk blackbody and blackbody parameters for both dips are similar to those obtained for non-dip spectra in [Paper III] (temperatures of 1.5 keV and 2.2 keV respectively). The unabsorbed flux of the faint component is 10% that of the bright component. The column density of the faint component is very low, and consistent with zero. This low value is inconsistent with estimates of the interstellar column density ( 1.8–2.4 cm-2) measured with ASCA and ROSAT ([Brandt et al. 1996]; [Predehl & Schmitt 1995]). Apparently, the spectral shape of the faint component is slightly softer than that of the bright component, giving the appearance of reduced interstellar absorption. In fact, the ASCA data from a dip egress also showed that the low-state spectrum was softer than the high-state spectrum, and Brandt et al. (1996) hypothesized that this may be due to X-rays scattered into the line of sight by interstellar dust. This scattering by dust is distinct from the scattering by circumstellar material that might be responsible for the low-state spectrum itself. The use of different spectral models for the bright and faint components or the addition of another continuum component would not be productive due to the large number of parameters involved, so we allow the column density of the faint component to compensate for small differences in spectral shape.
The column density of the bright component outside dips (spectra 1A and 2A; see Table 1) is about cm-2, just slightly above the interstellar value. The column density during the low segments of dips (spectra 1B and 2B) is extremely high, i.e., cm-2 for spectrum 1B and cm-2 for spectrum 2B. This high column density value is required to produce the observed reduction in flux at 20 keV and is sufficient to render the absorbed component totally negligible at lower energies. Thus, the flux in spectra 1B and 2B below 5 keV may be attributed entirely to the faint component.
4.3 Iron Emission Line
Pulse-height spectra from the bottom of dips (spectra 1B and 2B in Fig. 7) show a prominent peak near 6.5 keV, suggesting iron K emission. The residuals for fitted spectra from both inside and outside the dips are similar, and in particular show peaks near 6.5 keV with similar absolute flux levels. This suggests that the line feature is associated with the faint component. If the faint component is visible primarily because of scattering, iron fluorescence would be expected to occur in the scattering medium (see discussion section below).
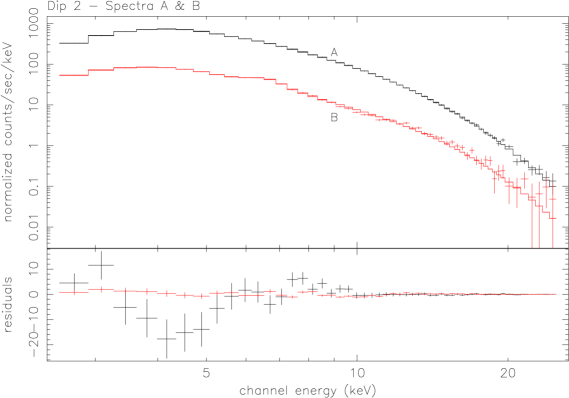
The fits were repeated including a Gaussian emission line component at 6.4–6.6 keV. Allowing the line flux to differ between fits of spectra A and B of each dip confirms that the line flux is the same to within a factor of two or less, despite an order of magnitude difference in continuum flux. Thus we jointly fit the spectra of each dip using the same line parameters for both spectra (Fig. 8). The addition of the line does reduce the magnitude of the residuals near 6.5 keV, but does not improve the fit below 5.5 keV. The results of the joint fits, including the Gaussian line, are listed in the second group in Tables 1 and 1. They are generally consistent with the model parameters from the previous fits within the 90% confidence limits. Table 1 also shows that a significant improvement in the reduced value was achieved in both cases. We will continue to include a Gaussian line in all subsequent fits and list its fitted parameters in Table 1. Although the best-fitting centroid energy of the line is close to 6.6 keV, the relatively coarse energy resolution of the PCA (1 keV FWHM at 6 keV) is insufficient to confirm whether the line is from neutral or partially ionized iron or whether it is actually composed of multiple unresolved narrow lines.
4.4 Spectral Evolution During Dip Transitions
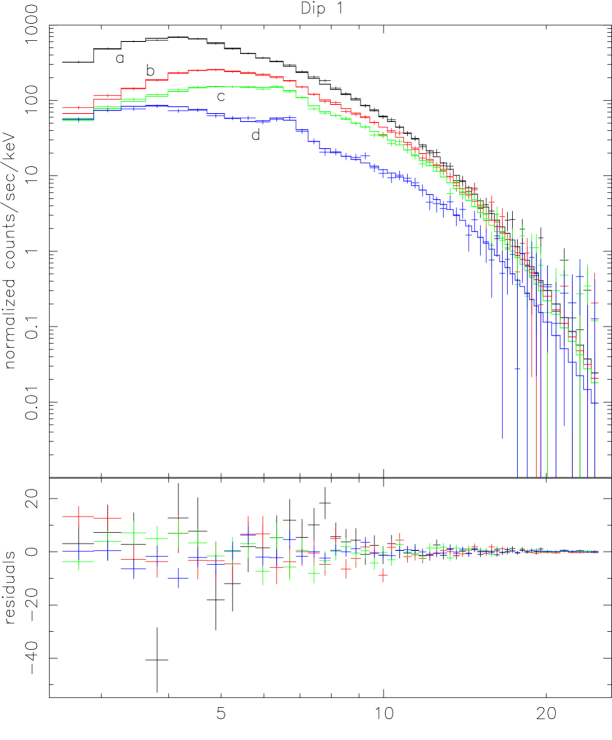
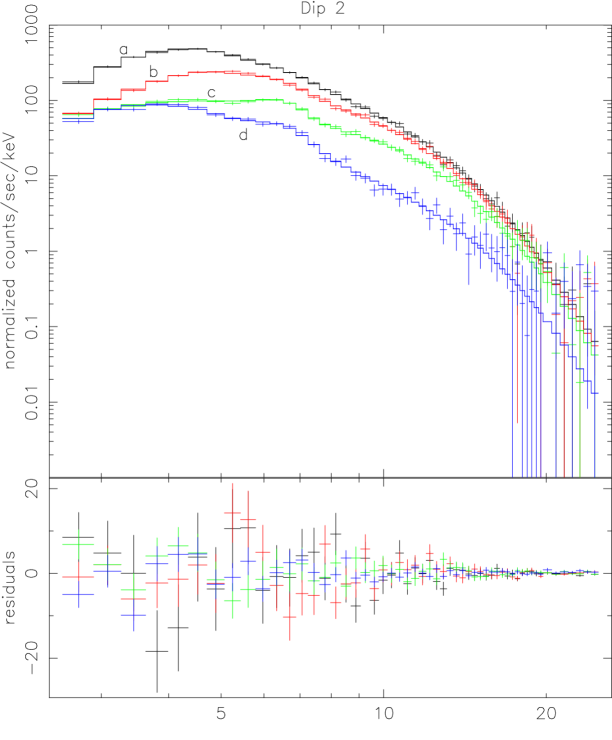
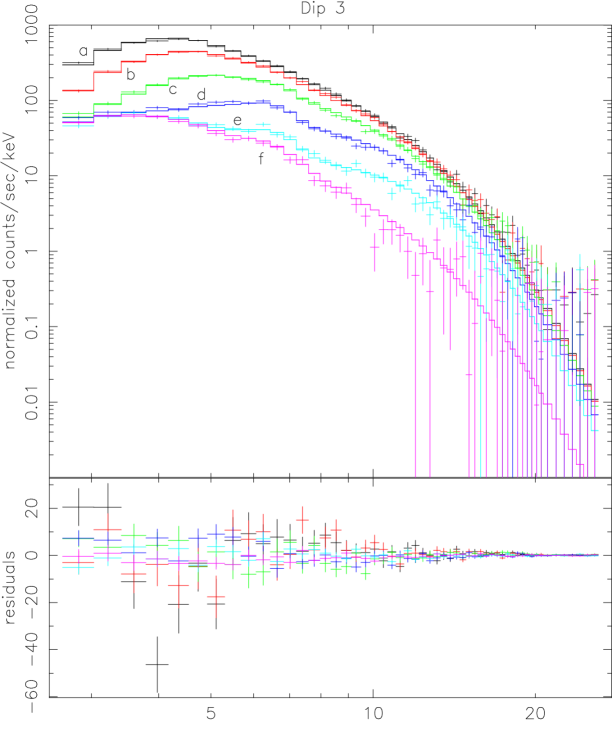
Through its large collecting area, the PCA provides good-quality spectra of bright sources such as Cir X-1 every 16 s. This enables us to study the detailed evolution of the spectrum during the transitions between high and low flux states outside and inside dips. We selected four to six 16-s segments from the ingress of dips 1, 2 and 3 (indicated as circles on Figures 2, 3, and 4) and jointly fit the 4–6 spectra of each dip with the model developed above. The 16-s pulse-height spectra from each of these dips are shown in Figures 9, 10, and 11, together with the model curves and residuals.
The low-energy intensity in each case initially decreases but then reaches a fixed level while the intensity at higher energy continues to decrease. A “step” near 7.1 keV is evident in spectra (most prominently in spectra 1c, 2c, 3d) for which significant, but not total, absorption of the bright component occurs at that energy. This step cannot be accounted for solely by the emission line but is naturally fit by iron K-edge absorption intrinsic to neutral or nearly-neutral absorbing material with a column density (assuming solar abundances) of few (intermediate and lower spectra, Table 1). As noted above, the intensity at the bottom of the dip is significantly reduced relative to outside the dip even at 20 keV.
The fit parameters for the bright and faint components in each joint fit of the 16-s spectra (1a–d, 2a–d, and 3a–f) are given in Table 1. The best-fitting parameters for the spectra during dips 1 and 2 are very similar to the values obtained above for the fits (with iron line included) of the longer-exposure pairs of spectra, 1A/B and 2A/B respectively, from the same dips. The unabsorbed flux of the faint component relative to the unabsorbed flux of bright component is 10–12% in the fits of spectra 1a–d and 2a–d and somewhat lower, 5.4%, for spectra 3a–f. The column density for the faint component is again consistent with zero in all cases. The Gaussian line parameters for these fits are listed in Table 1, and indicate a line centered at 6.4–6.6 keV. The best-fitting line flux differs by a factor of two among the three dips but is consistent, within the errors, with no change. For each set of spectra, the variable absorption column density of the bright component is shown in Table 1. In each case the column density increases from a relatively low value, (4–9), at the start of a dip to very high values, , at the lowest part of the dips.
These fits show that the model developed above is quite successful in reproducing the evolution of the spectrum through the dips. This justifies our assumption of common spectral values in the joint fits, where only the absorption column density on the bright component varies between all spectra of a given dip.
5 Discussion
During absorption dips in Cir X-1, about 10% of the total 2.5–25 keV flux remains unabsorbed. We conclude that the absorbing material does not completely cover the X-ray source, and suggest that it is likely that the material totally covers our line of sight to a compact X-ray source during deep dips while a more extended source of X-rays remains fully or nearly fully visible. Similar behavior is observed during dips in other X-ray binaries. For example, an unabsorbed spectral component is detected during absorption dips in the binary pulsar Her X-1 and is attributed to scattering in an extended corona (see [Stelzer et al. 1999] and references therein). Likewise, curved CD/HID tracks similar to those we observe in Cir X-1 were observed in the black-hole candidates GRO J1655-40 and 4U 1630-47 and were successfully modeled by absorption plus a faint unabsorbed component ([Kuulkers et al. 1998]; [Tomsick et al. 1998]).
Our results are generally consistent with the ASCA results of Brandt et al. (1996, see above) for Cir X-1, but with the high-statistics RXTE data, we are able to demonstrate the detailed evolution of the continuum spectrum through selected high-to-low flux transitions (dips). The ASCA spectra showed an iron K edge due to absorption with column densities near cm-2. At 6.4 keV in the low-state ASCA spectrum, an iron line was seen with a flux of photons cm-2 s-1, and in the high-state spectrum, an upper limit of photons cm-2 s-1 was derived for such a line. This indicates that the equivalent width of the line is much smaller in the high state, due to the brighter continuum, but does not prove that the flux of the line was significantly smaller. Our analysis shows that a prominent iron emission line is present outside dips at a similar flux level, photons cm-2 s-1 (see Table 1), as inside dips. The equivalent width is therefore much smaller outside dips, as low as 44 eV, than during the deepest dips, where the equivalent width is typically 410–940 eV. Since scattering by an extended cloud of material is probably responsible for the faint component, it is likely that the iron K emission is also produced in the scattering medium (see below).
If the scattering medium was a spherically symmetric cloud around the central X-ray source, scattering would not significantly alter the total flux of the system but would simply enlarge the size of the emission region for some fraction of the flux. We observe that 10% of the flux is in the diffuse component, requiring a column density of almost cm-2 to provide sufficient Thomson-scattering optical depth. The iron line associated with the scattered component indicates that the scattering medium is not pure hydrogen. Therefore, if the scattering material is not highly ionized, the direct component should show evidence for photoelectric absorption with a similar column density. The observed column density outside dips is about cm-2—an order of magnitude less than required in this simple model. Thus we can conclude that the scattered component is not produced in a spherical cloud of low-ionization state matter which totally surrounds and covers the central source.
The column density derived from the strength of the faint component can be used to estimate the iron K fluorescent flux in the scattering cloud. Based on the spectrum we measure above the iron K-shell ionization energy of 7.1 keV, a cloud of column density cm-2 will photoelectrically absorb a flux of about 0.12 photons cm-2 s-1. The K fluorescence yield for iron is about 0.3 ([Bambynek et al. 1972]), so we expect a flux in the emission line of photons cm-2 s-1. This is actually somewhat higher, by a factor of 1.5–3, than the line fluxes we have measured (Table 1); however, this simple model illustrates that the iron K emission in Cir X-1 is naturally explained by the strong scattered component revealed during dips.
We do not expect to find QPOs, all faster than 1 Hz in Cir X-1, during portions of dips when the direct component is almost entirely absorbed, unless the scattering occurs in a region significantly smaller than a light-second (roughly the size of the accretion disk, – cm, discussed below). Power spectra during most of this 2-day observation show weak HBOs near 30 Hz, broad NBOs at 4 Hz, or VLFN. No QPOs are detected during the lowest portions of absorption dips; however, the upper limits on QPOs in these low count rate circumstances do not allow us to exclude QPOs at a level similar to that outside the dips.
The fact that absorption dips in Cir X-1 mainly occur within a day of phase zero and are then followed by significant flaring suggests that the dips are associated with the mass transfer process. Thus, absorption might be due to the mass transfer stream itself, a bulge or “splash point” near the edge of an accretion disk due to collision of an incoming stream with the disk, or a blob of outer disk material protruding vertically into the line of sight. Although absorption dips in Cir X-1 show a wide range of profiles and durations, for a brief deep dip we can attempt to estimate the size and density of an absorber near the outer edge of an accretion disk.
We first consider the simple case of blobs in Keplerian motion near the outer edge of a disk. Other than the 16.55 d orbital period of Cir X-1, the binary parameters, including a probable high eccentricity, are unknown. However, the Keplerian velocity in the outer edge of a disk does not depend strongly on the binary parameters, so we adopt values of and eccentricity 0.8. An outer disk radius of – cm, giving a Keplerian velocity of order 1000 km s-1, would then be about 5–50% of the radius of the instantaneous critical potential lobe of the neutron star near periastron. A typical brief deep dip such as Dip 1 lasts of order 100 s, implying an azimuthal dimension of cm, or a significant fraction of the accretion disk size. If the radial and azimuthal dimensions of the blob are similar, a column density of atoms cm-2 requires a number density in the blob of atoms cm-3. For typical luminosities of erg s-1 cm-2 (determined from the unabsorbed flux, assuming a distance to Cir X-1 of 8 kpc), the ionization parameter for a blob of this density would be –, which would in turn imply that the blob of gas would be nearly fully ionized ([Kallman & McCray 1982]). However, such a highly ionized absorber is inconsistent with the strong Fe K edge near 7 keV observed during dips in Cir X-1. The large size of the blobs in this picture relative to the disk size might indicate that the blobs are actually azimuthally extended or that dips, particularly the longer dips, are due to multiple blobs. The Keplerian period of blobs in this picture is of order s; however, no recurrence of dips on this time scale is apparent in the light curves, suggesting that such blobs may be short-lived.
Alternately, we consider absorbers that are co-rotating with the binary orbit, e.g, a stationary “splash point” on the outer edge of the disk. Using the same simple assumptions about the binary parameters and disk size as above, we find an azimuthal velocity of order 10 km s-1 for such an absorber. This slower velocity would require a much smaller absorber, with dimensions cm, compared to a blob in a Keplerian orbit. The corresponding number density in the absorber would therefore be atoms cm-3. The ionization parameter would be lower for these denser blobs, 10–100, and the absorbing gas would not be fully ionized, consistent with the photoelectric absorption observed during dips ([Kallman & McCray 1982]). In this picture, the fact that Cir X-1 actually exhibits many dips during a couple days of each binary cycle suggests a stationary (in the rotating frame) structure in the accretion disk (i.e., a stationary wave) or else complex structure (e.g., shocks or turbulence) in the accretion stream.
The chaotic nature of the PCA light curves during dips (Figs. 1–4) indicate that we are observing fine structure (temporal or geometrical) of the obscuring material. The true nature of the absorbing material is likely to be as complex as the light curves themselves, reflecting the turbulent conditions associated with mass transfer in an eccentric binary. In Cir X-1 the accretion disk probably experiences a high degree of disturbance due to a high eccentricity with enhanced mass transfer occurring near periastron.
Acknowledgements.
We acknowledge the RXTE teams at MIT & GSFC for their support. In particular we thank E. Morgan, R. Remillard, W. Cui, and D. Chakrabarty for useful discussions. Support for this work was provided through NASA Contract NAS5-30612.References
- [Anders & Ebihara 1982] Anders, E. & Ebihara, M. 1982, Geochim. Cosmochim. Acta, 46, 2363
- [Bambynek et al. 1972] Bambynek, W. Craseman, B., Fink, R. W., Freund, H. U., Mark, H., Swift, C. D., Price, R. E., & Rao, P. V. 1972, Rev. Mod. Phys., 44, 716
- [Belloni et al. 1997] Belloni, T., Mendez, M., King, A. R., Van Der Klis, M. & Van Paradijs, J. 1997, ApJ, 479, L145
- [Brandt et al. 1996] Brandt, W. N., Fabian, A., Dotani, T., Nagase, F., Inoue, H., & Kotani, T. 1996, MNRAS, 283, 1071
- [Dower et al. 1982] Dower, R. G., Bradt, H. V., & Morgan, E. H. 1982, ApJ, 261, 228
- [Goss & Mebold 1977] Goss, W. M. & Mebold, U. 1977, MNRAS, 181, 255
- [Greiner, Morgan, & Remillard 1996] Greiner, J., Morgan, E. H., & Remillard, R. A. 1996, ApJ, 473, L107
- [Kallman & McCray 1982] Kallman, T. R. & McCray, R. 1982, ApJS, 50, 263
- [Kaluzienski et al. 1976] Kaluzienski, L. J., Holt, S. S., Boldt, E. A., & Serlemitsos, P. J. 1976, ApJ, 208, L71
- [Kuulkers et al. 1998] Kuulkers, E., Wijnands, R., Belloni, T., Mendez, M., van der Klis, M., & van Paradijs, J. 1998, ApJ, 494, 753
- [Morrison McCammon 1983] Morrison, R. & McCammon, D. 1983, ApJ, 270, 119
- [Murdin et al. 1980] Murdin, P., Jauncey, D. L., Haynes, R. F., Lerche, I., Nicolson, G. D., Holt, S. S., & Kluzienski, L. J. 1980, A&A, 87, 292
- [Oosterbroek et al. 1995] Oosterbroek, T., van der Klis, M., Kuulkers, E., van Paradijs, J., & Lewin, W. G. H. 1995, A&A, 297, 141
- [Predehl & Schmitt 1995] Predehl, P. & Schmitt, J. H. M. M. 1995, A&A, 293, 889
- [Remillard et al. 1998] Remillard, R. A., Morgan, E. H., McClintock, J. E., Bailyn, C. D., Orosz, J. A. 1998, ApJ, submitted
- [Paper I] Shirey, R. E., Bradt, H. V., Levine, A. M., & Morgan, E. H. 1996, ApJ, 469, L21 (Paper I)
- [Paper II] Shirey, R. E., Bradt, H. V., Levine, A. M., & Morgan, E. H. 1998, ApJ, 506, 374 (Paper II)
- [Paper III] Shirey, R. E., Bradt, H. V., & Levine, A. M. 1999, ApJ, 517, in press (Paper III)
- [Shirey 1998] Shirey, R. E. 1998, Ph. D. Thesis, Massachusetts Institute of Technology
- [Stelzer et al. 1999] Stelzer, B., Wilms, J., Staubert, R., Gruber, D., & Rothschild, R. 1999, A&A, in press, astro-ph/9812128
- [Stewart et al. 1991] Stewart, R. T., Nelson, G. J., Penninx, W., Kitamoto, S., Miyamoto, S., & Nicolson, G. D. 1991, MNRAS, 253, 212
- [Tennant 1987] Tennant, A. F. 1987, MNRAS, 226, 971
- [Tennant 1988] Tennant, A. F. 1988, MNRAS, 230, 403
- [Tennant et al. 1986] Tennant, A. F., Fabian, A. C., & Shafer, R. A. 1986b, MNRAS, 221, 27P
- [Tomsick et al. 1998] Tomsick, J. A., Lapshov, I., & Kaaret, P. 1998, ApJ, 494, 747
- [Tsunemi et al. 1989] Tsunemi, H., Kitamoto, S., Manabe, M., Miyamoto, S., & Yamashita, K. 1989, PASJ, 41, 391
- [van der Klis 1994] van der Klis, M. 1994, ApJS, 92, 511
- [White, Nagase, & Parmar 1995] White, N., Nagase, F., & Parmar, A. N. 1995, in X-Ray Binaries, ed. W. G. H. Lewin, J. van Paradijs, & E. P. J. van den Heuvel (Cambridge University Press: Cambridge), 1


| Disk Blackbody | Blackbody | Faint Component | ||||||
|---|---|---|---|---|---|---|---|---|
| Joint | Iron | cc Inner radius of the accretion disk (times , where is the angle between the normal to the disk and the line of sight) for a distance of 8 kpc. | ddBlackbody radius for a distance of 8 kpc. | ff Absorption column density of the faint component. See Table 1 for the variable absorption of the bright component. | ||||
| fitaa Joint fits of spectra from outside (A) and inside (B) dips 1 and 2 and for the four to six 16-s spectra (a–f) during dips 1, 2, and 3 (using the model given in equation 4.1). Only the column density () of the bright component is allowed to vary between spectra (see Tables 1 and 1). Errors quoted are 90% confidence limits for a single parameter (). | Linebb Gaussian emission line at 6.4–6.6 keV was included in the final five fits (see Table 1). | (keV) | (km) | (keV) | (km) | ee Ratio of the unabsorbed flux of the faint component to the unabsorbed flux of the bright component. | (cm-2) | gg , where the number of spectral bins (52–54 per spectrum) minus the number of fit parameters. The range of values represents the fits for PCUs 0, 1, & 4. |
| 1A–B | no | 3.89–4.07 | ||||||
| 2A–B | no | 7.58–7.84 | ||||||
| 1A–B | yes | 1.44–1.62 | ||||||
| 2A–B | yes | 1.87–2.15 | ||||||
| 1a–d | yes | 0.99–1.20 | ||||||
| 2a–d | yes | 0.80–1.12 | ||||||
| 3a–f | yes | 1.27–1.34 | ||||||
cccc \tablewidth0pt \tablecaption Absorption column density of the bright component outside (A) and inside (B) Dips 1 and 2. \tablehead \colhead & \colhead \colhead \colhead \nl\colheadSpectrum \colhead(cm-2) \colheadSpectrum \colhead(cm-2) \startdata No Emission Line \nl1A 2A \nl1B 2B \nl With Emission Line\tablenotemarka \nl1A 2A \nl1B 2B \nl\enddata\tablenotetexta A Gaussian emission line at 6.4–6.6 keV was included, with the same parameters outside and inside the dips (see Table 1).
cccc \tablewidth0pt \tablecaption Gaussian emission line parameters for the joint fits of dip spectra. \tablehead \colhead Joint \colhead \colhead \tablenotemarka \colhead Line flux \nl\colhead Fit \colhead (keV) \colhead (keV) \colhead (photons cm-2 s-1) \startdata1A–B \nl2A–B \nl1a–d \nl2a–d \nl3a–f \nl\enddata\tablenotetexta Gaussian width.
cccccc \tablewidth0pt \tablecaption Effective hydrogen column density responsible for the variable absorption of the bright component during 16-s spectra from dips 1, 2, and 3. \tablehead \colhead \colhead \colhead \colhead \colhead \colhead \nl\colheadSpectrum \colhead(cm-2) \colheadSpectrum \colhead(cm-2) \colheadSpectrum \colhead(cm-2) \startdata1a 2a 3a \nl1b 2b 3b \nl1c 2c 3c \nl1d 2d 3d \nl 3e \nl 3f \nl\enddata