Is the cosmic microwave background really non-Gaussian?
Abstract
Two recent papers have claimed detection of non-Gaussian features in the COBE DMR sky maps of the cosmic microwave background. We confirm these results, but argue that Gaussianity is still not convincingly ruled out. Since a score of non-Gaussianity tests have now been published, one might expect some mildly significant results even by chance. Moreover, in the case of one measure which yields a detection, a bispectrum statistic, we find that if the non-Gaussian feature is real, it may well be due to detector noise rather than a non-Gaussian sky signal, since a signal-to-noise analysis localizes it to angular scales smaller than the beam. We study its spatial origin in case it is nonetheless due to a sky signal (e.g., a cosmic string wake or flat-spectrum foreground contaminant). It appears highly localized in the direction , , since removing a mere 5 pixels inside a single COBE beam area centered there makes the effect statistically insignificant. We also test Guassianity with an eigenmode analysis which allows a sky map to be treated as a random number generator. A battery of tests of this generator all yield results consistent with Gaussianity.
Subject headings:
cosmology: cosmic microwave background1. Introduction
The detection of fluctuations in the cosmic microwave background (CMB) by the Differential Microwave Radiometer (DMR) on board the Cosmic Microwave Explorer (COBE) satellite (Smoot et al. 1992) began a new era for studies of the Universe on large scales. Current and planned experiments offer the promise of tight constraints on cosmological parameters, including both quantities important for observational astronomy and inflationary parameters which may provide the ultimate testing ground for fundamental particle physics, relating phenomena on the largest and smallest observable scales.
A key cosmological constraint from observations of the primordial density field is its general statistical nature. In most inflationary scenarios, the density is a Gaussian random field, (although see, e.g., Peebles 1999). This implies that the joint probability distribution of the temperatures in the galaxy-cut DMR sky map is a multivariate Gaussian. In contrast, topological defect models predict a non-Gaussian density field (e.g., Avelino et al. 1998). However, an analysis by Pen et al. (1997) suggests that defects are inconsistent with the observed power spectrum of fluctuations. At present, inflationary models, or at least generically Gaussian models, dominate the literature on large-scale structure.
It is therefore quite intriguing that two groups, Ferreira, Magueijo & Gorski (1998, hereafter FMG) and Pando, Valls-Gabaud & Fang (1998, hereafter PVF), claim that the CMB fluctuations measured by COBE DMR are non-Gaussian. If substantiated, these results could potentially rule out standard inflation as the primary mechanism for cosmic structure formation in the early Universe. The results are all the more surprising because the literature documents considerable previous effort to identify non-Gaussianity in the CMB (see references given in §3), all of which failed.
In this Letter, we revisit the question of whether COBE DMR rules out Gaussianity. We begin with a series of new tests of Gaussianity based on eigenmode analyses of the DMR map (§2). We then consider the results of FMG and PVF in Section 3, exploring their sensitivity to individual modes and spatial features as well as the significance of these results in light of the other statistical tests which have been applied to the data. We present our conclusions in Section 4.
2. Statistics of eigenmodes
We analyze a sky map formed of the combined 53 and 90 GHz four year DMR data pixelized at resolution 6 in Galactic coordinates, with the “custom” Galaxy sky mask (Bennett et al. 1996), and with monopole and dipole contributions removed as in Tegmark & Bunn (1995). The resulting data set consists of temperatures for 3,881 pixels in the sky, which we arrange in a vector . We take the covariance matrix to be of the form , where the noise matrix is diagonal and the signal matrix is a Harrison-Zel’dovich power spectrum normalized to k (e.g., Bennett et al. 1996).
The pixelized data are both correlated and noisy, hence we subject the map to both a principal component analysis (PCA) and a signal-to-noise eigenmode analysis (SNA), two standard astrophysical tools. Both of these procedures involve expanding the data in a new basis, the eigenvectors of for the PCA case and the eigenvectors of for the SNA case. The eigenvectors are sorted by decreasing eigenvalue and normalized so that the expansion coefficients have unit variance. For the SNA (Bond 1994; Bunn & Sugiyama 1995; Tegmark et al. 1997), the modes are listed in order of decreasing signal-to-noise level. For the PCA, the modes explain successively less and less of the variance in the data. Since the DMR noise per pixel does not fluctuate much, the two methods give similar results. The first few hundred modes contain essentially all the cosmological information, and probe successively smaller angular scales (Bond 1994; Bunn & Sugiyama 1995; Bunn & White 1996). We use the top 250 modes for the Gaussianity tests described below.
The purpose of this exercise is two-fold: First, we can determine how many cosmologically significant degrees of freedom a given statistical test should consider. Second, the decomposition into uncorrelated eigenmodes allows the data to be cast as a list of random numbers which, under the null hypothesis that the DMR data are Gaussian444Note that as long as the true CMB sky is Gaussian, our data set will be Gaussian as well: Both the smoothing done by the DMR beam, our galaxy cut and our monopole and dipole removal are linear operations, and all linear operations preserve Gaussianity., will be independent and normally distributed. Although the statistics of these samples may not be completely testable in practice, we can still constrain general properties of the COBE data.
We run both the lists of 250 PCA and SNA entries and the entire list of 3877 numbers (the rank of the covariance matrix after monopole and dipole subtraction) from the PCA basis through a smattering of tests, first for Gaussianity of the individual list elements. The null hypothesis cleanly passes Kolmogorov-Smirnoff and -square tests, along with tests of cumulants up to fourth order and of the significance of the top few outliers. None of these tests manage to reject the Gaussian null hypothesis with 95% confidence. Note that these tests are sensitive only to the 1-point distribution of mode amplitudes, not to correlations between modes. This is strong though not irrefutable evidence that if the DMR data are non-Gaussian then mode correlations, not mode amplitudes, are responsible.
The next step in testing the Gaussian hypothesis is to look for mode correlations. This is a difficult thing to do in any exhaustive way, even for our short lists of 250 elements, and a thorough treatment of this problem is beyond the scope of this Letter. We note only that no correlations were detected above the 95% confidence level in tests of second, third and fourth order -point correlations. We also used mode amplitudes to simulate rolls of a die and examine the one- and two-point distributions of outcomes to see if the die is loaded. If one wishes to play dice with the Universe, evidently it would be a fair game.
3. Reports of Non-Gaussianity
The above tests of the COBE data (26 in all) join a sizable list of previous results without significant detections of non-Gaussianity. For the 53 GHz DMR 1 year data, the three-point function was studied by Luo (1994, one test) and Hinshaw et al. (1994, two tests) while Smoot et al. (1994) considered the topological genus and kurtosis (two tests). For the 53 and 90 GHz DMR 2 year data, Hinshaw et al. (1995) studied the equilateral and pseudocollapsed three-point function at three -cuts with 12 tests in total; the most extreme gave a 98% non-Gaussianity detection, but was deemed to suffer from a known noise problem. Kogut et al. (1996) tested the DMR 4 year data for three-point correlations, genus and peak correlations (4 tests in all), while Heavens (1998) analyzed this same data set using an optimized bispectrum statistic on 5 different scales. Gaztañaga et al. (1998) performed 5 variance-of-variance tests with the strongest rejection of Gaussianity being at the 91% level. Most recently, Diego et al. (1999) concluded that the DMR data were consistent with Gaussianity in a partition function analysis.
On the other hand, there are two Gaussianity tests which the data reportedly fail. One is based on the bispectrum statistic of FMG (at 98% confidence) and other on the fourth-order wavelet statistic proposed by PVF (at 99% confidence). These are strong signals of non-Gaussianity, but some caution is in order. Given that the DMR data have been subjected to the 32 other published tests cited above which provide no evidence of non-Gaussianity (not to mention the 26 reported here and any tests, including some of our own, which were not reported because they yielded null results), are the FMG and PVF results simply expected outliers in the distribution of test results?
To address this point, suppose we try to rule out some null hypothesis by subjecting a data set to independent statistical tests, and that the most successful one rules it out at a confidence level , say 99%. How significant is this really? Let denote the confidence level obtained from the test, with corresponding to the most successful test. The probability of getting a less extreme result is then
| (1) |
For example, the most extreme S/N eigenmode coefficient in Section 2 is a 3.3- outlier. If that one coefficient was all we had, then we would reject Gaussianity at the 99.9% level. However, we have 250 independent numbers and equation (1) shows that our level of confidence in rejection from that one extreme coefficient is only . Similarly, the list of 34 published Gaussianity tests mentioned above contains one which rules out the null hypothesis at the 99% level. If these tests were independent, we could reject Gaussianity with only confidence. Of course the tests are not strictly independent. Yet if some of them capture only subsets of the information contained in the COBE data points, then they may be effectively independent of each other. With this in mind we examine the FMG and PVF tests in more detail.
3.1. The wavelet test
The detection reported by PVF of a non-Gaussian signal is made with a measure of fourth-order correlations between wavelet coefficients of the DMR data. The coefficients are obtained using a discrete transform of the northern sixth of the sky map, after the spherical plane of the sky has been projected onto the face of a cube. Taken alone, this measure reportedly gives a detection of non-Gaussian signal at 99% confidence. But we have more information, even about PVF’s wavelets: a second projection of the sky map onto the opposite face of the cube (i.e., the opposite hemisphere of the sky) lies roughly at the 40% confidence level. Together, a joint two-faced wavelet analysis gives a weaker rejection of the Gaussian hypothesis, formally at 97% confidence. Furthermore, the PVF detection is claimed only for wavelets on one specific scale even though they seek similar detections on two other scales but do not find them. Likewise, a detection was sought but not found for third-order moments. With , equation (1) predicts a much lower confidence level, , for the claimed detection.
In an analysis based on compact but smooth wavelets (e.g., Bromley 1994), we confirm the existence of a strong (99.6%) non-Gaussian outlier at the 11∘+22∘ scales reported by PVF. Interestingly, we can make the entire non-Gaussian signal vanish by simply zeroing or flipping the sign of a single, modestly rare principal component amplitude (a 2.7- fluctuation of the 90th mode). Also the 17th eigenmodes from both the PCA and SNA strongly affect the wavelet detection. In the S/N basis, this mode has an amplitude of 2.1- (slightly less in the principal component vector); by zeroing the amplitude of these modes, the wavelet statistic yields less than a 2- detection. Furthermore, when set to zero, a single spot in the sky the size of the COBE beam (centered at , ), also cuts the non-Gaussian signal down to a similar level. Of the six pixels in this spot, three are within one standard deviation of the expected noise, while two are at the 2.6- level and the third is a strong outlier at 3.1-. (How this spot affects the PVF results depends on unspecified details of their analysis.)
3.2. The bispectrum test
FMG introduce a measure, , based on averaged triplets of projection coefficients from even-multipole spherical harmonics. Non-Gaussian behavior is seen only at , but FMG are careful to consider the fact that the bispectrum at eight other -values are individually consistent with the Gaussian hypothesis. The reported confidence of the non-Gaussian detection is 98%.
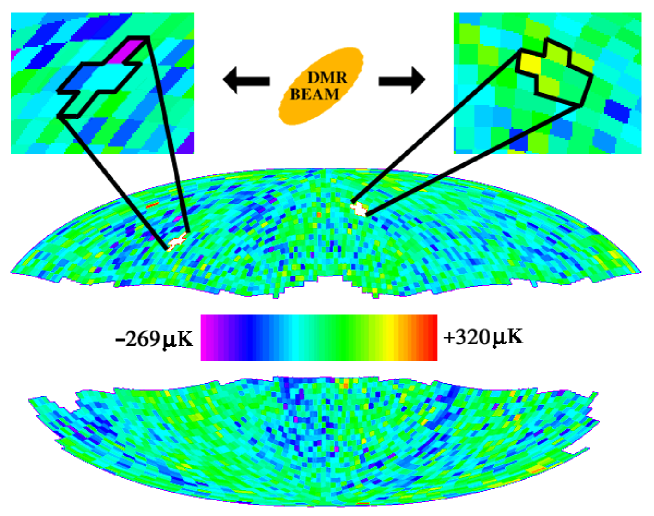
There is nonetheless a possibility that the nine values given by FMG are sensitive to only a fraction of the information in the COBE data. Although there is some spherical harmonic mode coupling as a result of the sky mask, the odd multipoles are largely missing as well as multipoles above . There may also be dependence on localized noise. We emphasize this latter point by setting to zero the five pixels in the beam-size spot on the sky centered at Galactic latitude and longitude , shown in Fig. 1. The value of falls from about 0.92 to 0.78, approximately a 98% detection on its own555Note that the effect of zeroing the spot depends somewhat on details of removing monopole and dipole contributions to the DMR maps. If explicit removal (e.g., Tegmark & Bunn 1995) is not performed on the custom cut map, as is apparently the case in the bispectrum analysis of Magueijo, Ferreira & Gorski (1999; Fig. 1 therein), then the effect of removing the spot (actually a nearest-neighbor) is to lower to 0.66., but well below 2- when taken in conjunction with the other eight values shown in Fig. 2 ( if the 9 values were uncorrelated). Note that there is a single, rare pixel brightness value in the spot. In units of the expected noise fluctuations, it is at the level of , and zeroing it alone cuts by 10%.

The bispectrum statistic is also highly sensitive to individual eigenmodes. Zeroing or flipping the sign of principal component 151 causes to drop from 0.92 to the unambiguously Gaussian values of 0.61 and 0.20, respectively. Furthermore, there is sensitivity to S/N eigenmode 224, a 3- fluctuation (the second most extreme of the first 250 modes) which is more strongly coupled to noise than cosmic structure (its S/N eigenvalue is 0.4). Zeroing this knocks to 0.74; flipping the sign causes the value to fall to 0.52, a decidedly Gaussian value. Since both of these eigenmodes are dominated by noise rather than cosmic signal, it is possible that the source of the alleged non-Gaussianity is detector noise rather than CMB.
Note that in the above analyses, we systematically searched for the modes or pixels which affected the wavelet and bispectrum statistics the most. In each case we found only a few which cause more than an insignificant (several percent) change in these measures, and interestingly the significant modes or pixels were different for the two measures. Using randomly generated Gaussian skymaps selected for apparent non-Gaussianity similar to the DMR data, we also checked that it is quite common for a Gaussian map to give a wavelet or bispectrum measure that is sensitive to only a few individual pixels or modes, just as in the DMR case.
4. Conclusion
The problem of the statistical nature of the CMB may be cast in a conceptually simple form: just use the observed temperature fluctuations to make a random number generator, based on assumed statistical properties, and test its quality. Here we have used the 53+90 GHz COBE sky map to generate lists of putative random numbers with principal components and signal-to-noise eigenmodes. In both cases the one-point distribution is manifestly Gaussian. If the CMB on COBE scales is non-Gaussian, it is the result of correlations between modes. Unfortunately, exhaustive tests of mode correlations are not feasible. A few tests which can pick up a fair range of non-Gaussian behavior were performed and no evidence of mode correlations was found.
Here we have also considered the two statistics which reportedly detect non-Gaussianity in the COBE data. Both detections turn out to be fragile in the sense that they vanish when a single DMR beam spot or a single eigenmode is removed. Moreover, we found that the detection by PVF, based on wavelets alone, was less significant than originally claimed. Even so, with the dozens of different Gaussianity tests that have now been published, it would not be surprising if a perfectly valid analysis rejected Gaussianity at say 98% confidence purely by accident.
Our results cast some doubt on the significance of the claimed non-Gaussian behavior in the CMB. If the reported detections are real nonetheless, then the eigenmodes and COBE-beam spots that we isolated for the wavelet and bispectrum statistics are candidates for potential non-Gaussian sources in the CMB. This latter possibility would perhaps be more satisfying if both measures were coupling to the same non-Gaussian structure in the sky. However, this is not obviously the case, since both the bispectrum statistic and the wavelet measure show virtually no sensitivity to the sky spots and eigenmodes which so dramatically affect the other.
It is generally much easier to show that a bad random number generator is bad then to prove that a good one is good. Indeed, the results reported here fail to demonstrate that the CMB really is Gaussian. Conversely, the search for non-Gaussianity is also something of an uphill battle, a fight against the central limit theorem which causes both instrumental effects and the linear combinations involved in the eigenmode expansions to make things look more Gaussian. Therefore statistical measures should be tuned for the specific type of non-Gaussianity that physical models predict. This approach is taken in many recent studies (e.g., Cayon & Smoot 1995; Magueijo 1995; Torres et al. 1995; Gangui 1996; Gangui & Mollerach 1996; Ferreira & Magueijo 1997; Ferreira et al. 1997; Barrieiro et al. 1998, Lewin et al. 1999; Popa 1998) with an eye toward upcoming, high-resolution CMB data.
We thank Angélica de Oliveira-Costa, Al Kogut, Alex Lewin, Bill Press, George Rybicki, and Nelson Beebe for useful comments. BCB acknowledges partial support from NSF Grant PHY 95-07695 and the use of supercomputing resources provided by NASA/JPL and Caltech/CACR. MT was funded by NASA though grant NAG5-6034 and Hubble Fellowship HF-01084.01-96A from STScI, operated by AURA, Inc. under NASA contract NAS5-26555.
REFERENCES
Avelino, P. P., Shellard, E. P. S., Wu, J. H. P., & Allen, B. 1998, ApJL, 507, L101
Barrieiro, R. B., Sanz, J. L., Martínez-González E, & Silk, J. 1998, MNRAS, 296, 693
Bennett, C. L. et al. 1996, ApJ, 464, L1
Bond, J. R. 1994, Phys. Rev. Lett., 74, 4369
Bromley, B. C. 1994, ApJ, 423, L81
Bunn, E. F., & Sugiyama, N. 1995, ApJ, 446, 49
Bunn, E. F., & White, M. 1995, ApJ, 480, 6
Cayon, L., & Smoot, G. F. 1995, ApJ, 452, 487
Diego, J. M., Martínez-González, E., Sanz, J. L., Mollerach, S. , & Martínez, V. 1999, MNRAS, 306, 427
Ferreira, P. G., & Magueijo, J. 1997, Phys. Rev. D, 55, 3358
Ferreira, P. G., Magueijo, J., & Gorski, K. M. 1998, ApJ, 503, 1 (“FMG”)
Ferreira, P. G., Magueijo, J., & Silk, J. 1997, Phys. Rev. D, 56, 4592
Gaztañaga, E., Fosalba, P., & Elizalde E 1998, MNRAS, 295, 30P
Gangui, A. 1996, Helv. Phys. Acta, 69, 215
Gangui, A., & Mollerach, S. 1996, Phys. Rev. D, 54, 4750
Hinshaw, G. et al. 1994, ApJ, 431, 1
Hinshaw, G. et al. 1995, ApJ, 446, L7
Kogut A et al. 1995, ApJL, 439, 29L
Kogut A et al. 1996, ApJL, 464, L29
Lewin, A., Albrecht, A., & Magueijo, J. 1999, MNRAS, 302, 131
Luo, X. 1994, Phys. Rev. D, 49, 3810
Magueijo, J., Ferreira, P. G., & Gorski, K. M. 1999, astro-ph/9903051
Magueijo, J. 1995, Phys. Rev. D, 52, 4361
Pando, J., Valls-Gabaud, D, & Fang., L.. 1998, Phys. Rev. Lett., 81, 4568 (“PVF”)
Popa, L. 1998, astro-ph/9806086
Peebles, P. J. E. 1999, ApJ, 510, 523
Pen U.-L., Seljak, U., & Turok, N. 1997, Phys. Rev. Lett., 79, 1611
Smoot, G. F. et al. 1992, ApJL, 396, L1
Smoot, G. F. et al. 1994, ApJ, 437, 1
Tegmark, M., & Bunn, E. F. 1995, ApJ, 455, 1
Tegmark, M., Taylor, A. N., & Heavens, A. F. 1997, ApJ, 480, 22
Torres, S. et al. 1995, MNRAS, 274, 853