Internal Kinematics of Blue CFRS Galaxies at 111Based on observations with the NASA/ESA Hubble Space Telescope obtained at the Space Telescope Science Institute, which is operated by the Association of Universities for Research in Astronomy, Inc., under NASA contract NAS 5-26555.
Abstract
We present the results of a study of the internal kinematics of luminous starforming galaxies in the range, with the aim of investigating the nature of the blue galaxies which cause the largest changes in the luminosity function at . New kinematic data are analysed for a sample of 24 galaxies from the Canada-France Redshift Survey, most of them with rest-frame Unlike most previous studies, target galaxies were selected regardless of size and morphology, from a well-studied magnitude-limited survey (the CFRS). Our sample is therefore representative of the most rapidly changing of the galaxy population in the range. The 15 galaxies at have sizes (from HST images) and velocity widths (from emission lines) similar to those of typical local Irregulars. This is consistent with their morphologies and rest-frame colors; however, these galaxies are as bright as the brightest local Irregulars, and roughly 2 magnitudes brighter than typical Irregulars known nearby. We conclude that the increase in the number density of luminous blue galaxies at is mainly due to a population of small and unusually-bright late-type galaxies.
keywords:
galaxies: evolution — galaxies: fundamental parameters — galaxies: kinematics and dynamics1 INTRODUCTION
In recent years, redshift surveys have enabled us to construct the optical luminosity function (LF) for normal field galaxies up to , and there is now general agreement that the comoving density of actively starforming galaxies was higher in the past (e.g. Lilly et al. (1995); Ellis et al. (1996); Cowie et al. (1996)). The luminosity function, however, is only a statistical description of the galaxy population, and additional information on the nature of individual galaxies is needed in order to understand the causes of any changes seen in the LF.
The internal kinematics of a galaxy are closely related to its mass, and can help place constraints on the kind of galaxy that is being observed; in particular, different types of galaxies show characteristic scaling relations of size and velocity width , or rotation velocity . In principle, these scaling relations provide clues about the nature of a galaxy independently of any changes in luminosity or morphology that may be caused by bursts of star formation.
The internal kinematics of distant galaxies can most readily be studied via optical emission lines, such as H or the [OII] 3727Å line, and in recent years several kinematic studies of faint galaxies have been published (e.g. Koo et al. (1995); Guzmán et al. 1996, 1997, 1998; Forbes et al. (1996); Vogt et al. 1996, 1997; Rix et al. (1997); Phillips et al. (1997); Simard & Pritchet (1998)). Some of these groups report significant evolution at even moderate redshifts, while others find little or no evolution to . However, sample selection criteria varied widely, so these apparent discrepancies could potentially be reconciled if evolution is not uniform for all types of galaxies.
We have undertaken a kinematic study of a sample of starforming galaxies selected from the Canada-France Redshift Survey (CFRS) for which we have Hubble Space Telescope (HST) images. Our aim was to look at the general starforming galaxy population at , where changes in the blue LF are clearly evident. Our sample was selected regardless of galaxy size or morphology, and is representative of the bluest of the galaxies in the CFRS.
The sample is described in §2, the extraction of velocities is discussed in §3, and the results from our study are presented in §4. The main conclusions are summarized in §5. Throughout this paper, we have adopted and .
2 THE SAMPLE AND OBSERVATIONS
New spectroscopic observations were undertaken with the Subarcsecond Imaging Spectrograph (SIS) at the Canada-France-Hawaii Telescope (CFHT) on 1998 June 21-25, 1996 April 20-23, and 1995 October 27-30. The SIS is equipped with an active guiding system, yielding a typical PSF of 0.5-0.7” FWHM. Effective slit widths were typically 0.5-0.8”, and resolutions (FWHM of arc lines) were in the range 1.2-4.1 Å.
Target galaxies were selected from the subset of the CFRS which has been imaged by HST (see Brinchmann et al. (1998) and references therein). Based on the HST images, we constructed multi-object masks in which slits were aligned along the major axis of each galaxy. Slits were placed over every available known galaxy regardless of its size or morphology, but with preference given to galaxies with strong emission lines. Objects with unreliable spectra (e.g. a bad column, too close to the edge of the slit) were removed from the sample.
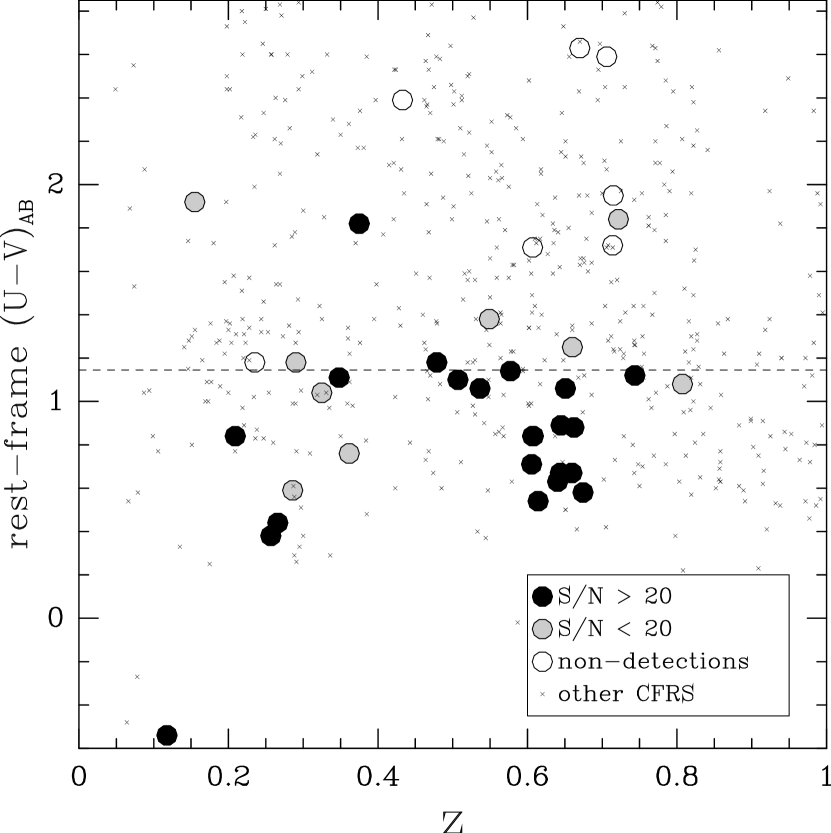
The sample selection is illustrated in Figure 1, which shows a plot of rest-frame vs. for our sample (large symbols) and other CFRS galaxies (small crosses). The 30 galaxies for which we were able to measure the velocity width of their emission lines (large filled symbols) were generally blue. We successfully measured for every observed galaxy with rest-frame (dotted line), which is roughly the color of a local Scd galaxy (Coleman et al. (1980)). The typical [OII] 3727Å rest-frame equivalent width for the blue galaxies is 60 Å, as compared to 40 Å at . The sample has the same magnitude limit as the CFRS; thus, our kinematic sample represents the bluest of the CFRS galaxies, which is precisely the population that shows the strongest evolution in the luminosity function to (Lilly et al. (1995)).
3 EXTRACTION OF VELOCITIES
We chose the velocity width to characterize the kinematics, since (a) the nature of galaxies in our sample was not known a priori, and is a general parameter which applies to both ordered rotation and random motions, (b) many galaxies at high were too small to reliably measure rotation curves, and (c) summing all the light increased the signal-to-noise ratio (S/N) in our spectra. Similarly, we chose the half-light radius r1/2 to characterize galaxy sizes, since it is a general parameter that applies to galaxies with any light profile. Half-light radii were derived from two-dimensional modeled fits to the HST images, and account for the effects of the PSF (see section 6 of Lilly et al. (1998)).
Internal velocities were measured from the [OII] 3727Å doublet for galaxies at , and from [OIII] 5007Å or H for those at . Emission lines were fit by Gaussians, using the fit/deblending option within the splot task in IRAF, yielding an observed velocity width FWHM. Gaussian fits to calibration and sky lines were used to obtain an instrumental resolution width for each spectrum, and the velocity width was then computed for each object. Error bars reflect the uncertainties of the Gaussian fits and the effects of poor sampling and non-Gaussian slit profiles (based on simulations).
A detailed analysis of the potential systematic errors will be presented in Mallén-Ornelas et al. (1999) but the main issues are addressed here. One concern is that the emission line used for the kinematic measurements may be coming from a small region of the galaxy, and thus yield an underestimate of the true velocity width. We compared the spatial extent of the emission line on the 2-d spectrogram and found it was consistent with the size of the continuum in every case except one. This discrepant galaxy was one of the three which showed morphological evidence for a merger, and it indeed had a very large velocity width; the three galaxies with merger morphology have been omitted from the analysis below.
Another possible concern is the effect of galaxy inclination on the measured projected velocities. The three face-on galaxies in our sample (axial ratios in the range ) have been omitted from the velocity analysis, since in addition to the projection effects on the measured velocity, there is considerable uncertainty in placing the slit along the kinematic major axis of the galaxy. Slit orientation should not have a significant effect on the rest of the sample, since slits were oriented along the major axis of each galaxy, as measured from HST images. Finally, there is little worry that we have a detection bias against galaxies with large internal velocities, since we have measured for a complete magnitude-limited sample of galaxies with rest-frame . After the three mergers and the three face-on galaxies were removed, we were left with a sample of 24 galaxies to be used in the analysis.
4 RESULTS
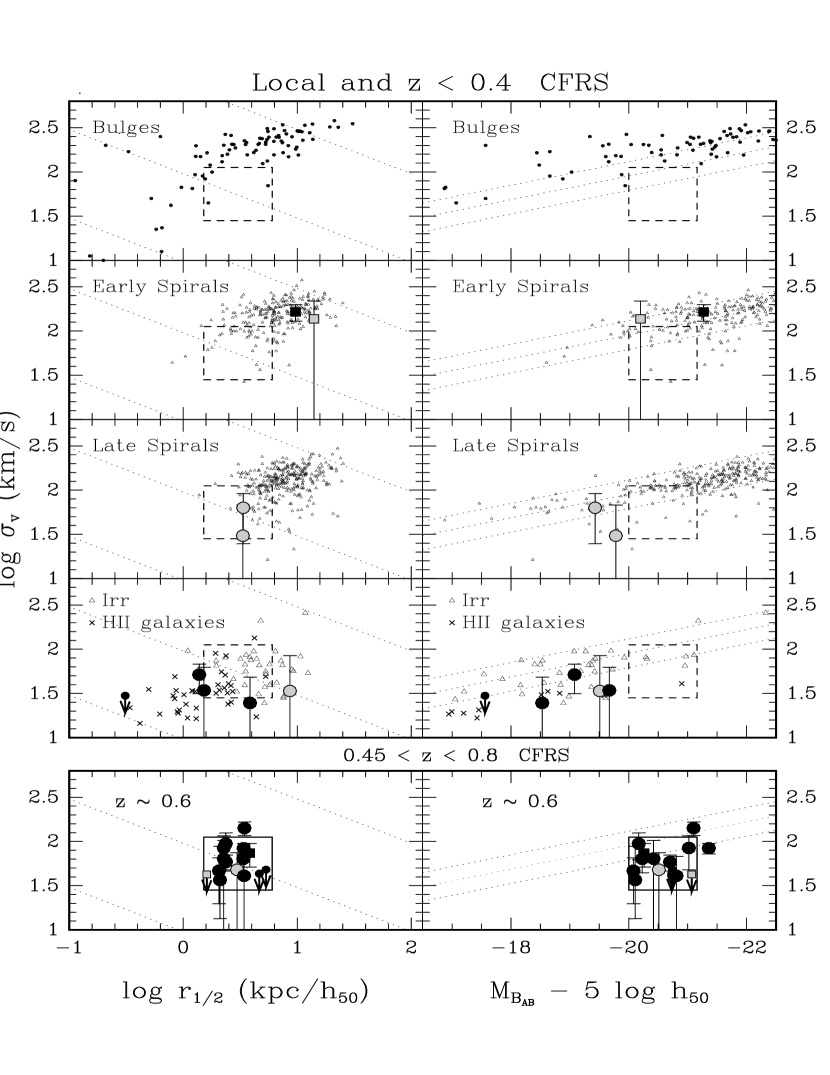
Galaxies in our sample were examined by comparing their kinematics (), sizes () and luminosities () with those of various types of local galaxies. Figure 2 shows vs. and vs. for samples of local galaxies (top 8 panels, small symbols), CFRS galaxies at (top 8 panels, large symbols), and CFRS galaxies at (bottom 2 panels). Data for local bulges are from Bender et al. (1992), and data for HII galaxies are from Telles & Terlevich (1997) and Telles, Melnick, & Terlevich (1997). Data for Spiral and Irregular galaxies are from the Third Reference Catalogue of Bright Galaxies (de Vaucouleurs et al. (1991), hereafter RC3). For this last data set, we took . As with the CFRS sample, local face-on Spirals and Irregulars () were omitted, but no other inclination correction was made.
The CFRS galaxies were classified morphologically from their HST images, and are plotted in the corresponding panels. On the vs. diagram (left panels), most CFRS galaxies lie within the loci defined by local galaxies of the same morphological class. The vs. plots (right panels) show that these galaxies have luminosities similar to those of local galaxies of similar morphological type and kinematics, but those classified as Late Spirals or Irregulars are generally on the brighter side of the locus. However, we will not explicitly translate this into a change in luminosity (or density) since (a) neither our CFRS sample nor our local comparison sample are complete for the fainter magnitudes, so it is impossible to compute a shift in luminosity between the two populations, and (b) our blue sample is quite small, the velocity widths have large error bars, and many of these widths were measured on the [OIII] 5007 Å line, which may lead to poorly understood systematic errors. Thus, the amount of any evolution required in the population is uncertain.
The CFRS galaxies (with median ) have Irregular or late Spiral morphologies, and are plotted separately in the bottom two panels. These galaxies lie in a small region of (, , )-space, with typical values of km/s,kpc, and log. This region is outlined with a box which is reproduced in the upper 8 panels. The small range in comes from the fact that the original CFRS was a magnitude-limited sample.
An object’s location in the vs. plane is in principle independent of luminosity evolution and can serve to identify possible local counterparts of the population. As can be seen from the left-hand panels of Figure 2, the sizes and kinematics of the CFRS galaxies are similar to those of typical Irregulars in the RC3. This is consistent with their morphologies as seen in HST images (Brinchmann et al. (1998)) and their blue rest-frame colors. However, one can see on the vs. panel (on the right) that only the brightest local Irregulars are as bright as the galaxies, and a typical local Irregular with similar size and kinematics is 2 magnitudes dimmer. Note that changing the cosmology to one of lower would not significantly alter our result (e.g. adopting would make the galaxies 12% larger and 0.25 mag brighter).
Thus, when we look at the galaxies with blue colors and that are producing the largest changes in the galaxian luminosity function to (Lilly et al. (1995)), we find galaxies that have the colors, morphologies, sizes, and kinematics of typical Irregular galaxies in the present-day Universe, but which are 2 mag brighter than the average Irregular galaxy seen nearby. There are, however, some bright Irregulars nearby (e.g. NGC 5464, NGC 4194, NGC 3239 and Mrk 330) that have same , , and as the high-redshift galaxies.
Determining the average evolutionary change in luminosity () is almost impossible from a magnitude-limited sample such as the one used here — and in all other studies — unless one can claim to be “complete” in some class of galaxy (c.f. the discussion of “big disks” in Lilly et al. (1998)); otherwise, it is impossible to talk about the change in luminosity for a given class of galaxies, when we cannot see the fainter members of the class. Thus, our size and kinematic data for blue galaxies at are consistent with either (a) a luminosity evolution mag to , or (b) a density enhancement by a factor of (based on the LF) and no change in luminosity, or (c) a combination of both luminosity and density evolution.
A full comparison with other kinematic data in the literature will be presented in Mallén-Ornelas et al. (1999), but it should be noted here that the amount of luminosity evolution inferred by different authors strongly depends on the local sample used for comparisons. In particular, we stress that the Tully-Fisher relation as defined by spiral galaxies is not necessarily the most appropriate comparison for small galaxies with low masses, as seen at high redshift, regardless of their luminosities. Furthermore, as long as one is sampling a small range of magnitudes, it is impossible to tell whether what is usually interpreted as luminosity evolution of the observed galaxies, is not in fact caused by an increase in the density of a larger population, of which we are only seeing the brightest members. Finally, one must be cautious in assuming that the sizes of individual galaxies remain constant between and the present epoch, since hierarchical merging scenarios predict that galaxies are still growing at these redshifts (e.g. Mao, Mo, & White (1998)).
Our results are consistent with the studies of compact galaxies by Guzmán et al. (1996, 1997, 1998) and Phillips et al. (1997) who found that small galaxies at had high rates of star formation, and provided a large contribution to the evolution of the blue population to . Of the 15 blue galaxies in our sample, 12 meet the Guzmán/Phillips size and magnitude selection criteria, so it is not surprising that we have reached similar conclusions. It should be emphasized that our results do not disagree with those of Vogt et al. (1996, 1997), who found little or no evolution from rotation curves of a sample of large disk galaxies. The blue population, studied here is made up of small galaxies which would not be included in the Vogt et al. sample (see discussion in Lilly et al. (1998)).
Although the current generation of kinematic studies is a start, untangling the physical processes responsible for the evolution of the galaxy population will ultimately require detailed physical information (including masses) from large samples of galaxies, extending so far down the luminosity function that the serious limitations of magnitude-limited samples are overcome.
5 SUMMARY
We have measured the internal kinematics of a sample of blue CFRS galaxies [rest-frame ] for which we have HST images, and have found the following:
1. Luminous blue galaxies at are generally small, have late Spiral or Irregular morphology, and have kinematics and sizes consistent with those of local Irregulars or large HII galaxies, but they are as bright as the brightest local Irregulars, and roughly 2 magnitudes brighter than typical Irregulars nearby.
2. The major contribution to the evolution of blue L∗ galaxies to comes from a population of strongly evolving small blue galaxies of mass and morphology similar to that of present-day Irregulars.
Acknowledgements.
We thank M. Sawicki and S. Courteau for useful suggestions. This research has been supported by the North Atlantic Treaty Organization and the Natural Sciences and Engineering Research Council of Canada. SJL is a fellow of the Canadian Institute for Advanced Research.References
- Bender et al. (1992) Bender, R., Burstein, D., Faber, S. M. 1992, ApJ, 399, 462
- Brinchmann et al. (1998) Brinchmann, J., Abraham, R., Schade, D., Tresse, L., Ellis, R. S., Lilly, S. J., Le Fèvre, O., Glazebrook, K., Hammer, F., Colless, M., Crampton, D., Broadhurst, T. 1998, ApJ, 499, 112
- de Vaucouleurs et al. (1991) de Vaucouleurs, G., de Vaucouleurs, A., Corwin, H. G., Buta, R. J., Paturel, G., Fouque, P. 1991, Third Reference Catalogue of Bright Galaxies (New York: Springer-Verlag)
- Coleman et al. (1980) Coleman, G. D., Wu, C. -C., Weedman, D. W. 1980, ApJS, 43, 393
- Cowie et al. (1996) Cowie, L. L., Songaila, A., Hu, E. M., Cohen, J. G. 1996, AJ, 112, 839
- Ellis et al. (1996) Ellis, R. S., Colless, M., Broadhurst, T., Heyl, J., Glazebrook, K. 1996, MNRAS, 280, 235
- Forbes et al. (1996) Forbes, D. A., Phillips, A. C., Koo, D. C., Illingworth, G. D. 1996, ApJ, 462, 89
- Guzmán et al. (1996) Guzmán, R., Koo, D. C., Faber, S. M., Illingworth, G. D., Takamiya, M., Kron, R. G., Bershady, M. A. 1996, ApJ, 460, L5
- Guzmán et al. (1997) Guzmán, R., Gallego, J., Koo, D. C., Phillips, A. C., Lowenthal, J. D., Faber, S. M., Illingworth, G. D., Vogt, N. P. 1997, ApJ, 489, 559
- Guzmán et al. (1998) Guzmán, R., Jangren, A., Koo, D. C., Bershady, M. A., Simard, L. 1998, ApJ, 495, L13
- Koo et al. (1995) Koo, D. C., Guzmán, R., Faber, S. M., Illingworth, G. D., Bershady, M. A., Kron, R. G., Takamiya, M. 1995, ApJ, 440, L49
- Lilly et al. (1995) Lilly, S. J., Tresse, L., Hammer, F., Crampton, D., Le Fèvre, O. 1995, ApJ, 455, 108
- Lilly et al. (1998) Lilly, S. J., Schade, D., Ellis, R. S., Le Fèvre, O., Brinchmann, J., Abraham, R., Tresse, L., Hammer, F., Crampton, D., Colless, M., Glazebrook, K., Mallén-Ornelas, G., Broadhurst, T. 1998, ApJ, 500, 75
- Mallén-Ornelas et al. (1999) Mallén-Ornelas, G., Lilly, S. J., Crampton, D., Schade, D., 1999, in preparation
- Mao, Mo, & White (1998) Mao, S., Mo, H. J., White, S. D. M. 1998, MNRAS, 297, L71
- Phillips et al. (1997) Phillips, A. C., Guzmán, R., Gallego, J., Koo, D. C., Lowenthal, J. D., Vogt, N. P., Faber, S. M., Illingworth, G. D. 1997, ApJ, 489, 543
- Rix et al. (1997) Rix, H. -W., Guhathakurta, P., Colless, M., Ing, K. 1997, MNRAS, 285, 779
- Simard & Pritchet (1998) Simard, L., and Pritchet, C. J. 1998, ApJ, 505, 96
- Telles & Terlevich (1997) Telles, E., and Terlevich, R. 1997, MNRAS, 286, 183
- Telles, Melnick, & Terlevich (1997) Telles, E., Melnick, J., Terlevich, R. 1997, MNRAS, 288, 78
- Vogt et al. (1996) Vogt, N. P., Forbes, D. A., Phillips, A. C., Gronwall, C., Faber, S. M., Illingworth, G. D., Koo, D. C. 1996, ApJ, 465, L15
- Vogt et al. (1997) Vogt, N. P., Phillips, A. C., Faber, S. M., Gallego, J., Gronwall, C., Guzmán, R., Illingworth, G. D., Koo, D. C., Lowenthal, J. D. 1997, ApJ, 479, L121