A 98% spectroscopically complete sample of the most powerful equatorial radio sources at 408 MHz
Abstract
A new sample of very powerful radio galaxies is defined from the Molonglo Reference Catalogue, according to the criteria Jy, and . The sample is selected to have similar properties to the northern 3CR revised sample, and to be visible to a combination of existing northern telescopes such as the Very Large Array radio interferometer and large southern hemisphere telescope facilities. The sample contains 178 sources, of which spectroscopic redshifts are available in the literature for 128. For the remaining 50 sources, new radio imaging, optical imaging and spectroscopic observations are presented to identify the host galaxies and determine their redshifts. With these new observations the total sample is 100% optically identified and redshifts are available for 174 (98%) of the sources. The sample consists of one starburst galaxy, one Seyfert galaxy, 127 radio galaxies and 49 quasars. Basic properties of the sample, such as the distributions of the quasar and radio galaxy populations in redshift and their locations on the radio power versus linear size () diagram, show no significant differences from the revised 3CR sample. The equatorial location and the high spectroscopic completeness of this sample make it a valuable resource for detailed studies of the nature and environments of these important objects with the new generation of southern hemisphere telescopes.
keywords:
Galaxies: active — Radio continuum: galaxies — Galaxies: distances and redshifts — Catalogues — quasars: emission lines1 Introduction
Radio sources are unique cosmological probes, with importance for understanding the physics of active galactic nuclei, for studying the relationship between the radio source and its surrounding environment, for probing high redshift proto–cluster environments, and for defining complete samples of galaxies for studies of stellar populations at early epochs. The revised 3CR sample (Laing, Riley & Longair 1983; hereafter LRL) contains the brightest extragalactic radio sources in the northern sky selected at 178 MHz; the host galaxies of these radio sources are predominantly giant elliptical galaxies and lie at redshifts out to . Scientifically, the revised 3CR sample has proven exceedingly powerful since it is 100% spectroscopically complete, avoiding many selection biases inherent in less complete samples, and has become established as the standard sample of bright low frequency selected radio sources. The 3CR galaxies and quasars have been the subject of extensive studies over a wide range of wavelengths leading to many important discoveries, not least of which were the very tight relationship between the infrared K–magnitudes and the redshifts of the radio galaxies (e.g. Lilly and Longair 1984), the discovery that the optical and ultraviolet emission of the high redshift () radio galaxies is elongated and aligned along the direction of the radio axis [1987], and the orientation–based unification schemes of radio galaxies and radio loud quasars (e.g. Barthel 1989).
The new generation of large optical telescopes provides an exciting new opportunity for very detailed studies of these important objects and their environments, as has been proven by the results being produced by the Keck telescope (e.g. Cimatti et al. 1996, Dey et al. 1997, Dickinson 1997). Radio astronomy has, however, historically been concentrated in the northern hemisphere, and there is currently no large, spectroscopically complete sample of low frequency selected radio sources equivalent to the 3CR sample for studies with southern hemisphere telescopes such as the VLT and Gemini South. The current paper aims to rectify this deficiency.
The layout of the paper is as follows. In Section 2 the selection criteria of the new sample are described. Details of the observations that were carried out to provide optical identifications and spectroscopic redshifts for those sources for which such data could not be found in the literature are provided in Section 3. In Section 4, the results of these observations are provided in the form of radio maps, optical images and spectra of these sources. Tabulated details of the resulting complete sample are compiled in Section 5 and global properties of the sample are investigated. Conclusions are summarised in Section 6. Values for the cosmological parameters of and km s -1 Mpc-1 are assumed throughout the paper.
2 Sample Definition
The basis dataset for our sample was the Molonglo Reference Catalogue (MRC; Large et al. 1981), a catalogue of radio sources selected at 408 MHz in the region of sky , , and essentially complete down to a flux density limit of 1.0 Jy at that frequency. The low frequency selection criterion of this catalogue, like that of the 3CR sample (178 MHz), selects radio sources primarily on the relatively steep spectrum synchrotron emission of their extended radio lobes, rather than on flat spectrum cores, jets and hotspots, and is therefore less subject to Doppler boosting effects than samples selected at higher radio frequencies.
The sample (hereafter the BRL sample) was drawn from the MRC according to four criteria:
-
•
They must have a flux density Jy.
-
•
They must lie in the region of sky .
-
•
They must lie away from the galactic plane, .
-
•
They must be associated with extragalactic hosts.
The first selection criterion is similar to the flux density limit of the revised 3CR sample (LRL), Jy, for a typical radio source with a radio spectral index (). The second criterion was made so that the sample would be visible from both northern radio telescopes such as the VLA and southern hemisphere telescopes such as the new large optical telescopes (VLT, Gemini South) and the proposed Atacama Large Millimetre Array (ALMA). The third criterion rejects most galactic objects and avoids the regions of highest galactic extinction.
The first three selection criteria produced a sample of 183 entries in the Molonglo Reference Catalogue. Of these, 0532054 (M42, Orion) and 0539019 were excluded on the basis of being galactic HII regions. 0634204 and 0634206 appear as two separate entries in the MRC catalogue, whereas they are in fact two parts of the same giant radio source [1988]; these two entries were therefore merged as 0634205. Similarly, the entries 1216+061A and 1216+061B are from the same source, hereafter referred to as 1216+061 (e.g. see Formalont 1971). Finally, the single catalogue entry 2126+073 (3C435) is actually composed of two individual radio sources [1989] neither of which on its own is luminous enough to make it into the sample, and so these were excluded. 0255+058 (3C75) is also composed of two distinct sources, although overlapping and inseparable in terms of flux density [1985], but this entry is maintained within the sample since at least one of the two sources must be sufficiently luminous that it would have entered the sample on its own. These considerations led to a final BRL sample of 178 sources.
Selected in this way the sample is complementary to many other radio source samples which have been constructed or are under construction. The northern declination limit of +10∘ corresponds to the southern declination limit of the LRL sample. Bright sources more southerly than the declination limit will be included in a new southern sample being prepared by Hunstead and collaborators. Between these three samples, therefore, almost the entire sky (away from the galactic plane) will be covered. The BRL sample further complements the MRC strip 1 Jansky sample defined by McCarthy and collaborators (e.g. McCarthy et al. 1996); the MRC strip, also composed of southern radio sources from the MRC catalogue, is selected to be about a factor of five lower in radio power than our sample and is currently spectroscopically complete. Due to its larger sky coverage, the BRL sample provides almost a factor of 5 more radio sources at the highest flux densities than the MRC strip, which is essential to provide large enough numbers of the rare high power objects for studies of, for example, the alignment effect or their clustering environments at high redshifts. Combining the BRL sample and the MRC strip will allow variations with radio power to be investigated. Finally, the new sample provides a complement to samples selected at high radio frequencies, such as that of Wall and Peacock [1985], which contain far larger fractions of flat spectrum sources and quasars than low frequency selected samples, due to Doppler boosting effects. The Wall and Peacock sample covers the whole sky away from the galactic plane (), contains 233 sources brighter than 2 Jy at 2.7 GHz, and in the region of sky is over 90% spectroscopically complete (e.g. di Serego Alighieri et al. 1994).
3 Observations and Data Reduction
A literature search showed that spectroscopic redshifts were already available for 128 of the 178 sources in the sample. Our observations concentrated upon the remaining 50 sources, with the goal of producing a spectroscopically complete sample.
3.1 Radio Imaging
The angular resolution of the observations comprising the Molonglo Reference Catalogue is only about 160 arcseconds in right ascension and in declination varies from about 170 arcseconds at to 240 arcseconds at . In general these positional uncertainties are too great to allow unambiguous identification of the host radio galaxy or quasar; higher resolution radio data are essential.
Radio data with angular resolution of about 10 arcseconds or less were extracted from the VLA archive for 27 of the 50 radio sources without spectroscopic redshifts. Details of the array configurations and frequencies of these archive data are provided in Table 1. For the remaining 23 sources new observations were made using the VLA during filler time in September 1997 and June 1998 (see Table 1). These observations were single snapshot exposures of typically 5–minute duration. Either 3C286 or 3C48 was observed during each run for primary flux calibration, and accurate phase calibration was achieved by observations of secondary calibrators within 10–15 degrees of the radio galaxies.
Both the new data and that extracted from the archive were calibrated, cleaned, and further self–calibrated within the aips package provided by the National Radio Astronomy Observatory following standard reduction procedures. The resultant radio maps are shown in Figures 1 to 50.
3.2 3.6m EFOSC2 observations
The optical imaging and spectroscopic observations were carried out predominantly during two observing runs at the ESO 3.6m telescope, La Silla, on 21-22 April 1998 and 20-21 November 1998. The EFOSC2 instrument was used together with the 2048 by 2048 Loral CCD #40 which, after binning 2 by 2 pixels on read-out, provided a spatial scale of 0.315 arcsec per binned pixel. The spectroscopic observations were taken through a 2 arcsecond slit using the grism #6 which provided a wavelength coverage from 3860 to 8070Å, a scale of 4.1Å per binned pixel and a spectral resolution of about 22Å.
The observing technique used was to make first a short image of the field of the radio source through the –Bessel filter and use the VLA radio map to identify the host galaxy or quasar. The telescope was then moved to centre this object in the slit and a spectrum taken. The spectral slit position angle was left in the default east–west direction unless there was good reason to do otherwise, for example if there were two candidate host objects in which case they were both placed along the slit. The duration of the spectral exposure was of between 5 and 20 minutes, depending roughly upon the magnitude of the host object in the –band observation. A second exposure was then begun whilst the first was being reduced. If emission lines were easily visible in the first spectrum then the second exposure was cut short or aborted. Details of the observations are given in Table 1.
Both the imaging and spectroscopic data were reduced using standard packages within the iraf noao reduction software. For the imaging observations the bias level and dark current were first subtracted and then the images were flat–fielded using a flat–field constructed from all of the imaging observations. Photometry was achieved using regular observations of photometric standards throughout the nights.
The raw spectroscopic data frames were bias subtracted, and then flat–fielded using observations of internal calibration lamps taken with the same instrumental set-up as the object exposures. The sky background was removed, taking care not to include extended line emission in the sky bands, and then the different exposures of each galaxy were combined, where appropriate, and cosmic ray events removed. One dimensional spectra were extracted and were wavelength calibrated using observations of CuNe and CuAr arc lamps. Flux calibration was achieved using observations of the spectrophotometric standard stars GD108, G60-54 and LDS749B for the April run, and Feige-24 and L745-46A in November, and the determined fluxes were corrected for airmass extinction.
3.3 WHT observations
Observations of 7 of the sources were made using LDSS2 on the William Herschel Telescope as a backup programme during the first half of the night of 13 August 1998. LDSS2 was used together with a SITe1 2048 by 2048 CCD, providing 0.594 arcseconds per pixel. Imaging observations were made using the broadband Harris-R filter. Spectroscopic observations were taken using the standard long slit with a projected size of 1.4 by 225 arcseconds, and the ‘medium-blue’ grism, providing a scale of 5.3Å per pixel and a spectral resolution of about 13Å.
Spectroscopic observations of the sources 1643223 and 1920077 were made using the duel–beam ISIS spectrograph on the William Herschel Telescope during morning twilights of 20 and 21 March 1999 respectively. In the blue arm of the spectrograph the R158B grating was used together with a 2096 by 4200 EEV CCD, providing a spectral coverage from the atmospheric cutoff through to longward of the dichroic at 5400Å, and a spectral resolution of 11Å. In the red arm the R316R grating was used together with a 1024 by 1024 Tek CCD, providing a spectral resolution of about 5Å and a spectral range of 1525Å. This range was centred on 7919Å for 1643223 and 8245Å for 1920077.
Details of the observations are given in Table 1. The procedures for both the observations and the reduction of the LDSS2 data and the ISIS data mirrored those described for the EFOSC2 observations, except that the default spectral slit orientation for the LDSS data was north–south. Kopff 27 was used for spectrophotometric calibration of the LDSS data, and g19374 for the ISIS data.
| Source | ……………..Radio…………….. | …………………Optical Imaging………………… | ………………..Spectroscopy……………….. | Notesa | |||||||||
| Obs. Date | Array | Freq. | Runb | Exp. Time | –magnitude | ID | Slit PA | Exp. Time | |||||
| [GHz] | No. | [s] | 4′′ | 63.9kpcc | [deg] | [s] | |||||||
| 0016129 | 19/06/98 | BnA | 5 | 3 | 180 | 22.81 | 22.68 | RG | 0 | 1500 | 1.589 | 0.001 | |
| 0056172 | Archive | BnA | 1.4 | 3 | 60 | 21.11 | — | RG | 315 | 900 | 1.019 | 0.002 | N |
| 0101128 | 19/06/98 | BnA | 5 | 3 | 60 | 20.05 | — | RG | 0 | 420 | 0.387 | 0.001 | |
| 0125143 | 19/06/98 | BnA | 5 | 3 | 60 | 19.14 | 18.67 | RG | 270 | 800 | 0.372 | 0.001 | N |
| 0128264 | Archive | A | 1.4 | 3 | 180 | 22.58 | 22.19 | RG | 270 | 1350 | 2.348 | 0.003 | N |
| 0132+079 | Archive | A | 5 | 3 | 60 | 20.16 | 19.79 | RG | 0 | 600 | 0.499 | 0.001 | |
| 0219+082 | 19/06/98 | BnA | 5 | 3 | 60 | 18.63 | 17.98 | RG | 270 | 300 | 0.266 | 0.001 | |
| 0310150 | Archive | B | 1.4 | 3 | 240 | 21.74 | 21.71 | RG | 270 | 1140 | 1.769 | 0.003 | |
| 0357163 | 19/06/98 | BnA | 5 | 3 | 180 | 20.56 | 20.40 | RG | 270 | 900 | 0.584 | 0.002 | N |
| 0406180 | Archive | BnA | 1.4 | 3 | 120 | 19.21 | 19.12 | Q | 270 | 900 | 0.722 | 0.001 | |
| 0519208 | Archive | BnA | 5 | 3 | 240 | 21.91 | 21.80 | RG | 270 | 840 | 1.086 | 0.002 | |
| 0850206 | Archive | B | 1.4 | 1 | 300 | 22.07 | 21.93 | RG | 270 | 2400 | 1.337 | 0.002 | N |
| 0851142 | 17/09/97 | C | 8 | 1 | 300 | 22.63 | 22.41 | RG | 270 | 2400 | 1.665 | 0.002 | |
| 1039+029 | Archive | A | 5 | 1 | 300 | 21.27 | 20.96 | RG | 270 | 1800 | 0.535 | 0.002 | N |
| 1059010 | 17/09/97 | C | 8 | 1/3 | 300 | 24.20 | — | RG | 270 | 1800 | — | — | N |
| 1131171 | 17/09/97 | C | 8 | 1 | 300 | 19.01 | 19.01 | Q | 270 | 1200 | 1.618 | 0.002 | N |
| 1138+015 | Archive | A | 5 | 1 | 300 | 20.03 | 19.48 | RG | 270 | 900 | 0.443 | 0.002 | |
| 1140114 | Archive | A | 1.4 | 1 | 300 | 23.01 | 22.95 | RG | 270 | 2400 | 1.935 | 0.001 | |
| 1303+091 | Archive | A | 5 | 1 | 300 | 22.12 | 22.16 | RG | 270 | 2400 | 1.409 | 0.002 | |
| 1307+000 | Archive | C | 5 | 1 | 300 | 19.56 | — | RG | 270 | 900 | 0.419 | 0.001 | |
| 1344078 | Archive | B | 1.4 | 1 | 300 | 19.73 | 19.30 | RG | 270 | 900 | 0.384 | 0.002 | N |
| 1354+013 | Archive | A | 5 | 1 | 300 | 21.79 | 21.44 | RG | 270 | 1200 | 0.819 | 0.001 | |
| 1411057 | 17/09/97 | C | 8 | 1 | 300 | 22.39 | 22.23 | RG | 270 | 2400 | 1.094 | 0.002 | |
| 1413215 | 29/06/98 | BnA | 5 | 1 | 300 | 22.67 | — | RG | — | — | — | — | N |
| 1422297 | Archive | B | 1.4 | 1 | 300 | 22.55 | 22.50 | RG | 270 | 1650 | 1.632 | 0.001 | N |
| 1434+036 | Archive | A | 5 | 1 | 300 | 21.49 | 21.53 | Q | 270 | 1650 | 1.438 | 0.001 | N |
| 1436167 | Archive | B | 1.4 | 1 | 30 | 17.31 | 16.26 | RG | 270 | 240 | 0.146 | 0.001 | |
| 1509+015 | Archive | A | 5 | 1 | 300 | 21.61 | 21.25 | RG | 270 | 900 | 0.792 | 0.002 | |
| 1602093 | Archive | C | 5 | 1 | 180 | 18.01 | 16.97 | RG | 270 | 1200 | 0.109 | 0.001 | |
| 1602174 | 29/06/98 | BnA | 5 | 1/2 | 300 | 21.69 | 21.40 | RG | 270 | 960 | 2.043 | 0.002 | N |
| 1602288 | 29/06/98 | BnA | 5 | 1/2 | 300 | 20.43 | 19.82 | RG | 240 | 1300 | 0.482 | 0.001 | N |
| 1603+001 | Archive | A | 5 | 1 | 30 | 16.47 | 14.98 | RG | 270 | 120 | 0.059 | 0.001 | |
| 1621115 | Archive | C | 1.4 | 1 | 300 | 19.79 | — | RG | 270 | 2100 | 0.375 | 0.002 | N |
| 1628268 | 29/06/98 | BnA | 5 | 2 | 180 | 19.10 | 17.92 | RG | 0 | 1500 | 0.166 | 0.003 | |
| 1643+022 | Archive | A | 5 | 1 | 60 | 17.02 | — | RG | 270 | 300 | 0.095 | 0.001 | |
| 1643223 | 29/06/98 | BnA | 5 | 1/4 | 240 | 19.25 | — | Q | 270 | 900 | 0.799 | 0.003 | |
| 1649062 | Archive | C | 1.4 | 1 | 300 | 19.05 | 18.41 | RG | 270 | 300 | 0.236 | 0.002 | |
| 1716+006 | Archive | A | 5 | 1 | 300 | 19.98 | 19.89 | Q | 270 | 1200 | 0.704 | 0.001 | N |
| 1732092 | 29/06/98 | BnA | 5 | 2 | 60 | 19.43 | 19.41 | RG | 0 | 900 | 0.317 | 0.001 | N |
| 1810+046 | Archive | A | 5 | 1 | 300 | 19.08 | 19.06 | Q | 270 | 1200 | 1.083 | 0.002 | |
| 1859235 | 28/06/98 | BnA | 5 | 2 | 300 | 20.82 | — | RG | 0 | 1200 | — | — | N |
| 1912269 | 28/06/98 | BnA | 5 | 2 | 300 | 18.62 | 17.49 | RG | 0 | 960 | 0.226 | 0.001 | |
| 1920077 | 28/06/98 | BnA | 5 | 2/4 | 300 | 21.51 | — | RG | 20 | 1200 | 0.648 | 0.001 | N |
| 1953077 | 28/06/98 | BnA | 5 | 2/3 | 420 | 22.90 | — | RG | 340 | 1200 | — | — | N |
| 2025155 | 28/06/98 | BnA | 5 | 3 | 120 | 19.86 | — | Q | 300 | 1700 | 1.500 | 0.003 | N |
| 2120166 | 28/06/98 | BnA | 5 | 3 | 120 | 20.93 | 20.94 | RG | 270 | 820 | 0.882 | 0.001 | |
| 2128208 | 28/06/98 | BnA | 5 | 3 | 90 | 19.49 | 19.46 | Q | 270 | 960 | 1.615 | 0.004 | N |
| 2318166 | Archive | BnA | 1.4 | 3 | 180 | 21.47 | 21.45 | RG | 270 | 900 | 1.414 | 0.001 | |
| 2322052 | 28/06/98 | BnA | 5 | 3 | 360 | 22.98 | 22.38 | RG | 270 | 3300 | 1.188 | 0.002 | N |
| 2347026 | Archive | A | 1.4 | 3 | 180 | 22.95 | 22.74 | RG | 270 | 900 | 1.036 | 0.001 | |
a Notes can be found in Section 4.3 for sources
marked with an N.
b Where two run numbers are given the first is for
imaging, the second for spectroscopy. The run numbers correspond to:
1 — EFOSC2 at the ESO 3.6m, April 21–22 1998.
2 — LDSS2 at the WHT, August 13 1998.
3 — EFOSC2 at the ESO 3.6m, November 20–21 1998.
4 — ISIS at the WHT, March 20–21 1999.
c For and km s -1 Mpc-1
VERSION INCLUDING FIGURES 2 TO 50 AVAILABLE FROM
http://www.strw.leidenuniv.nl/pbest/equatpap.ps
4 Results of Observations
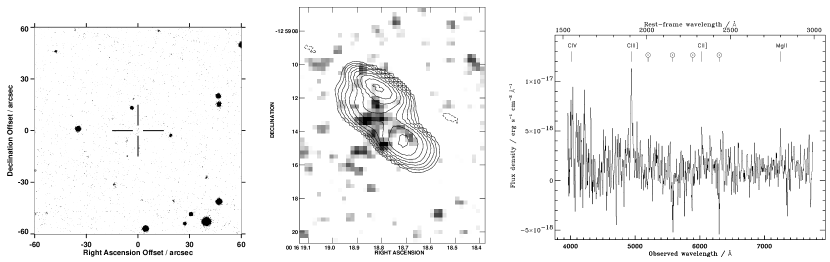
The host galaxy or quasar of the sources without pre–existing spectroscopic redshifts has been identified from the –band images in all 50 cases. Finding charts for these identifications can be found in Figures 1 to 50; these show a region of 2 by 2 arcminutes, centred upon the host galaxy or quasar. The host objects are indicated by the crosses on the finding charts. Where there may be some ambiguity as to the host object, with more than one object lying within the radio source structure, the justification for the labelled host is given in Section 4.3 on a source by source basis. A magnified view of the central regions can also be found overlaid upon the radio maps in Figures 1 to 50, except for the largest radio sources where this would simply repeat the finding chart view.
The absolute positioning of the optical frames was determined using the positions of between 8 and 12 unsaturated stars on the optical frames that were also present in the APM data base [1990] or the Digitized Sky Survey. The optical frames were registered with the sky surveys taking account of possible rotation of the field of view, and then the precise optical position of the host galaxy or quasar was determined. These positions can be found in the sample collation, Table 3. There will remain small astrometric errors between the radio and optical images, due to uncertainties in the absolute alignment of the radio and optical frames of reference. The magnitude of these errors can be judged from the mean positional difference between the optical centre of a radio galaxy or quasar and the position of a radio core, where the latter is detected. Unambiguous radio cores or unresolved radio sources (from a high resolution map) are observed for 21 of the sources presented here; there is no systematic offset between the radio core and the optical centre, and the root–mean–squared separation is 0.55 arcseconds. This therefore is the accuracy to which the radio and optical frames can be overlaid. Note that where there is an offset between the radio core position and the position of the optical identification in our data, it is the position of the optical source which is given in Table 3.
For 46 of the 50 galaxies a spectroscopic redshift was obtained. The spectra are shown in Figures 1–50 with the identified lines labelled, the resulting redshift being given in Table 1. The uncertainties of the peak positions of the measured emission lines and the variation in the measured redshift between different lines in the spectrum were both determined, and the larger of these values (generally the latter) was adopted as the uncertainty on the galaxy redshift. In four cases (1039+029, 1509+015, 1649062, 2322052) the redshift was based upon only weak emission lines, or a single strong emission line together with some weak confirming feature; notes on these sources are provided in Section 4.3. For the four sources for which no spectroscopic redshift has been obtained (1059010, 1413215, 1859235, 1953077), a discussion is also provided in Section 4.3.
4.1 Emission line properties
Various properties of the emission lines have been determined and are provided in Table 2. The flux of each emission line was determined by summing the intensities of the pixels above a fitted continuum level over a wavelength range of four times the fitted (pre–deconvolution) full–width at half–maximum (FWHM) of the line. The uncertainty in the measured flux of each emission line was calculated taking account both of the measurement error from the limited signal–to–noise of the emission line, and an uncertainty in the flux calibration, assumed to be 10%. Note that caution must be applied to the use of the derived emission line fluxes, since they are measured only from the portion of the galaxy sampled by the slit and therefore, especially at low redshifts, are lower than the total line flux emitted by the galaxy. These line fluxes should not be used to investigate the variation of emission line strengths as a function of redshift. The ratios of the line fluxes for lines not widely separated in wavelength should provide an accurate measure, although for widely separated lines caution should again be adopted since atmospheric diffraction means that the red and blue ends of the spectrum might be sampling different regions of the galaxy.
Also calculated are the deconvolved FWHM of the emission lines, determined assuming that the lines follow a Gaussian profile. The uncertainty in this deconvolved width is a combination of the uncertainty in the measured FWHM due to the limited signal–to–noise ratio of the line, and deconvolution errors introduced by the uncertainty in the spectral resolution of the observations, estimated to be 10%. Where the fitted FWHM was found to be less than the resolution, or the deconvolved FWHM was determined to be less than its error, the uncertainty in the deconvolved FWHM has been adopted as an upper limit to the deconvolved FWHM. Due to the low spectral resolution of these observations, this was frequently the case, and little velocity information was obtained except for the broadest lines. Finally, the equivalent widths of the emission lines were calculated, along with their errors. Where the equivalent width was determined to be smaller than 1.5 times its error, a value of twice the error in the equivalent width has been adopted as an upper limit to the line equivalent width.
4.2 Optical magnitudes and classifications
–band magnitudes were measured for the host galaxy or quasar, after any faint objects close to the radio source host but not obviously a part of it had been edited out of the image. The local sky level was determined within a concentric annulus centred upon the host object with an inner radius of between 5 and 10 arcseconds, chosen to avoid contamination from nearby objects, and a width of 2 or 3 arcseconds. Where it was impossible to avoid faint objects within the sky annulus, these objects were edited out of the image before photometry was performed. In 5 cases (1307+000, 1643223, 1859235, 1912269, 1920077) it was impossible to avoid nearby bright objects, or large numbers of faint objects, falling within the sky annulus. In these cases the local sky level was estimated using regions of empty sky close to the host galaxy or quasar at a range of different position angles.
The –band magnitude was determined through two different aperture sizes. First, a 4 arcsecond diameter aperture was used, chosen to allow comparison with the measurements of McCarthy et al. [1996] for the Molonglo strip sources. Such a measurement was possible for all of the objects, since none had significant contributions from other objects at these radii. It should be noted, however, that this aperture measurement seriously underestimates the luminosity of low redshift galaxies (for quasars there is little dependence of the –magnitude upon aperture diameter). The second aperture adopted was a fixed metric aperture of 63.9 kpc diameter; such an aperture is large enough to contain essentially all of the light from the galaxies, the specific value of 63.9 kpc being chosen for comparison with the measurements of Eales et al. [1997]. Determination of the –magnitude through a 63.9 kpc aperture was not possible in all cases: for the 4 sources without redshifts, the aperture diameter corresponding to 63.9 kpc is unknown; for 8 other sources, nearby objects too bright to be accurately edited out of the image prevented measurement of the flux out to these radii.
The –band magnitudes of the host galaxies and quasars through these two apertures are provided in Table 1. Notice the large differences, up to 1.5 magnitudes, between the two values for the low redshift galaxies. The uncertainties on the measurements of these magnitudes are about 0.1 magnitudes for , increasing to about 0.3 magnitudes by .
The nature of optical identification was classified based upon optical appearance of the image and the presence of broad emission lines, that is, emission lines with a deconvolved FWHM greater than 2000 km s -1, with an uncertainty sufficiently low that the FWHM minus its uncertainty is above 1500 km s -1. If the optical image contained an unresolved component of absolute luminosity111To calculate the K–correction needed to derive absolute magnitudes, a power–law slope of spectral index 0.7 was assumed for the point source continuum. (roughly equivalent to the limit in the quasar catalogue of Véron–Cetty & Véron 1996; cf. the discussion in Willott et al. 1998), and broad emission lines, then the object was classified as a quasar. This was true for eight of the fifty cases. Of the remainder, 0850206, 1140114, 1436167 are all well–resolved and show narrow forbidden lines, but their permitted lines are broad. These sources were therefore classified as broad–line radio galaxies. 1732092 also shows broad permitted lines, and some of its emission comes from an unresolved component, but that component is not sufficiently luminous to be classified as a quasar and so it also is classified as a broad–line radio galaxy. The remainder of the identifications are well resolved with only narrow lines and so are classified as radio galaxies.
In Figure 51 the magnitudes are plotted against the redshift of the source, showing the radio galaxies and quasars separately. The diagram for the radio galaxies shows the well–known tight correlation out to about a redshift of 0.8 (e.g. Eales 1985), beyond which the scatter increases due to different strengths of the alignment effect in different sources. This diagram is powerful because the correlation can be used to provide supporting evidence for redshifts determined from only weak features, and to estimate the redshifts of the 4 remaining sources from their –magnitudes. The quasars have brighter –magnitudes than would be expected from the relation of the radio galaxies, due to their AGN component.
4.3 Notes on individual sources
0056–172: The optical identification of this source is the south–westerly of the two objects lying along the radio source axis; the north–eastern object shows no strong emission lines.
0125–143: The optical identification, showing powerful line emission, is the brighter of the two objects and is coincident with the radio core.
0128–264: The identification is the faint aligned object lying directly along the radio axis. The high background level in the south–west is caused by a nearby bright star.
0357–163: The host galaxy appears to lie coincident with the eastern hotspot (possibly the core if a faint radio lobe has been missed), but this identification is secure: the galaxy shows strong emission lines and no other object is observed within the radio source structure.
0850–206: The host radio galaxy, showing powerful emission lines, is the more southerly of the two objects within the radio source structure.
1039+029: The redshift of this source is based upon a single strong emission line which, owing to its high flux, is assumed to be [OII] 3727. This assumption is supported by the detection of a spectral break, consistent with being at 4000Å rest–frame, and by the consistency of the –magnitude of this galaxy with the relationship if it is at that redshift (see Figure 51).
1059–010: No spectroscopic redshift has been obtained for this source; the only spectroscopic observations have been carried out during twilight conditions. The proposed host galaxy is extremely faint (), detected at only the level, but is the only possible identification found. The location of this galaxy at the centre of the radio source and its elongation along the radio axis (as is common of high redshift radio galaxies) add to its believability. Comparing the –magnitude of this galaxy with the relationship suggests a minimum redshift of about 1.5.
1131–171: The northern of the two objects within the radio source structure, a high redshift quasar, is the host identification for this radio source.
1344–078: It is the object 2 arcseconds north of the centre of the radio source (RA 13 44 23.60, Dec 07 48 25.2) which shows strong emission lines and is therefore identified as the radio source host galaxy.
1413–215: No spectroscopic redshift has been obtained for this source. At the time of the imaging and spectroscopic observations, only a low ( arcsec) resolution NVSS radio map was available and this indicated a radio position 10 arcseconds south of the true core due to the asymmetry between the northern and southern hotspot strengths. Given this, there was no obvious host galaxy identification, and so no spectroscopic observations were attempted. The new high resolution VLA map provides an unambiguous optical identification, whose –band magnitude suggests that it is above a redshift of one (cf. Figure 51).
1422–297: The optical identification is the brighter of the two objects towards the centre of the radio source. The fainter object shows no strong emission lines.
1434+036: This source is classified as a quasar on account of a sufficiently luminous unresolved optical component. Its broad MgII 2799 emission (FWHM km s -1) is relatively low for quasars, and the –magnitude lies almost within the scatter of the radio galaxy relation at this redshift, and so the quasar component is likely to be not extremely powerful.
1509+015: The redshift for this galaxy is based predominantly upon one very luminous emission line, assumed to be [OII] 3727; only a weak emission line consistent with being MgII 2799 and a potential 4000Å break are seen to support this. Some corroborating evidence is given by the –magnitude of the galaxy, which is consistent with the relationship of the sample if this redshift is correct.
1602–174: The emission line object identified as the host galaxy of this radio source is the faint galaxy aligned along the radio axis, coincident with the radio core.
1602–288: The two–dimensional spectrum along the radio axis shows emission lines covering an angular extent of over 20 arcseconds (see Figure 31), which at a redshift of corresponds to a spatial extent of nearly 150 kpc. This emission line region extends through both of the objects lying directly along the radio axis, centred close to the fainter of the two objects. The continuum shape of this fainter object (RA 16 02 6.65, Dec 28 51 5.2) resembles an intermediate redshift radio galaxy, whilst the brighter object (ignoring the emission lines) is unresolved and spectroscopically a star. Therefore, although the brighter object is coincident with what has the appearance of a radio core, it is the fainter object which is identified as the host radio galaxy.
1621–115: The object at the centre of the radio contours shows emission lines and so is identified as the host radio galaxy.
1649–062: The optical identification lies very close to the centre of this large radio source. The galaxy shows only very weak emission lines; its redshift is based upon a weak [OII] 3727 emission line and three absorption features. The other object close to the radio source centre is a star.
1716+006: This source is classified as a quasar since, apart from a very close companion, its optical emission is unresolved. The H line, although weak, appears broad (FWHM of km s -1). The –band magnitude of this object is about 1.5 magnitudes brighter than the relation of the radio galaxies at that redshift, support the interpretation of a significant quasar component.
| Source | Flux / 10-16 | FWHM | E.W. | |||
| & Line | [erg/s/cm2] | [km s-1] | [Å] | |||
| 0016129 | ||||||
| CIV | 1.6 | 0.5 | 31 | 14 | ||
| CIII] | 2.6 | 0.6 | 63 | 35 | ||
| CII] | 1.2 | 0.4 | ||||
| MgII | 0.6 | 0.3 | ||||
| 0056172 | ||||||
| CIII] | 1.4 | 0.5 | 11 | 4 | ||
| CII] | 0.7 | 0.4 | 5 | 2 | ||
| NeIV | 2.2 | 0.4 | 17 | 3 | ||
| MgII | 4.7 | 0.6 | 1952 | 686 | 39 | 5 |
| [NeV] | 1.2 | 0.2 | 11 | 2 | ||
| [NeV] | 2.5 | 0.3 | 26 | 4 | ||
| [OII] | 14.6 | 1.5 | 803 | 269 | 159 | 21 |
| 0101128 | ||||||
| [OII] | 18.2 | 2.1 | 1039 | 446 | 234 | 72 |
| H | 1.7 | 0.4 | 8 | 2 | ||
| [OIII] | 9.2 | 1.0 | 702 | 314 | 50 | 6 |
| 0125143 | ||||||
| [OII] | 16.2 | 1.8 | 983 | 438 | 56 | 7 |
| H | 8.6 | 1.6 | 17 | 3 | ||
| [OIII] | 6.4 | 0.9 | 14 | 2 | ||
| [OIII] | 12.4 | 1.5 | 832 | 393 | 29 | 3 |
| 0128264 | ||||||
| Ly | 7.9 | 1.4 | 1755 | 1160 | ||
| CIV | 1.1 | 0.1 | 1636 | 983 | 113 | 23 |
| CIII] | 0.6 | 0.6 | ||||
| 0132079 | ||||||
| MgII | 1.3 | 0.9 | ||||
| [NeV] | 2.4 | 0.5 | 16 | 3 | ||
| [OII] | 8.8 | 0.9 | 592 | 371 | 60 | 7 |
| [NeIII | 1.8 | 0.3 | 10 | 1 | ||
| H | 1.7 | 0.3 | 8 | 1 | ||
| [OIII] | 12.5 | 1.3 | 63 | 7 | ||
| [OIII] | 32.9 | 3.3 | 169 | 19 | ||
| 0219082 | ||||||
| [OII] | 21.8 | 2.6 | 76 | 12 | ||
| [NeIII | 2.6 | 1.1 | 7 | 3 | ||
| H | 1.7 | 1.0 | 1106 | 1027 | 2 | 1 |
| H | 2.9 | 1.2 | 3 | 1 | ||
| [OIII] | 24.9 | 2.6 | 829 | 332 | 32 | 3 |
| 0310150 | ||||||
| CIV | 10.2 | 1.5 | 2323 | 1348 | 84 | 30 |
| HeII | 4.0 | 0.8 | 810 | 794 | 33 | 10 |
| CIII] | 5.0 | 0.8 | 3051 | 2204 | 56 | 13 |
| CII] | 2.2 | 0.5 | 882 | 747 | 43 | 16 |
| 0357163 | ||||||
| MgII | 6.1 | 1.1 | 2078 | 1493 | 61 | 15 |
| [NeV] | 2.2 | 0.5 | 20 | 5 | ||
| [OII] | 6.7 | 0.7 | 62 | 8 | ||
| [NeIII | 1.9 | 0.3 | 15 | 3 | ||
| H | 1.4 | 0.4 | 9 | 2 | ||
| 0406180 | ||||||
| MgII | 15.0 | 1.8 | 7126 | 2775 | 22 | 2 |
| [NeV] | 3.1 | 0.4 | 4 | 0 | ||
| [OII] | 14.0 | 1.5 | 662 | 319 | 21 | 2 |
| [NeIII | 5.4 | 0.6 | 8 | 1 | ||
| H | 2.0 | 0.7 | 3 | 1 | ||
| H | 8.1 | 1.1 | 2601 | 841 | 13 | 1 |
| Source | Flux / 10-16 | FWHM | E.W. | |||
| & Line | [erg/s/cm2] | [km s-1] | [Å] | |||
| 0519208 | ||||||
| CIII] | 6.0 | 1.1 | 1597 | 1230 | ||
| CII] | 0.9 | 0.4 | 21 | 12 | ||
| MgII | 3.4 | 0.6 | 2494 | 1739 | 84 | 26 |
| [NeV] | 3.2 | 0.5 | 707 | 444 | 90 | 31 |
| [OII] | 11.7 | 1.2 | 795 | 275 | 274 | 81 |
| 0850206 | ||||||
| CIII] | 2.1 | 0.2 | 1180 | 545 | 57 | 9 |
| CII] | 0.9 | 0.1 | 2587 | 1281 | 22 | 2 |
| NeIV | 1.7 | 0.2 | 988 | 356 | 41 | 4 |
| MgII | 1.9 | 0.2 | 2384 | 323 | 48 | 4 |
| 0851142 | ||||||
| CIV | 3.4 | 0.4 | 961 | 554 | 81 | 20 |
| HeII | 2.3 | 0.3 | 59 | 14 | ||
| CIII] | 1.6 | 0.2 | 56 | 13 | ||
| NeIV | 0.6 | 0.1 | 907 | 646 | 39 | 13 |
| MgII | 2.2 | 0.4 | 6088 | 5895 | ||
| 1039029 | ||||||
| [OII] | 1.5 | 0.2 | 30 | 3 | ||
| 1131171 | ||||||
| CIV | 186.4 | 18.8 | 7085 | 693 | 49 | 5 |
| HeII | 6.8 | 1.2 | 2 | 1 | ||
| CIII] | 39.0 | 4.0 | 4813 | 598 | 18 | 1 |
| NeIV | 6.7 | 0.8 | 8418 | 3418 | 3 | 1 |
| 1138015 | ||||||
| [OII] | 30.5 | 3.5 | 1062 | 428 | 207 | 55 |
| H | 1.9 | 1.6 | ||||
| H | 0.5 | 2.7 | ||||
| H | 3.6 | 2.6 | ||||
| [OIII] | 1.7 | 0.9 | 7 | 1 | ||
| [OIII] | 3.8 | 3.1 | ||||
| 1140114 | ||||||
| CIV | 1.0 | 0.3 | 2878 | 2274 | 24 | 8 |
| HeII | 0.5 | 0.1 | 13 | 3 | ||
| CIII] | 0.6 | 0.1 | 15 | 3 | ||
| CII] | 1.9 | 0.3 | 3686 | 1069 | 65 | 16 |
| 1303091 | ||||||
| HeII | 2.6 | 0.3 | 21 | 3 | ||
| CIII] | 3.5 | 0.4 | 981 | 491 | 30 | 3 |
| NeIV | 1.0 | 0.1 | 11 | 1 | ||
| MgII | 2.7 | 0.3 | 1232 | 341 | 43 | 4 |
| 1307000 | ||||||
| [NeV] | 1.6 | 0.4 | 5 | 1 | ||
| [OII] | 18.9 | 1.9 | 63 | 6 | ||
| [NeIII | 2.8 | 0.4 | 8 | 1 | ||
| [OIII] | 9.0 | 1.0 | 23 | 2 | ||
| [OIII] | 27.9 | 2.8 | 74 | 7 | ||
| 1344078 | ||||||
| [NeV] | 3.1 | 0.6 | 2873 | 2323 | 21 | 4 |
| [OII] | 11.4 | 1.2 | 574 | 393 | 67 | 7 |
| H | 0.7 | 0.5 | 1688 | 1455 | 2 | 1 |
| H | 2.2 | 0.4 | 6 | 1 | ||
| [OIII] | 4.7 | 0.6 | 14 | 1 | ||
| [OIII] | 15.5 | 1.6 | 51 | 5 | ||
| 1354013 | ||||||
| [NeV] | 0.6 | 0.2 | 11 | 4 | ||
| [OII] | 6.4 | 0.7 | 425 | 307 | 95 | 15 |
| [NeIII | 0.5 | 0.2 | 6 | 2 | ||
| Source | Flux / 10-16 | FWHM | E.W. | |||
| & Line | [erg/s/cm2] | [km s-1] | [Å] | |||
| 1411057 | ||||||
| CIII] | 1.1 | 0.2 | 25 | 6 | ||
| MgII | 0.5 | 0.2 | 1692 | 1481 | 16 | 6 |
| [NeV] | 0.5 | 0.2 | 15 | 5 | ||
| [OII] | 3.2 | 0.4 | 118 | 27 | ||
| 1422297 | ||||||
| CIV | 4.3 | 0.6 | 1662 | 954 | 61 | 16 |
| HeII | 2.1 | 0.4 | 1943 | 1838 | 30 | 8 |
| CIII] | 1.0 | 0.2 | 19 | 4 | ||
| NeIV | 0.6 | 0.1 | 532 | 484 | 13 | 3 |
| 1434036 | ||||||
| HeII | 5.5 | 0.6 | 675 | 567 | 44 | 7 |
| CIII] | 2.7 | 0.3 | 24 | 3 | ||
| NeIV | 0.8 | 0.1 | 10 | 1 | ||
| MgII | 0.8 | 0.2 | 2460 | 408 | 11 | 3 |
| 1436167 | ||||||
| [NeV] | 4.9 | 1.0 | 6 | 1 | ||
| [OII] | 124.7 | 12.6 | 775 | 468 | 140 | 15 |
| [NeIII] | 15.2 | 2.1 | 14 | 2 | ||
| H | 2.1 | 1.8 | 1467 | 787 | ||
| H | 22.8 | 2.4 | 10 | 1 | ||
| [OIII] | 144.7 | 14.5 | 68 | 6 | ||
| [OIII] | 344.2 | 34.4 | 580 | 345 | 162 | 16 |
| [OI] | 19.5 | 2.2 | 9 | 1 | ||
| H | 332.3 | 33.3 | 2180 | 267 | 178 | 18 |
| [SII] | 105.0 | 10.6 | 843 | 268 | 57 | 5 |
| 1509015 | ||||||
| MgII | 1.2 | 0.3 | 1426 | 1341 | 47 | 19 |
| [OII] | 5.6 | 0.6 | 656 | 307 | 108 | 15 |
| 1602093 | ||||||
| [OII] | 5.8 | 7.9 | ||||
| 1602174 | ||||||
| CIV | 10.0 | 1.1 | 915 | 442 | 59 | 8 |
| HeII | 4.8 | 0.6 | 658 | 456 | 32 | 4 |
| CIII] | 2.7 | 0.3 | 23 | 3 | ||
| NeIV | 1.0 | 0.4 | 13 | 6 | ||
| 1602288 | ||||||
| [NeV] | 2.1 | 0.3 | 19 | 2 | ||
| [OII] | 19.0 | 1.9 | 189 | 20 | ||
| [NeIII] | 4.3 | 0.5 | 42 | 4 | ||
| H | 1.6 | 0.2 | 18 | 2 | ||
| H | 0.8 | 0.3 | 18 | 2 | ||
| [OIII] | 10.8 | 1.1 | 179 | 25 | ||
| [OIII] | 38.4 | 3.8 | 649 | 93 | ||
| 1603001 | ||||||
| H | 26.0 | 4.8 | 1973 | 928 | 4 | 1 |
| [SII] | 6.3 | 2.9 | 1 | 1 | ||
| 1621115 | ||||||
| [OII] | 3.1 | 0.5 | 658 | 539 | 28 | 4 |
| 1628268 | ||||||
| [OII] | 6.2 | 1.7 | 86 | 32 | ||
| 1643022 | ||||||
| [OII] | 28.1 | 3.8 | 13 | 1 | ||
| [NeIII] | 8.8 | 1.4 | 3 | 1 | ||
| H | 7.5 | 1.7 | 2 | 1 | ||
| [OIII] | 102.1 | 10.3 | 27 | 2 | ||
| [OIII] | 242.2 | 24.3 | 65 | 6 | ||
| H | 290.5 | 29.2 | 1911 | 283 | 86 | 8 |
| [SII] | 53.8 | 5.6 | 17 | 1 | ||
| Source | Flux / 10-16 | FWHM | E.W. | |||
| & Line | [erg/s/cm2] | [km s-1] | [Å] | |||
| 1643223 | ||||||
| CIII] | 5.9 | 1.3 | 1400 | 938 | 38 | 11 |
| CII] | 5.6 | 1.3 | 3719 | 3537 | 13 | 3 |
| MgII | 32.5 | 3.9 | 6664 | 2345 | 76 | 10 |
| 1649062 | ||||||
| [OII] | 4.9 | 1.2 | 39 | 11 | ||
| 1716006 | ||||||
| [NeV] | 1.2 | 0.3 | 4 | 1 | ||
| [OII] | 4.2 | 0.5 | 412 | 335 | 15 | 1 |
| [NeIII] | 1.9 | 0.3 | 6 | 1 | ||
| H | 4.2 | 0.7 | 3473 | 626 | 15 | 2 |
| 1732092 | ||||||
| H | 140.9 | 14.1 | 4915 | 289 | 73 | 7 |
| [OIII] | 26.1 | 2.6 | 689 | 48 | 14 | 1 |
| [OIII] | 49.6 | 5.0 | 642 | 43 | 28 | 2 |
| H | 187.0 | 19.0 | 5401 | 553 | 223 | 23 |
| 1810046 | ||||||
| CIII] | 79.3 | 8.3 | 3109 | 706 | 22 | 2 |
| NeIV | 8.7 | 1.7 | 1251 | 865 | 1 | 1 |
| MgII | 207.0 | 20.9 | 6772 | 661 | 42 | 4 |
| [NeV] | 11.3 | 1.9 | 590 | 447 | 3 | 1 |
| [OII] | 46.3 | 5.1 | 749 | 287 | 16 | 1 |
| 1912269 | ||||||
| [OII] | 8.8 | 1.2 | 1149 | 602 | 48 | 7 |
| [OIII] | 3.2 | 0.5 | 11 | 1 | ||
| 1920077 | ||||||
| H | 1.4 | 0.5 | 27 | 1 | ||
| [OIII] | 5.8 | 0.7 | 502 | 177 | 120 | 67 |
| [OIII] | 19.2 | 2.0 | 539 | 72 | 401 | 232 |
| 2025155 | ||||||
| CIII] | 3.7 | 0.5 | 2711 | 1379 | 24 | 4 |
| CII] | 2.6 | 0.3 | 1533 | 615 | 8 | 1 |
| NeIV | 2.5 | 0.3 | 1624 | 564 | 6 | 1 |
| MgII | 6.9 | 0.9 | 6685 | 4319 | 16 | 2 |
| 2120166 | ||||||
| CII] | 1.6 | 0.8 | 11 | 6 | ||
| MgII | 7.3 | 1.9 | 55 | 16 | ||
| [OII] | 12.4 | 1.3 | 728 | 306 | 168 | 38 |
| 2128208 | ||||||
| CIV | 4.9 | 0.9 | 2041 | 1737 | 16 | 3 |
| HeII | 2.6 | 0.5 | 7 | 1 | ||
| CIII] | 9.2 | 1.1 | 4878 | 1839 | 21 | 2 |
| 2318166 | ||||||
| HeII | 7.8 | 1.0 | 24 | 4 | ||
| CIII] | 6.2 | 0.7 | 29 | 4 | ||
| CII] | 2.0 | 0.3 | 1009 | 546 | 12 | 2 |
| NeIV | 1.1 | 0.2 | 6 | 1 | ||
| MgII | 4.4 | 0.6 | 1333 | 526 | 38 | 6 |
| 2322052 | ||||||
| CII] | 1.8 | 0.2 | 636 | 435 | 172 | 57 |
| MgII | 0.8 | 0.2 | 1701 | 1012 | ||
| 2347026 | ||||||
| CII] | 0.6 | 0.2 | ||||
| MgII | 1.1 | 0.3 | 1327 | 1221 | 52 | 20 |
| [OII] | 4.3 | 0.5 | 510 | 275 | 161 | 36 |
1732–092: The optical identification is the object lying coincident with the bright knot of radio emission. This object is mostly unresolved, but the unresolved component does not contain sufficient flux for it to be classified as a quasar. Its –magnitude is comparable to those of radio galaxies at this redshift. The galaxy shows clearly broad emission lines so is identified as a broad–line radio galaxy.
1859–235: The identification lies towards the centre of the radio source and so is reasonably secure, although no spectroscopic redshift was obtained for this source in a 20 minute spectrum (albeit taken at a mean airmass of 1.9). The –band magnitude suggest a redshift in the range 0.3 to 0.9 (cf. Figure 51).
1920–077: The object lying in the gap between the two radio lobes is identified as the host galaxy on the grounds of its location, its resolved emission (many of the objects seen in the image are stellar), and the fact that it shows powerful line emission.
1953–077: The object close to the southern radio lobe is a very likely candidate host galaxy, also on the basis of a detection at the same location in a short exposure J-band image made with WHIRCAM, the infrared imager on the WHT. A spectrum of this object taken during twilight conditions failed to yield a redshift for the galaxy, but the faintness of the –magnitude indicates that the galaxy is above a redshift of one.
2025–155: It is the fainter (north–eastern) of the two objects seen close to the radio source that shows line emission and is identified as the host object. This object is unresolved, shows a power–law type spectrum, and has an –magnitude about 3 magnitudes brighter than the mean relationship and so is identified as a quasar.
2128–208: The brighter (eastern) of the two sources is identified as a quasar, and is the host of this radio source. The western object shows no strong emission lines.
2322–052: The region of faint diffuse emission close to the eastern radio lobe shows powerful line emission and is identified as the host radio galaxy. Two emission lines are unambiguously detected with wavelengths consistent with being CIII] 2326 and MgII 2799 at a redshift of 1.188. Weak features consistent with [OII] 2470 and [NeV] 3426 provide supporting evidence, although it is surprising that CII] 1909 is not seen. The –magnitude of the host galaxy is also consistent with the proposed redshift.


5 The complete sample
5.1 Sample Collation
In Table 3, details are collated of all 178 radio sources in the complete BRL sample. The right ascension and declination of the host galaxy of each source have positional uncertainties typically well below 1 arcsecond. The 408 MHz flux density of the radio source is taken from the MRC catalogue value, except for radio sources of angular size larger than 100 arcseconds, in which case the Parkes Catalogue [1990] value was used instead (see discussion in Section 5.2). The spectral index of the source was calculated between the 408 MHz flux density and the flux density at 1.4 GHz, the latter being determined from the NVSS catalogue [1998]. The radio power of each source, corrected to a rest–frame frequency of 408 MHz and calculated assuming and km s -1 Mpc-1, is also tabulated.
The radio galaxies and quasars were classified, where observations of sufficient angular resolution were available for this to be done (otherwise they are classified as ‘U’), into three categories: Fanaroff and Riley (1974; hereafter FR) classes one (‘I’) and two (‘II’), and sources whose emission is dominated by the radio core, either as a core–jet or a core–halo source (‘C’). For a small number of sources, complicated radio structure prohibits an unambiguous classification between FR Is and FR IIs; in these cases the classification is followed by a question mark to indicate the uncertainty, or designated as I / II. Determination of the angular size of the radio source depended upon the source classification. In the case of the majority FR II objects, the angular separation between the hotspots in each lobe most distant from the active nucleus was measured. For FR I’s and core dominated sources, the determined angular size is necessarily more arbitrary and less robust: whatever method is used the measured angular size of an FR I will always be highly dependent upon the sensitivity and frequency of the radio observations. In this paper, the maximum angular separation within the second highest radio contour on the quoted radio map was used.
The (heliocentric) redshifts of the host galaxies or quasars of the radio sources are provided in the table to an accuracy of three decimal places, unless the original measurement was not made to such precision, in which case it is given to the accuracy quoted in the original reference; uncertainties on the new redshifts presented in this paper can be found in Table 1. The nature of the host object is also classified in the table. Two sources lie nearby and are a starburst galaxy (NGC253) and a Seyfert 2 galaxy (NGC1068); the rest of the sources are classified as either a quasar or a radio galaxy. For the sources presented in this paper, a discussion of the classification scheme adopted has been presented in Section 4. Where possible this was also applied to the other 128 sources, but in the majority of cases it was only possible to accept the classification determined by the authors of the original imaging and spectroscopy papers. For some of the radio galaxies broad lines have been detected either in our spectroscopic observations (see Section 4) or in the literature, and these radio galaxies have been sub–classified as broad–line radio galaxies (BLRG’s). It should be noted, however, that some or many of the galaxies which remain classified under the more general ‘Radio Galaxy’ classification may actually be BLRG’s but the spectra are of insufficient quality to determine this.
Additionally provided in Table 3 are references to the optical identification, spectroscopic redshift, and a radio map of the galaxy. The optical identification reference refers to the publication which first identified the radio source host or to the first published finding chart of the field. The spectroscopic redshift is referenced by the first published value; for some sources later observations have confirmed this redshift and provided a more accurate value. Where this is the case the first publication is still given in the reference list, but the improved value for is used. The third reference given is to a high quality radio map or, where none exist, the best radio data available in the literature. For sources which have been well–studied and have many radio maps in the literature, the reference is not necessarily to the most sensitive or the highest angular resolution data, but is simply to a map of sufficient quality to show clearly the important features of the radio source provided in the table.
Notes need to be added to the classifications and redshifts of three of these sources.
0347+052: The NASA/IPAC Extragalactic Database (NED) gives a redshift for this source of 0.76, but both Allington–Smith et al. [1991] and di Serego Alighieri et al. [1994] derive a redshift of 0.339, and so the latter value is adopted here.
0834196: This object is classified as a galaxy in NED, but di Serego Alighieri et al. [1994] point out that the host is actually an unresolved object, and they classify it as a quasar. That classification is adopted here.
2030230: This object is classified as a quasar by Kapahi et al. [1998a], but in the rest of the literature is classified as an N–type galaxy. It is not sufficiently luminous to be classified as a quasar here, according to the classification scheme adopted in Section 4, and so falls within the radio galaxy population.
5.2 Radio selection effects: missing large sources?
An issue of concern in the definition of any sample of radio sources such as this is the possibility that giant radio sources, which may have sufficient flux density to be above the selection limit for the complete sample but owing to their large angular sizes may have only a low surface brightness, are missed from the sample. A discussion of this issue for the 3CR LRL sample can be found in Bennett [1962] and Riley [1989].
This issue indeed turns out to be very relevant for the MRC catalogue, due to the method of determining catalogue fluxes. As described by Large et al. [1981], the catalogue is based on a point-source fitting procedure, and so the flux density of sources whose angular size is comparable to or larger than the beam size (3 arcmins) may be systematically underestimated by an amount which depends strongly upon the angular structure of the source. To investigate how strong this effect is, for all of the radio sources in the BRL sample with angular sizes in excess of 60 arcsecs, the 408 MHz flux density from the MRC survey has been compared with that measured in the lower angular resolution Parkes Catalogue [1990]; the results are shown in Figure 52. The flux densities determined for the MRC sources are secure up to 100 arcsec, but above 200 arcsec the MRC flux densities of some sources are lower by as much as a factor of two (some of this difference may be due to the presence of other weaker sources within the large Parkes beam, but the majority is due to an underestimate of the MRC flux densities). Therefore, in Table 3 the flux densities quoted for sources larger than 100 arcsec are those taken from the Parkes Catalogue.
This result raises the possibility that some sources larger than arcsec have been missed from the sample because the MRC has underestimated their flux density, artificially placing them below the flux density cut–off. At high redshifts this effect is likely to be of little importance (200 arcsec corresponds to 1 Mpc at a redshift , and the 3CR sample shows that there are essentially no higher redshift sources larger than this size of sufficient flux density), but at this angular size corresponds to only 500 kpc and below this redshift sources may be missed. Indeed, a comparison of the redshift distributions of the BRL and LRL samples222Note: in accordance with the new observations of Willott et al. (1999), 3C318 in the LRL sample has been reclassified in our diagrams as a quasar of redshift 1.574 instead of a radio galaxy at . (Figure 53) shows that the BRL sample has a slightly lower peak at which may be due to this effect (although the combined counts at are similar, and a Kolmogorov–Smirnov test shows no statistically significant differences between the two distributions). The BRL sample also contains a lower percentage of FR I class sources than the LRL sample, 8% as compared with 16%; FR Is enter the sample generally only at low redshifts and have considerable flux which can not be well–modelled as point sources, and so are perhaps more likely to be missed.
To summarise, whilst the sample is essentially complete at redshifts , radio selection effects in the MRC catalogue may have led to a small number of low redshift sources with angular sizes arcsec having been excluded from the sample.


5.3 Sample Properties
Some features of the sample can be easily examined and compared to those of the 3CR sample, to show any differences resulting from the selection at 408 MHz instead of 178 MHz. In Figure 54 is shown the radio power versus linear size () diagram for the BRL sample, and that for the LRL sample corrected to the same rest–frame frequency. In Figure 55 the redshift versus spectral index distribution of both samples is shown, showing the well–known increase in mean spectral index with redshift. The two samples show very similar distributions in both plots suggesting that there is little difference in their global properties. The mean and standard deviation of the spectral indices of the two samples are and , both comparable. Figure 56 shows the distribution of sources from the two samples in the plane; again the distributions are generally similar, although a small excess of BRL sources is to be found with small radio sizes ( kpc) and steep spectra (); it is not entirely unexpected that the higher selection frequency will select a larger fraction of these compact steep–spectrum sources, as synchrotron self–absorption prohibits these from entering low frequency selected samples. This appears to be the only important difference between the LRL and BRL samples.


The redshift distribution of the two samples has already been shown to be similar in Figure 53. An interesting feature of this plot is that the fraction of radio galaxies and quasars at redshifts in the new BRL sample remains roughly constant, indicating that the 100% quasar fraction beyond in the LRL sample is just due to small number statistics. This result can be seen in Figure 57 which shows the quasar fraction as a function of redshift from the combined BRL and LRL samples; there is no significant increase in the quasar fraction at the highest redshifts. Both samples show a stark lack of quasars at the lowest redshifts, which has been discussed by many authors. In orientation–based unification schemes (e.g. Barthel 1989) this is partially attributed to broad–line radio galaxies being the equivalent of the quasar population at low redshifts (e.g. see Antonucci 1993 for a review); more sophisticated explanations have been proposed, including an evolution in the opening angle of the torus with radio power (e.g. Lawrence 1991), or the presence of an isotropic population of low excitation radio galaxies at low redshift [1994].
The simple unification scheme of Barthel [1989] makes strong predictions for the relative linear sizes of radio galaxies and quasars; indeed, the difference in linear sizes between the two populations in the 3CR sample was one of the factors which led him to propose the model. Figure 58 now shows the radio size versus redshift distribution for the BRL and LRL samples combined, plotting radio galaxies and quasars separately. The median linear sizes of the radio galaxies and quasars have been calculated in five separate redshift bins, the lowest redshift bin including insufficient quasars to calculate an accurate median. With the increased number of sources, the result of Barthel [1989] still holds that radio galaxies with are, on average, larger than quasars in the same redshift range by about a factor of two. This relation is also true for higher redshifts, but the larger number statistics confirm that the result does not hold at lower redshifts (e.g. see Singal et al. 1993 for the LRL sample alone; although cf. the discussion of Section 5.2 which might have a slight effect here). Again, this rules out the simplest unification schemes, but can plausibly be explained by the modifications discussed above (e.g. see Gopal–Krishna et al. 1996).
![[Uncaptioned image]](/html/astro-ph/9903471/assets/x12.png)
![[Uncaptioned image]](/html/astro-ph/9903471/assets/x13.png)
![[Uncaptioned image]](/html/astro-ph/9903471/assets/x14.png)
![[Uncaptioned image]](/html/astro-ph/9903471/assets/x15.png)
6 Conclusions
Details of a new sample of the most powerful equatorial radio sources have been collated. New radio imaging, optical imaging and spectroscopic observations have been presented of the sources previously without spectroscopic redshifts, leading to the complete sample being fully optically identified and spectroscopic redshifts being available for 174 of the 178 sources (98%). Work to obtain the redshifts for the remaining four sources is continuing.
Due to method of determining flux densities used for the Molonglo Reference Catalogue, radio selection effects may have led to a small number of radio sources subtending angular sizes larger than about 200 arcseconds being missed from the catalogue; this probably gives rise to the slightly lower percentage of FR I sources in the new sample of radio sources as compared with the revised 3CR sample. Another observed difference is that the new sample contains a higher percentage of compact steep spectrum sources than the 3CR sample; this was to be expected since these sources are often missed in low frequency selected samples due to synchrotron self–absorption. No other significant differences are found between the properties of the new sample and those of the 3CR sample.
Due to its equatorial location and its high spectroscopic completeness, this sample will prove very useful for studies using a combination of the northern hemisphere instruments such as the VLA, and the new and forthcoming southern hemisphere telescope facilities, such as the large optical telescopes and the Atacama Large Millimetre Array.
Acknowledgements
This work was supported in part by the Formation and Evolution of Galaxies network set up by the European Commission under contract ERB FMRX– CT96–086 of its TMR programme. This work is based upon observations made at the European Southern Observatory, La Silla, Chile, and using the William Herschel Telescope and the Very Large Array. The William Herschel Telescope is operated on the island of La Palma by the Isaac Newton Group in the Spanish Observatorio del Roches de los Muchachos of the Instituto de Astrofisica de Canarias. The National Radio Astronomy Observatory is operated by Associated Universities Inc., under co-operative agreement with the National Science Foundation. The Digitized Sky Surveys were produced at the Space Telescope Science Institute under U.S. Government grant NAG W-2166. This research has made use of the NASA/IPAC Extragalactic Database (NED) which is operated by the Jet Propulsion Laboratory, California Institute of Technology, under contract with the National Aeronautics and Space Administration. The authors thank Jaron Kurk for his work with the VLA archive data, and the referee, Steve Rawlings, for a very careful consideration of the manuscript and a number of helpful suggestions.
References
- [1977] Adams T. F., 1977, ApJ Supp., 33, 19 [ada77]
- [1964] Adgie R. L., 1964, Nat, 204, 1028 [adg64]
- [1993] Aldcroft T. L., Elvis M., Bechtold J., 1993, AJ, 105, 2054 [ald93]
- [1991] Allington-Smith J. R., Peacock J. A., Dunlop J. S., 1991, MNRAS, 253, 287 [all91]
- [1985] Antonucci R., 1985, ApJ Supp., 59, 499 [ant85]
- [1993] Antonucci R., 1993, ARA&A, 31, 473
- [1995] Baker J. C., Hunstead R. W., Brinkmann W., 1995, MNRAS, 277, 553 [bak95]
- [1989] Barthel P. D., 1989, ApJ, 336, 606
- [1988] Barthel P. D., Miley G. K., Schilizzi R. T., Lonsdale C. J., 1988, A&A Supp., 73, 515 [bar88]
- [1988] Baum S. A., Heckman T. M., Bridle A., van Breugel W. J. M., Miley G. K., 1988, ApJ Supp., 68, 643 [bau88]
- [1962] Bennett A. S., 1962, MemRAS, 68, 163
- [1992] Black A. R. S., Baum S. A., Leahy J. P., Perley R. A., Riley J. M., Scheuer P. A. G., 1992, MNRAS, 256, 186 [bla92]
- [1994] Bogers W. J., Hes R., Barthel P. D., Zensus J. A., 1994, A&A Supp., 105, 91 [bog94]
- [1965] Bolton J. G., Clarke M. E., Ekers R. D., 1965, Aust. J. Phys., 18, 627 [bol65]
- [1966a] Bolton J. G., Ekers J., 1966a, Aust. J. Phys., 19, 471 [bol66a]
- [1966b] Bolton J. G., Ekers J., 1966b, Aust. J. Phys., 19, 559 [bol66b]
- [1966c] Bolton J. G., Ekers J., 1966c, Aust. J. Phys., 19, 713 [bol66c]
- [1966d] Bolton J. G., Ekers J., 1966d, Aust. J. Phys., 19, 275 [bol66f]
- [1966] Bolton J. G., Kinman T. D., 1966, ApJ, 145, 951 [bol66e]
- [1966] Bolton J. G., Shimmins A. J., Ekers J., Kinman T. D., Lamla E., Wirtanen C. A., 1966, ApJ, 144, 1229 [bol66d]
- [1968] Bolton J. G., Shimmins A. J., Merkelijn J. K., 1968, Aust. J. Phys., 21, 81 [bol68]
- [1974] Brandie G. W., Bridle A. H., 1974, AJ, 79, 903 [bra74]
- [1965] Burbidge E. M., 1965, ApJ, 142, 1674 [bur65b]
- [1967a] Burbidge E. M., 1967a, ApJ, 149, L51 [bur67]
- [1967b] Burbidge E. M., 1967b, ApJ, 154, L109 [bur68]
- [1962] Burbidge E. M., Burbidge G. R., Prendergast K. H., 1962, ApJ, 136, 339 [bur62]
- [1966] Burbidge E. M., Kinman T. D., 1966, ApJ, 145, 654 [bur66]
- [1965] Burbidge E. M., Rosenberg F. D., 1965, ApJ, 142, 1673 [bur65a]
- [1969] Burbidge G. R., Burbidge E. M., 1969, Nat, 222, 735 [bur69]
- [1979] Burbidge G. R., Crowne A. H., 1979, ApJ Supp., 40, 583 [bur79]
- [1996] Cimatti A., Dey A., van Breugel W., Antonucci R., Spinrad H., 1996, ApJ, 465, 145
- [1966] Clarke M. E., Bolton J. G., Shimmins A. J., 1966, Aust. J. Phys., 19, 375 [cla66]
- [1997] Cohen M. H., Vermeulen R. C., Ogle P. M., Tran H. D., Goodrich R. W., 1997, ApJ, 484, 193 [coh97]
- [1998] Condon J. J., Cotton W. D., Greisen E. W., Yin Q. F., Perley R. A., Taylor G. B., Broderick J. J., 1998, AJ, 115, 1693 [con98]
- [1985] Dahari O., 1985, ApJ Supp., 57, 643 [dah85]
- [1983] Danziger I. J., Goss W. M., 1983, MNRAS, 202, 703 [dan83]
- [1991] Davis R. J., Unwin S. C., Muxlow T. W. B., 1991, Nat, 354, 374 [dav91]
- [1997] Dey A., van Breugel W. J. M., Vacca W. D., Antonucci R., 1997, ApJ, 490, 698
- [1994] di Serego Alighieri S., Danziger I. J., Morganti R., Tadhunter C. N., 1994, MNRAS, 269, 998 [dis94]
- [1997] Dickinson M., 1997, in Tanvir N. R., Aragón-Salamanca A., Wall J. V., eds, HST and the high redshift Universe. Singapore: World Scientific, p. 207
- [1988] Djorgovski S., Spinrad H., McCarthy P., Dickinson M., van Breugel W. J. M., Strom R. G., 1988, AJ, 96, 836 [djo88]
- [1986] Downes A. J. B., Peacock J. A., Savage A., Carrie D. R., 1986, MNRAS, 218, 31 [dow86]
- [1997] Drinkwater M. J., Webster R. L., Francis P. J., Condon J. J., Ellison S. L., Jauncey D. J., Lovell J., Peterson B. A., Savage A., 1997, MNRAS, 284, 85 [dri97]
- [1989] Dunlop J. S., Peacock J. A., Savage A., Lilly S. J., Heasley J. N., Simon A. J. B., 1989, MNRAS, 238, 1171 [dun89]
- [1985] Eales S. A., 1985, MNRAS, 213, 899
- [1997] Eales S. A., Rawlings S., Law–Green D., Cotter G., Lacy M., 1997, MNRAS, 291, 593
- [1957] Evans D. S., 1957, Cape Atlas of Southern Galaxies [eva57]
- [1974] Fanaroff B. L., Riley J. M., 1974, MNRAS, 167, 31P
- [1992] Fejes L., Porcas R. W., Akujor C. E., 1992, A&A, 257, 459 [fej92]
- [1971] Formalont E. B., 1971, AJ, 76, 513 [for71]
- [1988] Fugmann W., Meisenheimer K., Röser H.-J., 1988, A&A Supp., 75, 173 [fug88]
- [1996] Gallimore J. F., Baum S. A., O’Dea C. P., Pedlar A., 1996, ApJ, 458, 136 [gal96]
- [1990] Giraud E., 1990, A&A, 234, L20 [gir90]
- [1996] Gopal–Krishna Kulkarni V. K., Wiita P. J., 1996, ApJ, 463, L1
- [1962] Greenstein J. L., 1962, ApJ, 135, 679 [gre62]
- [1990] Hammer F., Le Fèvre O., 1990, ApJ, 357, 38 [ham90]
- [1998] Harvanek M., Hardcastle M. J., 1998, ApJ Supp., 119, 25 [hav98]
- [1965] Hazard C., 1965, in Robinson I., Schild A., Schucking E. L., eds, Quasi-stellar sources and gravitational collapse. Chicago: University of Chicago Press, p. 135 [haz65]
- [1972] Hazard C., 1972, ApJ, 11, L139 [haz72]
- [1964] Hazard C., Mackay M. B., Nicholson W., 1964, Nat, 202, 227 [haz64]
- [1963] Hazard C., Mackay M. B., Shimmins A. J., 1963, Nat, 197, 1037 [haz63]
- [1994] Heckman T. M., O’Dea C. P., Baum S. A., Laurikainen E., 1994, ApJ, 428, 65 [hec94]
- [1996] Hes R., Barthel P. D., Fosbury R. A. E., 1996, A&A, 313, 423 [hes96]
- [1991] Hewitt A., Burbidge G., 1991, ApJ Supp., 75, 297 [hew91]
- [1993] Hewitt A., Burbidge G., 1993, ApJ Supp., 87, 451 [hew93]
- [1956] Humason M. L., Mayall N. U., Sandage A. R., 1956, AJ, 61, 97 [hum56]
- [1978] Hunstead R. W., Murdock H. S., Shobbrook R. R., 1978, MNRAS, 185, 149 [hun78]
- [1998] Hutchings J. B., Dewey A., Chaytor D., Ryneveld S., Gower A. C., Ellingson E., 1998, PASP, 110, 111 [hut98]
- [1989] Jauncey D. L., Savage A., Morabito D. D., Preston R. A., 1989, AJ, 98, 54 [jau89]
- [1984] Junkkaranen V. T., 1984, PASP, 96, 539 [jun84]
- [1998a] Kapahi V. K., Athreya R. M., Subrahmanya C. R., Baker J. C., Hunstead R. W., McCarthy P. J., van Breugel W., 1998a, ApJ Supp., 118, 327 [kap98b]
- [1998b] Kapahi V. K., Athreya R. M., van Breugel W., McCarthy P. J., Subrahmanya C. R., 1998b, ApJ Supp., 118, 275 [kap98a]
- [1998] Kellermann K. I., Vermeulen R. C., Zensus J. A., Cohen M. H., 1998, AJ, 115, 1295 [kel98]
- [1966] Kinman T. D., 1966, ApJ, 144, 1232 [kin66]
- [1967] Kinman T. D., Bolton J., Clarke R., Sandage A., 1967, ApJ, 147, 848 [kin67b]
- [1967] Kinman T. D., Burbidge E. M., 1967, ApJ, 148, L59 [kin67a]
- [1970] Kristian J., Sandage A. R., 1970, ApJ, 162, 391 [kri70]
- [1974] Kristian J., Sandage A. R., Katem B., 1974, ApJ, 191, 43 [kri74]
- [1994] Laing R. A., Jenkins C. R., Wall J. V., Unger S. W., 1994, in Bicknell G. V., Dopita M. A., Quinn P. J., eds, The first Stromlo symposium: Physics of active galaxies. Cambridge University Press, Cambridge, p. 201
- [1983] Laing R. A., Riley J. M., Longair M. S., 1983, MNRAS, 204, 151
- [1981] Large M. I., Mills B. Y., Little A. G., Crawford D. F., Sutton J. M., 1981, MNRAS, 194, 693
- [1995] Law-Green J. D. B., Leahy J. P., Alexander P., Allington-Smith J. R., van Breugel W. J. M., Eales S. A., Rawlings S. G., Spinrad H., 1995, MNRAS, 274, 939 [law95]
- [1991] Lawrence A., 1991, MNRAS, 252, 586
- [1986] Lawrence C. R., Bennett C. L., Hewitt J. N., Langston G. I., Klotz S. E., Burke B. F., Turner K. C., 1986, ApJ Supp., 61, 105 [law86]
- [1997] Leahy J. P., Black A. R. S., Dennett-Thorpe J., Hardcastle M. J., Komissarov S., Perley R. A., Riley J. M., Scheuer P. A. G., 1997, MNRAS, 291, 20 [lea97]
- [1984] Lilly S. J., Longair M. S., 1984, MNRAS, 211, 833
- [1967] Lynds C. R., 1967, ApJ, 147, 837 [lyn67]
- [1966] Lynds C. R., Hill S. J., Heere K., Stockton A. N., 1966, ApJ, 144, 1244 [lyn66]
- [1990] Maddox S. J., Sutherland W. J., Efstathiou G., Loveday J., 1990, MNRAS, 243, 692
- [1963] Maltby P., Matthews T. A., Moffet A. T., 1963, ApJ, 137, 153 [mal63]
- [1992] Mantovani F., Junor W., Fanti R., Padrielli L., Browne I. W. A., Muxlow T. W. B., 1992, MNRAS, 257, 353 [man92]
- [1997] Mantovani F., Junor W., Fanti R., Padrielli L., Saikia D. J., 1997, A&A Supp., 125, 573 [man97]
- [1964] Matthews T. A., Morgan W. W., Schmidt M., 1964, ApJ, 140, 35 [mat64]
- [1996] McCarthy P. J., Kapahi V. K., van Breugel W., Persson S. E., Athreya R. M., Subrahmanya C. R., 1996, ApJ Supp., 107, 19 [mcc96]
- [1989] McCarthy P. J., van Breugel W. J. M., Spinrad H., 1989, AJ, 97, 36
- [1987] McCarthy P. J., van Breugel W. J. M., Spinrad H., Djorgovski S., 1987, ApJ, 321, L29
- [1969] Merkelijk J. K., 1969, Aust. J. Phys., 22, 237 [mer69]
- [1978] Miley G. K., 1978, A&A Supp., 34, 129 [mil78]
- [1955] Mills B. Y., 1955, Aus. J. Phys., 8, 368 [mil55]
- [1993] Morganti R., Killeen N. E. B., Tadhunter C. N., 1993, MNRAS, 263, 1023 [mor93]
- [1982] Morton D. C., Tritton K. P., 1982, MNRAS, 198, 669 [mor82]
- [1991] Nan Rendong, Schilizzi R. T., Fanti C., Fanti R., 1991, A&A, 252, 513 [nan91]
- [1995] Neff S. G., Roberts L., Hutchings J. B., 1995, ApJ Supp., 99, 349 [nef95]
- [1985] Owen F. N., O’Dea C. P., Inoue M., Eilek J. A., 1985, ApJ, 294, L85 [owe85]
- [1992] Owen F. N., White R. A., Burns J. O., 1992, ApJ Supp., 80, 501 [owe92]
- [1972] Peterson B. A., Bolton J. G., 1972, ApJ, 173, L19 [pet72]
- [1973] Peterson B. A., Bolton J. G., Shimmins A. J., 1973, Ap. Lett., 15, 109 [pet73]
- [1983] Prestage R. M., Peacock J. A., 1983, MNRAS, 204, 355 [pre83]
- [1993] Price R., Gower A. C., Hutchings J. B., Talon S., Duncan D., Ross G., 1993, ApJ Supp., 86, 365 [pri93]
- [1996] Rhee G., Marvel K., Wilson T., Roland J., Bremer M., Jackson N., Webb J., 1996, ApJ Supp., 107, 175 [rhe96]
- [1989] Riley J. M., 1989, MNRAS, 238, 1055
- [1987] Saikia D. J., Salter C. J., Muxlow T. W. B., 1987, MNRAS, 224, 911 [sai87]
- [1966] Sandage A. R., 1966, ApJ, 145, 1 [san66]
- [1967] Sandage A. R., 1967, ApJ, 150, L145 [san67]
- [1972] Sandage A. R., 1972, ApJ, 178, 25 [san72]
- [1965] Sandage A. R., Veron P., Wyndham J. D., 1965, ApJ, 142, 1307 [san65a]
- [1965] Sandage A. R., Wyndham J. D., 1965, ApJ, 141, 328 [san65b]
- [1982] Savage A., Bolton J. G., Wall J. V., 1982, MNRAS, 200, 1135 [sav82]
- [1976] Savage A., Wall J. V., 1976, Aust. J. Phys. Ap. Supp., N.39, 39 [sav76]
- [1963] Schmidt M., 1963, Nat, 197, 1040 [sch63]
- [1965] Schmidt M., 1965, ApJ, 141, 1 [sch65]
- [1966] Schmidt M., 1966, ApJ, 144, 443 [sch66]
- [1968] Searle L., Bolton J. G., 1968, ApJ, 154, L101 [sea68]
- [1997] Shen Z.-Q., Wan T.-S., Moran J. M., Jauncey D. L., Reynolds J. E., Tzioumis A. K., Gough R. G., Ferris R. H., Sinclair M. W., Jiang D.-R., Hong X.-Y., Liang S.-G., Costa M. E., Tingay S. J., McCulloch P. M., Lovell J. E. J., King E. A., Nicolson G. D., Murphy D. W., Meier D. L., van Ommen T. D., Edwards P. G., White G. L., 1997, AJ, 114, 1999 [she97]
- [1993] Singal A. K., 1993, MNRAS, 262, L27
- [1976a] Smith H. E., Burbidge E. M., Spinrad H., 1976a, ApJ, 210, 627 [smi76b]
- [1980a] Smith H. E., Spinrad H., 1980a, PASP, 92, 553 [smi80a]
- [1980b] Smith H. E., Spinrad H., 1980b, ApJ, 236, 419 [smi80b]
- [1976b] Smith H. E., Spinrad H., Hunstead R., 1976b, ApJ, 206, 345 [smi76a]
- [1976c] Smith H. E., Spinrad H., Smith E. G., 1976c, PASP, 88, 621 [smi76c]
- [1984] Spinrad H., Djorgovski S., 1984, ApJ, 285, L49 [spi84]
- [1985a] Spinrad H., Djorgovski S., Marr J., Aguilar L. A., 1985a, PASP, 97, 932 [spi85a]
- [1985b] Spinrad H., Filippenko A., Wyckoff S., Stocke J., Wagner M., Lawrie D., 1985b, ApJ, 299, L7 [spi85b]
- [1979] Spinrad H., Kron R. G., Hunstead R., 1979, ApJ Supp., 41, 701 [spi79]
- [1976] Spinrad H., Liebert J., Smith H. E., Hunstead R., 1976, ApJ, 206, L79 [spi76]
- [1975] Spinrad H., Smith H. E., Hunstead R., Ryle M., 1975, ApJ, 198, 7 [spi75]
- [1993] Stickel M., Kühr H., 1993, A&A Supp., 100, 395 [sti93b]
- [1993] Stickel M., Kühr H., Fried J. W., 1993, A&A Supp., 97, 483 [sti93a]
- [1996] Swain M. R., Bridle A. H., Baum S. A., 1996, in Hardee P. E., Bridle A. H., Zensus J. A., eds, Energy transport in radio galaxies and quasars. [swa96] ASP Conf. Ser. 100, San Francisco, p. 299
- [1986] Swarup G., Saikia D. J., Beltrametti M., Sinha R. P., Salter C. J., 1986, MNRAS, 220, 1 [swa86]
- [1993] Tadhunter C. N., Morganti R., di Serego Alighieri S., Fosbury R. A. E., 1993, MNRAS, 263, 999 [tad93]
- [1996] Veron-Cetty M.-P., Veron P., 1996, ESO Scientific Report, 17, 1 [ver96]
- [1959] Vorontsov-Vel’yaminov B., 1959, Atlas and Catalogue of Interacting Galaxies, Part 1. Moscow State Univ., Moscow [vor59]
- [1987] Walker R. C., Benson J. M., Unwin S. C., 1987, ApJ, 316, 546 [wal87]
- [1985] Wall J. V., Peacock J. A., 1985, MNRAS, 216, 173
- [1980] Walter H. G., West R. M., 1980, A&A, 86, 1 [wal80]
- [1976] Weedman D. W., 1976, ApJ, 208, 30 [wee76]
- [1998] Willott C. J., Rawlings S., Blundell K. M., Lacy M., 1998, MNRAS, 300, 625
- [1999] Willott C. J., Rawlings S., Jarvis M., 1999, MNRAS: in press
- [1979] Wills B. J., Wills D., 1979, ApJ Supp., 41, 689 [wil79]
- [1981] Wills D., Wills B. J., 1981, Nat, 289, 384 [wil81]
- [1990] Wright A., Otrupcek R., 1990, Parkes Catalogue. Australia Telescope National Facility [wri90]
- [1983] Wright A. E., Ables J. G., Allen D. A., 1983, MNRAS, 205, 793 [wri83]
- [1981] Wroblewski H., Costa E., Torres C., 1981, A&A, 93, 245 [wro81]
- [1965] Wyndham J. D., 1965, AJ, 70, 384 [wyn65]
- [1966] Wyndham J. D., 1966, ApJ, 144, 459 [wyn66]