The emission-line pulse pattern in the intermediate polar RX J0558+53
Abstract
We observed the intermediate polar RX J0558+53 with the 4.2m WHT and find in the pulsed emission lines, a “corkscrew” pattern, which indicates a two-pole white dwarf accretion. The “corkscrew” pattern consists of two emission-line pulses, separated by half the white dwarf spin period, and moving from red to blue velocities. The detected emission-line pulsations have an amplitude of 1.1–2.7 per cent in the He II and Balmer emission lines on the 545-s spin period of the white dwarf which compare to 3.5-4.8 per cent for the continuum double-peak pulsations. We image the emission-line pulse pattern and is shown to lag the continuum pulse by 0.12 spin cycles. We interpret the pattern by invoking an accretion curtain from the disrupted, inner disc to the two poles of the magnetic white dwarf. The semi-amplitude of the He II pulse of 40835 km s-1 can be used to constrain the size of the magnetosphere, km, and the magnetic moment of the white dwarf ( G cm3). Power spectra show dominant frequencies at and which suggest reprocessing of the white dwarf’s illuminating beams in the accretion disc. Finally, the steady He II emission line shows a strong sinusoidal component moving from red to blue on the orbital period, with a width similar to that expected from irradiation of the secondary star. Imaging of the emission lines indicate illuminated locations at the inner side of the red star and the back side of the accretion disc.
keywords:
cataclysmic variables, intermediate polars, magnetic white dwarf, RX J0558+53531 Introduction
Intermediate polars (IPs) form a class of cataclysmic variables and consist of a white-dwarf ‘pulsar’ and a red dwarf companion. The white-dwarf ‘pulsar’ is a magnetic white dwarf ( G), with a rotation period between 33 seconds and a fraction of the binary period, which accretes matter from the red dwarf. The way the gas is directed to the magnetic poles of the white dwarf is unclear; either by the gas stream as in AM Her stars (polars) or via an accretion disc (Lamb 1988). It is generally accepted that for orbital periods hours and low magnetic-moments, G cm3, an accretion disc forms but is truncated at its inner edge by the magnetic field of the white dwarf. Gas from the inner edge of the disc is then funnelled along magnetic field lines onto the poles of the white dwarf (for a review see Patterson 1994 and references therein). The exact accretion pattern is controversial but, assuming that the accretion is disc-fed, several workers now support the ‘accretion curtain’ model as the means the disc feeds gas to the white dwarf (Rosen et al. 1988; Ferrario et al. 1993).
There is considerable interest in these objects because they are strong X-ray sources, the magnetic field strongly influences the accretion flow, and the white dwarf’s spin period can be exploited as a diagnostic probe. In particular, the X-ray searchlight beams from the accreting poles of the white dwarf can be used to probe the accretion flow. RX J0558+53 (V405 Aur) was classified as an intermediate polar (V=14.6 mag), with an orbital period of 4.15 hours, soon after its discovery during the ROSAT all-sky survey (Haberl et al. 1994) which also showed a soft X-ray spectrum more similar to that of polars (Haberl and Motch 1995). Allan et al. (1996) identified the spin period of the white dwarf (545-s) from optical and X-ray modulations at 545 and 272 seconds (see also Skillman 1996). The continuum spin-pulse profile consists of two peaks and the periodogram shows most of the power on the first harmonic (272-s) rather than at the fundamental frequency.
YY Dra (Haswell et al. 1997) and PQ Gem (Hellier et al. 1994) show similar optical double-pulse structure to RX J0558+5353. Weak X-ray double pulses are also seen in GK Per in quiescence (Ishida et al. 1992) and in XY Ari (Kamata and Koyama 1993). The double-pulse structure may be explained by viewing two accreting poles through optically thin accreting regions which show their largest optical depth horizontal to the disc plane. Given the insight, the emission-line pulsations can provide in the accretion pattern, we observed RX J0558+5353 with the aim to resolve sufficiently the spin cycle. Preliminary results show a double-peak pulse in He II (Harlaftis & Horne 1996; Walker et al. 1996 also announced pulses in the Balmer lines; Still et al. 1998).
| Flux | EW | FWHM | |
| 10-13 ergs cm-2 s-1 | Å | km s-1 | |
| H | 4.130.01 | 6041 | 74312 |
| H | 2.090.02 | 1631 | 98922 |
| H | 1.580.02 | 1191 | 91320 |
| He I 6678 | 0.320.03 | 461 | 71412 |
| He I 4713 | 0.100.04 | 142 | 83724 |
| He I 4471 | 0.350.03 | 292 | 88614 |
| He I 4388 | 0.140.03 | 102 | 82326 |
| He II 4686 | 1.680.02 | 1201 | 93318 |
| He II 4542 | 0.150.03 | 132 | - |
| He II 4200 | 0.180.04 | 62 | 87033 |
| C III/N III | 0.340.03 | 272 | 209466 |

2 Observations and Data reduction
We observed RX J0558+5353 for 3 hours with the WHT 4.2m at La Palma on 17 March 1995 (seeing arcsecond). We used the two-arm ISIS spectrograph with TEK CCD chips to cover 6360–6770 Å with a dispersion of 19 km s-1 per pixel and 4100–4900 A at 52 km s-1 pixel-1. The 30-s exposures were designed to sample the 545-s spin cycle with 12 spectra. In total, we obtained 2251 spectra covering binary phases 0.2-1.0. The spectra were reduced using optimal extraction (Horne 1986) after debiasing and flat-fielding the CCD images. Sky subtraction employed polynomials fitted to sky regions on either side of the object. Arc spectra were extracted from the same rows as the object ones. The arc lines drifted by Å during the observations. The wavelength calibration was performed using CuNe and CuAr arc lines for the red and blue spectra, respectively, and is accurate to 0.04 Å. A comparison star had been included in the slit which was subsequently used to correct the object spectra for atmospheric and slit losses. The absolute flux scale was defined by observing the flux standard G191B2B (Oke 1990).
3 The average Spectrum
The average spectrum, displayed in Fig. 1, shows a wealth of emission lines, mainly Balmer, He I and He II lines. Note the red CCD has 3 bad columns which are marked on the red spectrum in Fig. 1. The fν continuum increases redward, rising from 7.150.01 mJy (4130-4180Å) to 8.330.01 mJy (4750-4800Å) to 9.490.01 mJy (6600-6650Å). Table 1 gives the integrated fluxes ( km s-1, equivalent widths, and FWHMs of the emission lines. The Bowen fluorescence lines at C III 4647 and NIII 4640 together with the He II 4686 line indicate a high temperature region (Schachter et al. 1991). In addition to He II 4686, we note He II lines from the Pickering series (see Fig. 1). Odd-numbered lines are seen between the Balmer lines whereas the even-numbered lines of the Pickering series contribute – but less than 13 per cent – to the Balmer-line fluxes. The Pickering series of He II are seen in some AM Her-type systems (Schachter et al. 1991; see also the spectrum of the magnetic nova V1500 Cyg in Horne & Schneider 1989). The flux ratio of the Pickering line, He II 4542, to that of He II 4686 is 0.10. This is within the ratio range 0.10-0.19 found in the AM Her system E2003+225 (Mukai et al. 1986) but very different from case B recombination (0.035; Seaton 1978). Apparently, the density of the emission region must play an important role in this discrepancy. Still et al. (1998) obtained blue spectra of RX J0558+53 in December 1994 and red spectra in February 1995. There is a remarkable difference between our spectra and those of Still et al. The emission-line intensities in March 1995 have increased over those in February 1995 by a factor of 3.3 for the Balmer lines and by 1.9 for He II (see Fig. 1 in Still et al.). The continuum also shows an increase of 1.9 times in the blue but only changes by 15 per cent in the red.

| band | % |
|---|---|
| 0.5-2.0 keV | 12.56.21 |
| 0.1-0.4 keV | 45.40.41 |
| 4700-4750Å | 4.80.2 |
| 6600-6650Å | 3.40.2 |
| He II 4686 | 2.70.1 |
| H | 1.80.1 |
| H | 2.20.1 |
| H | 1.10.1 |
1: Haberl et al. 1994
4 The time series
The time variations are shown in Fig. 2 for the continuum bands 6600-6650 Å and 4750-4800 Å and for the H, H, He II, He I emission lines. Gaps in these light curves show times when arc spectra were obtained. We adopt the following orbital ephemeris (Thorstensen 1997, private communication)
where is the apparent inferior conjunction of the emission-line source (blue-to-red crossing). A correction of 0.1 cycles anti-clockwise (see § 7) to the apparent inferior conjunction of the emission-line source gives the inferior conjunction of the secondary star. In general, emission anisotropies on the disc can move away the inferior conjunction of the emission-line source from the inferior conjunction of the secondary star (see, for example, AE Aqr; Robinson et al. 1991; Welsh et al. 1993).
There is no eclipse or any large variation in the continuum light-curves. However, thirty eight pulses are visible in the continuum light curves with an amplitude of 2-6 per cent in the red and 4-8 per cent in the blue (fitting a sine to all the pulses gives a mean amplitude of 3.4 and 4.8 per cent, respectively). The blue pulses are better resolved than the red (compare, for example, the second segment of the data). In comparison, Ashoka et al. (1995) found a 10.8 per cent modulation in white light. Large variability between spin cycles is visible in many cases, suggesting that the accretion pattern may be variable on very short time-scales. The Balmer and He II lines rise slightly in flux with time. The most clear pulses in the emission lines are visible in He II. Most He II pulses are not in phase with the continuum pulses and some are even in anti-phase (e.g. see last two pulses in the second segment). In § 8, we show that the He II pulses follow behind the continuum pulses by 0.120.02 cycles. A few pulses can be traced in the H and H light curves (see § 7 where the spin pulses are resolved). The He I light curve is also shown though the noise most likely smears the pulsations out of detection.

5 Periodograms: Velocity versus Frequency
IPs are characterized by multiple periods as revealed by analysis of time series data. Fourier analysis is applied on the continuum and emission lines to reveal the periodicities of RX J0558+53 (Scargle 1981). In Fig. 3 (from top to bottom), the power spectra are shown for the red (6600-6650Å) and blue (4750-4800Å) continuum, and the three main emission lines (1000 km s-1). The periodograms are characterized mainly by five peaks at
-
•
7.00.6 cycles day-1, the dominant peak which arises from the orbital frequency (5.8 cycles day-1) and the alias of 7.2 cycles day-1 (total observing period)
-
•
317.9 cycles day-1, the second strongest peak in all power spectra except H. This is the 2 frequency, where is the spin frequency, and corresponds to a period of 271.80.7 seconds, consistent with the result of Allan et al. (1996)
-
•
the side-band frequency at 304.51.0 cycles day-1 which is clearly visible in all periodograms except H. It is strongest in He II and we identify it with the frequency.
-
•
155.71.8 cycles day-1 (554.93.9 seconds) which is clearly visible in the H, H and He II emission lines and is most likely a blend of the frequency (158.5 cycles day-1) and the frequency (152.7 cycles day-1).
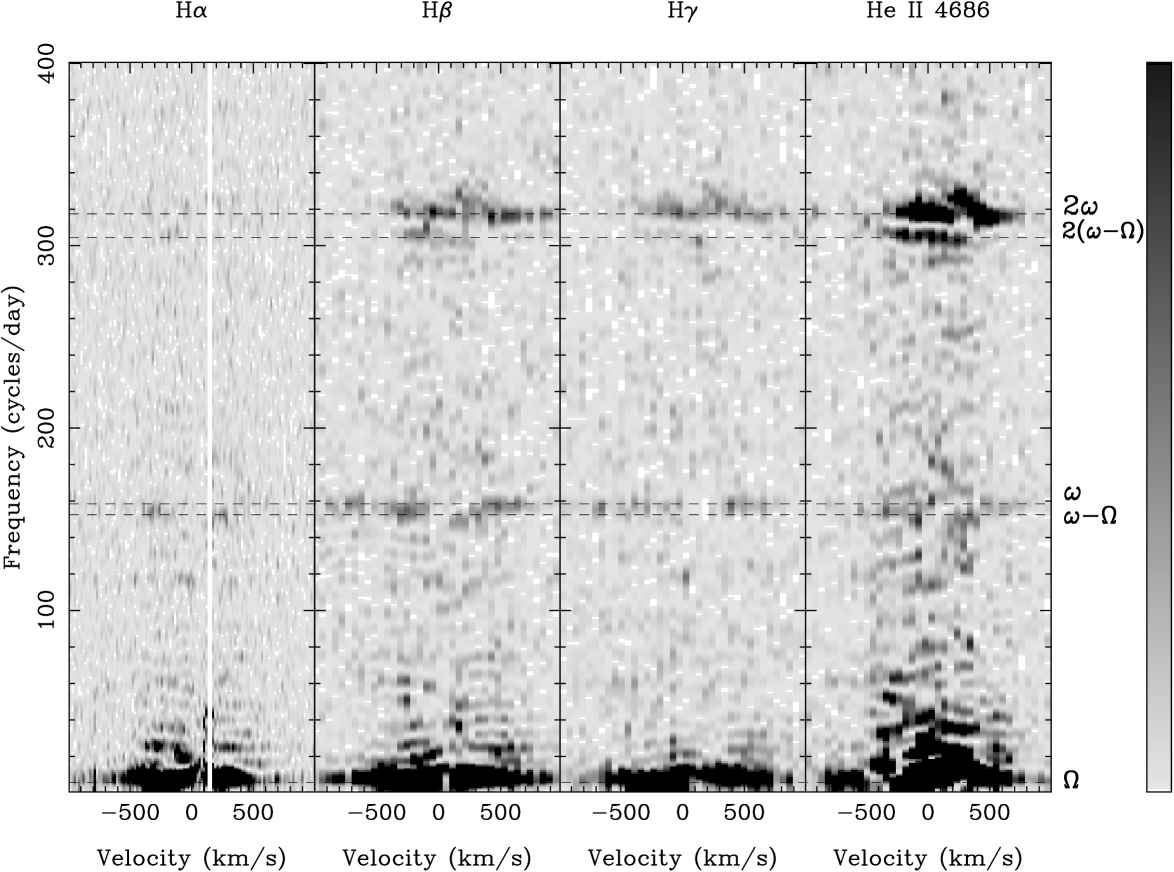
The above values were extracted by fitting Gaussian profiles to the individual periodograms and then averaging them out. The uncertainty is indicative of the 1 scatter of the individual values. Velocity structure on the emission line profiles in Fourier space is resolved by estimating the power spectrum per wavelength bin (19 and 52 km s-1 per pixel for blue and red, respectively). The resulting velocity-frequency diagrams for H, H, H and He II are shown in Fig. 4 (data affected by bad CCD column have been subtracted from the H diagram). Note that the fourier power periodograms in fig. 3 resulted by adding the fourier power periodogram for each pixel of the emission line profile (or continuum range). Aliases, caused by the sampling, are evident at 7.2 and 35-40 cycles day-1. Complex structure is evident at the frequency in H, H and He II but absent in H. There is a broad component of width FWHM km s-1 at –50 km s. There is also a redshifted component, centred at 540 km s-1, at the frequency which, below 350 km s-1, shows an increasing frequency from 318 to 330 cycles day-1. The side-band is clear in He II emission, centred at –25 km -1 with a width of FWHM=508 km s-1 (and possible hints of emission in the Balmer lines). A velocity structure (5) at the frequency 292.41.2 is probably a sideband frequency to 2. Blue and red power components are visible in H (5), H (3) and possibly in H between the and frequencies. The side-band may be seen at +200-300 km s-1 in H, H and He II which coincides with the approximate velocity of the secondary star. A 118 cycles day-1 frequency is also visible at the 3 level in all emission lines. We found no evidence for the second and third harmonics (181.8 and 136.4 seconds). ‘Flickering’ between frequencies 0-2 is visible, particularly in He II. However, most of the flickering, is attributed to aliases of the sampling (e.g. 35-37 cycles/day in H and He II, 23 and 80 cycles/day in He II).
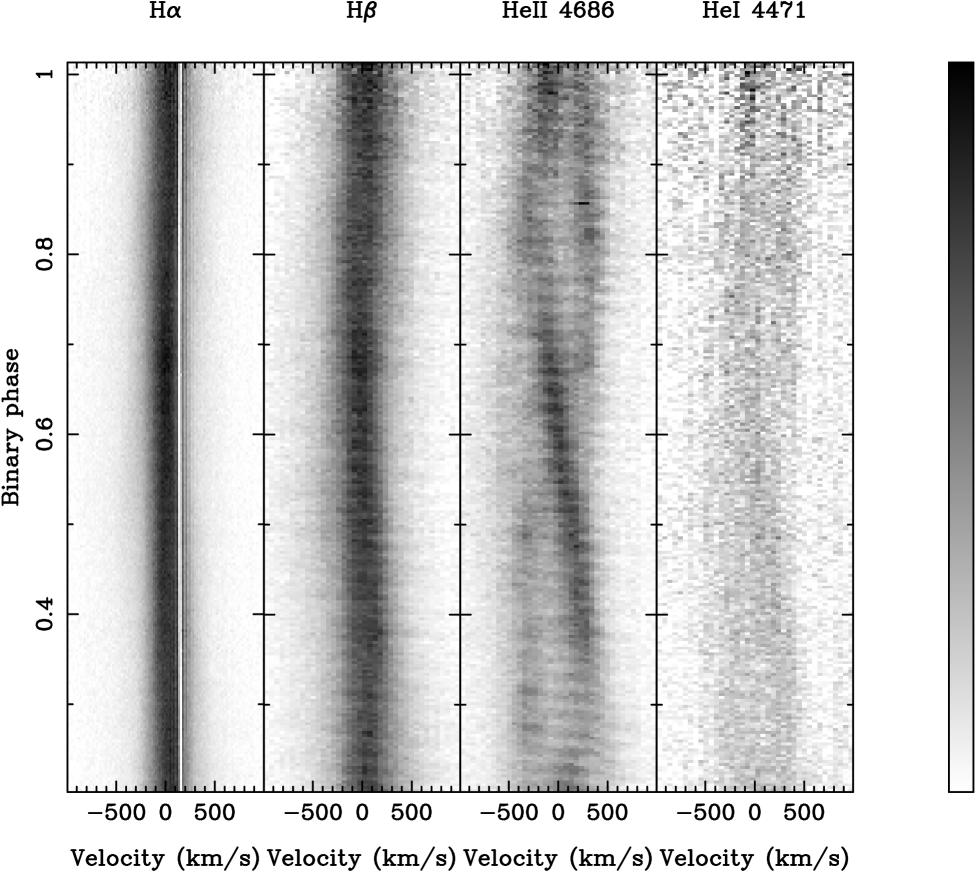
6 The trailed spectra
The trailed spectra of the strongest emission lines are displayed in Fig. 5. H shows a single-peak profile, in contrast to its double-peak profile only a month before our observations (Still et al. 1997). Its flux has also increased over that period of time, thus the double-peak profile may still be embedded into the much stronger single-peak emission component. The bad CCD column, that affects the line profile, can serve as a reference to demonstrate that the binary motion in H is not clearly visible, though evident in the Fourier power spectra. The H profiles show more clearly a single-peak core moving with a low-amplitude velocity. Pulses produced by the rotating beams of the white dwarf are visible on the line profiles. The orbital variation of the He II 4686 profile is complex and very different from that of the Balmer lines. The average He II profile is a double-peak profile (400 km s-1). The trailed spectra then reveal a prominent sinusoidal component which crosses from red to blue at (relative) phase 0.6 (as we will see, absolute phase 0.5) and shows maximum strength between (relative) phases 0.4-0.7. In addition, another emission component is either moving in anti-phase to the previous component or is part of an asymmetric double-peak profile. The He II narrow component shows a broadening of FWHM=23028 km s-1 which is consistent with emission from the Roche lobe of the secondary star (Doppler-broadened km s-1 by the binary motion). We identify this emission with the inner side of the red star. The above suggests that the inferior conjunction of the secondary star (absolute binary phase) leads by 0.1 cycles the emission-line source. The spin pulses in the line profiles are very clear in He II and show the same repetitive pattern (phase shift from red to blue velocities; see § 7). Trace of the red-to-blue, sinusoidal, He II component can also be discerned in the trailed profiles of He I 4471.
7 Doppler maps
We reconstruct images of the emission-line distributions using the Doppler-shifted line profiles (trailed spectra). The Doppler image projected in a particular direction (orbital phase) is a line profile. The back-projection imaging inverts the problem and reconstructs the image from the line profiles (Horne 1991). Examples and techniques of Doppler tomography (using either the linear back-projection or maximum entropy) have been successfully applied in cataclysmic variables and X-ray binaries. The imaging technique has resolved emission within the binary from locations such as the red star (IP Peg; Harlaftis et al. 1994), the gas stream (OY Car; Harlaftis and Marsh 1996a; see here, in particular, for linear back-projection image reconstruction), the bright spot (GS2000+25; Harlaftis et al. 1996b) and culminated recently with the discovery of spiral waves in the outer accretion disc (IP Peg during rise to outburst, Steeghs et al. 1997 IP Peg during outburst maximum, Harlaftis et al. 1998).
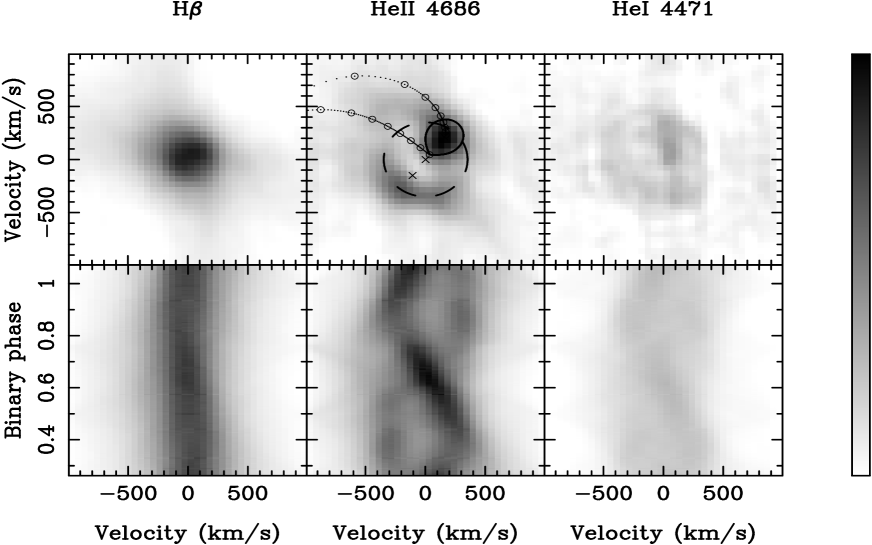
The filtered back-projection images are displayed in Fig. 6. High frequency noise was suppressed by applying a Gaussian smoothing filter with a FWHM equal to km s-1. The H image has a nearly axisymmetric core emission around zero velocity (the same holds also for H). As with the trailed spectra, the He I and He II images are similar but differ from the Balmer-line images. The helium images indicate a spot, associated with the emission component moving from red-to-blue, and also an emission arc/ring which arises from the other component moving in anti-phase. The emission spot is most likely related to the irradiated inner face of the red star, which is not untypical in magnetic CVs (e.g. narrow component in AM Her stars; Smith 1995).
A crude velocity estimate of the He II spot from the Doppler image gives a radial velocity for the inner face of the secondary star of km s-1. Using this estimate as a constraint, we adopt and km s-1 (otherwise arbitrary) and a phase offset of 0.1 cycles clockwise. The path of the gas stream and the Keplerian velocities along the stream are indicated. Some emission between the two trajectories is hinted. The locations of the stars are also marked (see He II image). The emission arc/ring extends clearly over 0.3 cycles and is mainly confined between 250–450 km s-1 (see circle at 350 km s-1 marked on the image). It is located to the back rim of the disc (i.e. away from the red star) since it is related to the emission component moving in anti-phase to the red star component. The bottom panels of the figure present the trailed spectra computed from the images for comparison with the observed data of Fig. 5. The Doppler maps of Still et al. (1998) show that the structure, we reconstruct, is not transient but persists with time (i.e. red star component and back side of accretion disc).

8 The spin pulses
Continuum and emission line pulse profiles folded on the spin period of RX J0558+5353 are presented in Fig. 7. The 251 spectra were binned in 12 phases using the spin ephemeris of Allan et al. (1996)
(the time resolution is such as to resolve the 545-s spin period in 12 spin phases). The continuum pulse shows two peaks per cycle at phases 0 and 0.5 (showing the ephemeris is valid within the errors) and with an amplitude of 0.390.01 mJy (4.70.1 per cent). The emission lines show a single broad peak (with apparent structure) around spin phase 0.5 and a minimum around spin phase 0.0, rather than a double-peak pulse structure. Fitting sines to the emission-line variation, we derive amplitudes of 1.1 per cent for H, 1.8 per cent for H, 2.2 per cent for H and 2.7 per cent in He II (with a typical error of 0.1 per cent). Table 2 presents the pulsation amplitudes for various lines and continuua.
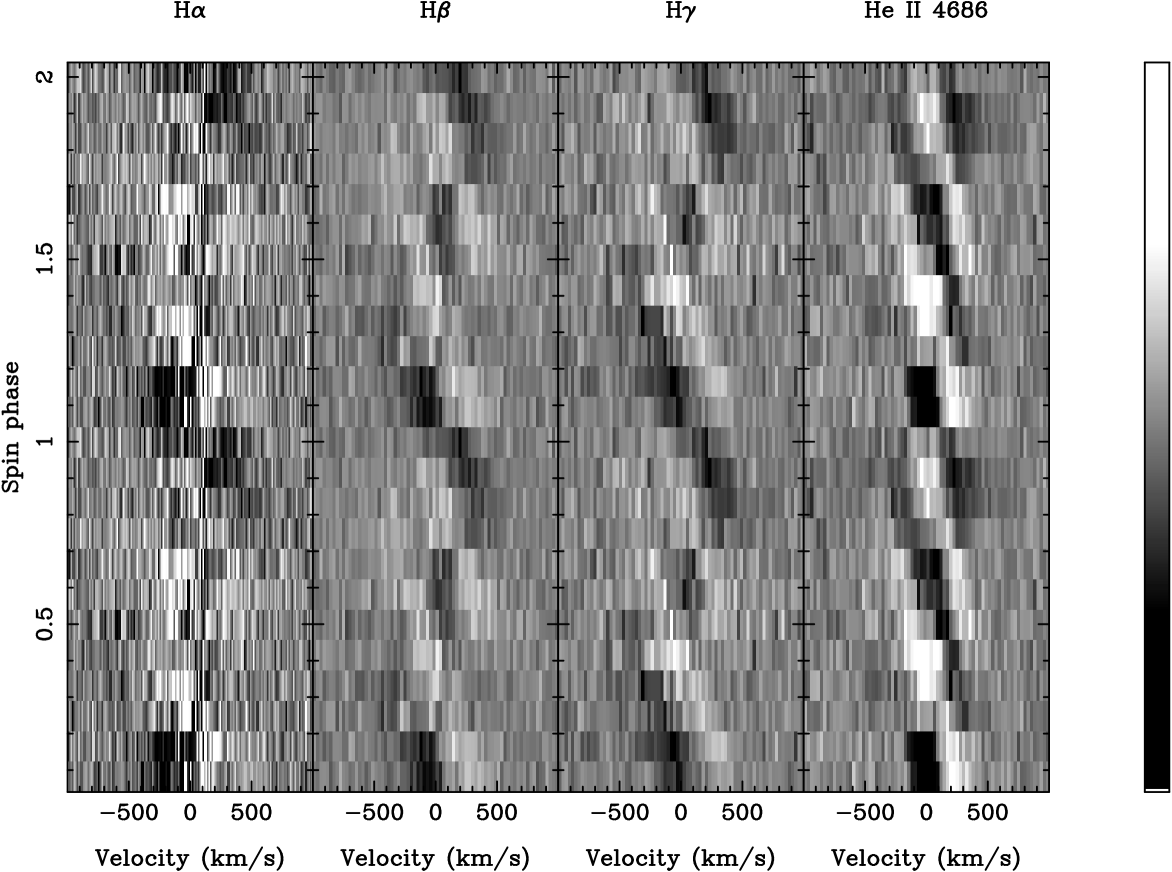
However, the emission-line pulse structure is clarified when we subtract the average from the 12 line profiles binned on the spin period. The result, displayed in Fig. 8, shows the striking pattern of two peaks per cycle crossing the line profile from red to blue. The intensity scale was set between -0.5 and 1.5 mJy in order to maximize the contrast. Note that the intensity scale for all pulse profile figures will be inversed (absorption is “dark”) in comparison to the binary phase figures (emission is “dark”). The double-peak pulse is weakest in H (the bad CCD column is also affecting the trailed spectra) and strongest in He II. The two pulses move from red to blue velocities with spin phase, like a corkscrew, and their integrated flux cause the structure visible at spin phase 0.5 (see Fig. 7). For He II, the two pulses are simultaneously visible between 0.5–0.7 spin phase. There is a slight asymmetry in He II between the two pulse minima (below average level; dark shade). The first complete pulse minimum is longer than the second one in He II, a trend which is reversed in the Balmer lines. Fig. 9 shows the velocities of the He II pulse maxima (‘emission’), extracted using Gaussian fits, as they shift with spin phase. We derive semi-amplitudes by fitting sinusoids (see Table 3). The weighted mean semi-amplitude is km s-1. The He II pulse velocities cross zero at spin phases 0.890.02 and 0.260.07 (from linear fits), indicating a lag behind the continuum pulse by a weighted mean of 0.120.02 cycles. The velocity semi-amplitude of the pulses is 40835 km s-1 and the FWHM is 31817 km s-1 (weighted mean; see also Table 3).
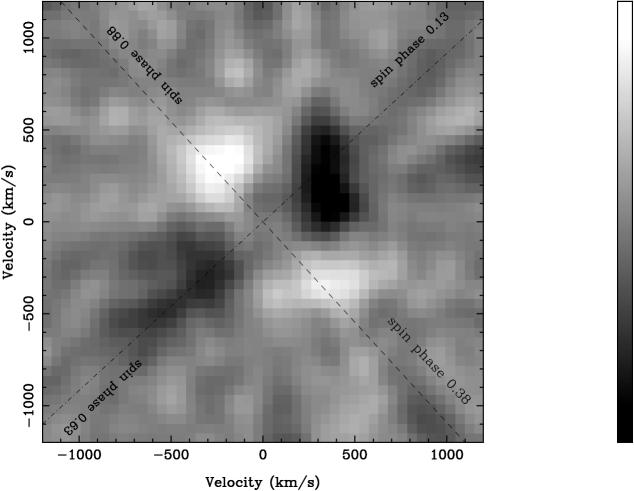
We reconstruct an image of the He II spin pulses using the filtered back-projection technique (with a Gaussian filter of FWHM=62 km s-1 to suppress high frequency noise). Fig. 10 displays an image of the back-projection of the pulse data (“corkscrew” pattern). The figure shows the velocity distribution of the pulsed He II emission, as observed from the white dwarf, and has a ’quadrapole-like’ pattern consisting of maximuma (’bright’) and minima (’dark’) at right angles. The phase direction of the minima and maxima of the two pulses is marked in order to aid the reader. The first pulse minimum and maximum in Fig. 9 is represented by the two right velocity quadrants in Fig. 10. In addition, this image gives an alternative method of confirming our previous measurements. The direction of the two pulse maxima is along the axis defined by the spin phases 0.38 and 0.88, confirming the 0.12 phase lag found with respect to the continuum pulses.
9 Discussion
9.1 Beam illumination of the accretion disc, gas stream and red star
The frequencies detected in the periodograms probe the illuminating effects of the white dwarf’s beams into the binary’s components. For example, lack of the peak suggests that there is an accretion disc (Hellier 1992; Wynn & King 1992). Further, prevalence of the and frequencies indicate both disc- and stream-fed emission from two diametrically-opposed poles with similar emission properties (Norton 1996). Norton (1996) presents a simple model for the X-ray emission based on cosine emission and attenuation components from which he constructs the X-ray light curve and power spectrum (adopting the optical light-curve analysis by Warner 1986). Different combinations of frequencies is then suggestive of specific illuminated patterns. For example, a simple, disc-fed emission has most power in the frequency.
The dominance of the frequencies and (away from the frequency region) suggests that the side-band frequency arises mainly from the beat between the white dwarf rotation and the orbital modulation of the gas stream, which probably encounters the magnetosphere through disc overflow (see King & Lasota 1991 for disc overflow). Note that there is power spread in He II up to the frequency which implies that emission arises from a wide range of periodicities independent of velocity and may represent beam reprocessing in the accretion disc and/or the region close to the white dwarf. The broad He II power component at the frequency, centred at –50 km s, may well arise on the white dwarf. The peculiar red-shifted power structure shows a frequency increase (up to 330 cycles day-1 with decreasing velocity below 350 km s-1, which is seen in H and H as well. Red-shifted components are expected from such a system either from the red star at 25030 km s-1 or from the inwards gas flow to the white dwarf along the magnetic field lines. Any reprocessing signal as seen from the secondary star will appear at a frequency cycles/day. This frequency may be present, redshifted by 30050 km s-1 in He II and possibly in H as well (see Fig. 4).
Indeed, we have identified emission from the red star on the He II Doppler image. The emission arc, extending between 140o–230o, and lying around 350 km s-1, is then part of the accretion disc behind the white dwarf. This may partly coincide with the location of reprocessing evidenced by the side-band . Such a location could be the direct impact of the gas stream on the magnetosphere/inner disc as envisaged through disc overflow (Lubow 1989; Hellier 1993). Lubow finds that the impact location is always between 140o-150o, independent of mass ratios, and lies at a distance of for a mass ratio of ( is the radius of the white dwarf and is the mass of the white dwarf in units of 0.6 . The free-fall velocity at such a distance is km s-1. Based on the above discussion, the arc-like component on the Doppler image may well represent the shocked region (velocities drop from 1700 to 350 km s-1) of the stream overflow onto the transition region of the disc (Keplerian flow to angular velocity of the white dwarf).
| pulse | FWHM | K | ||
|---|---|---|---|---|
| km s-1 | km s-1 | |||
| first | maximum | 31047 | 41341 | 0.890.02 |
| minimum | 319181 | 34971 | 0.560.04 | |
| second | maximum | 32760 | 33968 | 0.260.07 |
| minimum | 411172 | 44841 | 0.110.03 |
∗ : extracted from sinusoidal fits to the data

9.2 The “corkscrew” pattern : A two-pole accretion
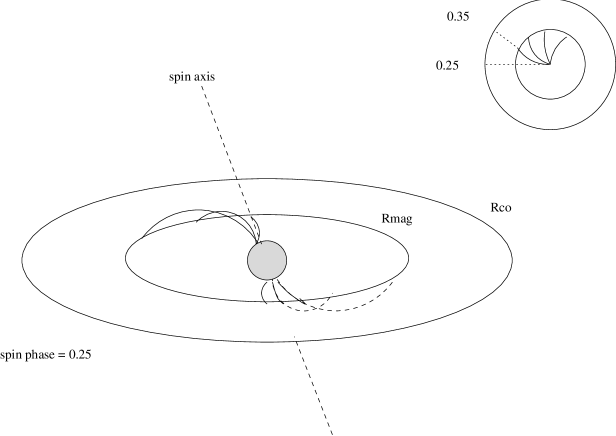
A two-pole accretion model, based on the double-peak pulse profile and the dominance of the first harmonic in the optical and X-ray power spectra, has been proposed for RX J0558+5353 (Allan et al. 1996). Our data show pulses (Fig. 2) which at times are different between odd and even ones. Together with the observation that the power of the emission-line pulses appears mainly at the first harmonic, our spectra corroborate for a two-pole accretion region as well. The He II pulse shows a semi-amplitude of 40835 km s-1. For a Keplerian velocity of 408 km s-1, the location of the He II pulsations would be placed beyond the tidal radius of the accretion disc. In addition, such a location for a highly-ionized region is problematic. He II pulsations are generally related to the transition region between the disc and the magnetic field of the white dwarf (Lamb 1988), and in particular the accretion-curtain model seems plausible to interpret the double-pulse of He II (EX Hya in Rosen et al. 1988; AO Psc in Hellier et al. 1991; see also Fig. 11).
Each pulse maximum in the continuum, most likely, represents illumination of gas by the X-ray rotating beams in a region between the accretion column and the disc’s transition region. Each He II pulse may then represent reprocessed gas slightly further out from the continuum region which is supported by the phase delay of 0.1 spin cycles. For zero phase delay, the continuum and emission regions would lie in the same axis (radial infall). For a phase delay of 0.25 cycles, the corotation velocity of the emission region would be perpendicular to the radial infall of the continuum region. Therefore, the He II emission region lies in a region between corotation and radial infall, and most likely, tracing the magnetic field lines. Such a delay is consistent with the field lines being swept back by the perturbed flow of disc matter.
The nearly symmetric pulses in the continuum indicate accreting poles of equal brightness at anti-diametric locations. The He II pulses are very asymmetric with the first pulse dominating over the second one (flux is higher by a factor of 2). The width of the pulses is identical, 31817 km s-1, which indicates a common origin, and sets upper limits for the broadening mechanism in the He II emission-region, perhaps the scale of turbulence (change from circular motion to quasi-radial) or the sound velocity ( K). While one pulse is in maximum blueshift, the other is in maximum redshift (“corkscrew”) which is entirely consistent with an accretion curtain. The maximum of the first pulse is viewed directly from the (lower) pole whilst the curtain blocks any visibility of the He II region from the upper pole, resulting in the minimum of the second pulse (in the average-subtracted line profiles). This varying view of the two inner parts of the curtain explains the quadrapole-like pattern of the pulsed emission in Fig. 10. Partial overlap of the pulses between spin phases 0.5–0.7 suggests that the azimuthal extent is large enough so that the two He II pulse locations can be viewed simultaneously at times. The phase range of the pulses also suggests that the azimuthal extent of the accretion curtain in the continuum is smaller than that of the He II emission regions (Fig. 7).
9.3 The magnetic moment of the white dwarf
We associate the emission-line pulsations with material which has lost its Keplerian flow due to the magnetic field’s coupling and is most likely close to radial free-fall along the magnetic field lines (see previous discussion about phase delay). Then, the He II emission region will be located within the magnetosphere of the white dwarf and will rotate with the spin period of 545 seconds. This gives
km s-1,
where km s-1, seconds is the spin period. There is no eclipse in the X-ray and optical light curves. On the other hand, the two accreting poles of the white dwarf (double-peak pulse) can be viewed only in high-inclination systems () and this is most likely the case for RX J0558+5353. The pulsations become visible only for favourable orientations of the rotating searchlight beams to the line-of-sight. Truly, this is supported by a correlation between inclination and pulse amplitude (Hellier and Mason 1990). For a free-fall velocity of 408 km s-1/ km s-1, the distance is
km or
from the white dwarf, assuming an inclination of 60o and using km (Hamada & Salpeter 1961). This may well represent the magnetospheric radius where the disc is disrupted, , half the Alfven radius, which gives
km
where is the luminosity in units of ergs s-1 and is the magnetic moment in units of G cm3 (Ghosh and Lamb 1978). The impact of the stream overflow on the disc’s transition region is slightly further out at () and may have lower velocities of 350 km s-1. The corotation radius (Frank et al. 1992), , is larger than the magnetosphere (slow rotator) for accretion to occur.
Haberl et al. (1994) derive an observed luminosity of ergs s-1 from the X-ray flux between 0.1-2.4 keV. Fitting the X-ray spectrum with a blackbody of 57 eV (soft component) and a bremsstrahlung spectrum of 10 keV (hard component) gives a luminosity of ergs s-1 for an absorption column density of H cm-2 (Haberl et al. 1994). This can be used to estimate the magnetic moment of the white dwarf of G cm3 (or MG), assuming a , , pc and a negligible soft X-ray luminosity compared to the hard X-ray component. Such a magnetic moment is not inconsistent with the existence of an accretion disc, evidence for which we found from the periodogram analysis (IPs with G cm3 and orbital periods of hours cannot form discs; Hameury et al. 1986). On the other hand, Haberl and Motch (1995) suggested that RX J0558+5353 resembles AM Her stars from its strong soft X-ray component and may thus provide a link between the high magnetic field intermediate polars (BG CMi and PQ Gem; Penning et al. 1984 and Piirola et al. 1993) and low-magnetic field AM Her stars ( MG; Schwope 1995). This is further strengthened by the presence of the He II Pickering series in the blue spectrum. Thus, the magnetic field of the white dwarf is very likely detectable and should be aimed with future observations.
10 Conclusions
Our observations of the new intermediate polar RX J0558+5353 reveal
-
•
a strong, single-peak H profile in contrast to a much weaker, double-peak profile one month before our observations, indicating a transient H emission, filling in the double-peak profile
-
•
a strong He II emission profile which shows two emission components; one at a semi-amplitude of 25030 km s-1 moving from red-to-blue velocities and with a maximum line strength at zero velocity (irradiated secondary star) and another, moving in anti-phase, with velocities of 350100 km s-1 and related to the back side of the accretion disc
-
•
in addition to the steady line emission, there are double-peak spin pulsation amplitudes of 1.1 per cent in H, 1.8 per cent in H, 2.2 per cent in H and 2.7 per cent in He II
-
•
the dominant frequencies in the spectra are at and the side-band in both the continuum and the emission lines
-
•
the emission-line pulsations lag by 0.120.02 in spin phase relative to the continuum pulsations
-
•
the nearly symmetric pulses in the continuum become very asymmetric in the emission lines with the first pulse dominating over the second one (while they overlap between spin phases 0.5–0.7).
-
•
The two pulses show a distinctive pattern, the “corkscrew” pattern, moving from red to blue, twice per spin cycle. The velocity-phase shift of the He II pulses has a semi-amplitude of km s-1 and a FWHM of 31817 km s-1. The former gives an estimate of the size of the magnetosphere, km, and the magnetic moment of the white dwarf of G cm3.
The system’s inclination, the angle between the orbital and magnetic axes and asymmetries in the accretion flow, such as azimuthal extent and optical depth variations as viewed from different angles, can be combined to model the observed He II pulses. In particular, the velocity-frequency periodograms provide a powerful probe into the accretion pattern which still has to be understood and modelled.
Acknowledgments
The observations were taken under the SERVICE programme on the William Herschel Telescope which is operated by the Royal Observatories of the United Kingdom at the Spanish Observatorio del Roque de los Muchachos of the Institute de Astrofisica de Canarias. The data reduction and analysis was carried out at the St. Andrews STARLINK node. Use of MOLLY, an interactive binary analysis package, developed largely by T. Marsh, is acknowledged.
References
- [1] Allan A., Horne K., Hellier C., Mukai K., Barwig H., Bennie P. J., Hilditch R. W., 1996, MNRAS, 279, 1345
- [2] Ashoka B. N., Marar T. M. K., Seetha S., Kasturirangan K. K., Bhattacharyya J. C., 1995, A&A, 297, L83
- [3] Oke J. B., 1990, AJ, 99, 1621
- [4] Frank J., King A. R., Raine, D. J., 1992, Accretion Power in Astrophysics, CUP:Cambridge, p. 126
- [5] Ferrario L., Wickramasinghe D. T., King A. R., 1993, MNRAS, 260, 149
- [6] Ghosh P., Lamb F. K., 1978, ApJ, 223, L83
- [7] Ishida M., Sakao T., Makishita K., Chashi T., Watson M G., Norton A J., Kawada M., Koyama K., 1992, MNRAS, 254, 647
- [8] Hamada T., Salpeter E. E., 1961, ApJ, 134, 683
- [9] Hameury J. M., King A. R., Lasota J. P., 1986, MNRAS, 218, 695
- [10] Harlaftis E. T., Marsh T. R., Charles P. A., Dhillon V. S., 1994, 267, 473
- [11] Harlaftis E. T., Marsh T. R., 1996a, A&A, 308, 97
- [12] Harlaftis E. T., Horne K., Filippenko A. V., 1996b, PASP, 108, 762
- [13] Harlaftis E. T., Horne K., 1996, IAU Colloquium 163, Accretion Phenomena and Related Outflows, eds. D. T. Wickramasinghe, L. Ferrario, G.V. Bicknell, ASP Conference Series, Vol. 121, 715
- [14] Haswell C A., Patterson J., Thorstensen J R., Hellier C., Skillman D R., 1998, ApJ, 476, 847
- [15] Haberl F., Thorstensen J. R., Motch C., Schwarzenberg-Czerny A., Pakull M., Shambrook A., Pietsch W., 1994, A&A, 291, 171
- [16] Haberl F., Motch C., 1995, A&A, 297, L37
- [17] Hellier C., Mason K. O., 1990, in: Accretion-Powered Compact Binaries, ed. C. Mauche, Cambridge University Press, p. 185.
- [18] Hellier C., Mason K. O., Smale A. P., Kilkenny D, 1990, MNRAS, 244, 39p
- [19] Hellier C., Cropper M., Mason K. O., 1991, MNRAS, 248, 233
- [20] Hellier C., Mason K. O., Williams O. R., 1992, MNRAS, 258, 457
- [21] Hellier C., 1992, MNRAS, 258, 578
- [22] Hellier C., 1993, MNRAS, 265, L35
- [23] Hellier C., Ramseyer T. F., Jablonski F. J., 1994, MNRAS, 271, L25
- [24] Horne, K., 1986, PASP, 98, 609
- [25] Horne K., Schneider D. P., 1989, ApJ, 343, 888
- [26] Horne K., 1991, in Proceedings of the 12th North American Workshop on Cataclysmic Variables and Low Mass X-ray Binaries, ed. A. W. Shafter (San Diego: SDSU Press), p. 23
- [27] Kamata Y., Koyama K., 1993, ApJ, 405, 307
- [28] King A. R., Lasota, J. P., 1991, ApJ, 378, 674
- [29] Lamb D. Q., 1988, in Polarized Radiation of Circumstellar Origin, ed. G. V. Coyne et al., Vatican Observatory Press, p. 153
- [30] Liebert J., Stockman H. S., 1985, in: Cataclysmic Variables and Low-Mass X-ray Binaries, p. 151, eds Lamb D. Q & Patterson J., Reidel, Dordrecht, Holland
- [31] Lubow S. H., 1989, ApJ, 340, 1064
- [32] Marsh T. R., Duck S. R., 1996, New Astronomy, 1, 97
- [33] Mukai K., Bonnet-Bidaud J.-M., Charles P. A., Corbet R. H. D., Maraschi L., Osborne J. P., Smale A. P., Treves A., van der Klis M., and van Paradijs J., 1986, 221, 839
- [34] Norton A. J., 1996, MNRAS, 280, 937
- [35] Rosen S. R., Mason K. O., 1988, 231, 549
- [36] Patterson J., 1994, PASP, 106, 209
- [37] Penning W. R., Schmidt G. D., Liebert J., 1986, ApJ, 301, 85
- [38] Piirola V., Hakala P., Coyne G. V., 1993, ApJ, 410, L107
- [39] Seaton M. J., 1978. MNRAS, 185, 5p.
- [40] Thorstensen J. R., Charles P. A., Bowyer S., Briel U. G., Doxsey R. E., Griffiths R. E., Schwartz D. A., 1979, ApJ, 233, L57
- [41] Reinsch K.,, 1994, A&A, 281, 108
- [42] Robinson E. L., Shafter A. W., Balachandran S., 1991, ApJ, 374, 298
- [43] Scargle J. D., 1982, ApJ, 263, 835
- [44] Schachter J., Filippenko A. V., Kahn S. M., and Paerels F. B. S., 1991, ApJ, 373, 633
- [45] Schwope A. D., 1995, Review in Modern Astronomy, 8, 125
- [46] Skillman D., R., 1996, PASP, 108, 130
- [47] Smith R. C., 1995, Cape Workshop on Magnetic Cataclysmic Variables, eds. D. A. H. Buckley and B. Warner, ASP Conference Series, Vol. 85, San Francisco, 417
- [48] Still M., Duck S. R., Marsh T. R., 1998, MNRAS, 299, 759
- [49] Steeghs D., Harlaftis E. T. & Horne K., 1997, Nature, submitted
- [50] Walker K. A., Garnavich P. M., Noriega-Crespo A., 1996, Bulletin of AAS, 189.7606
- [51] Warner B., 1986, MNRAS, 219, 347
- [52] Welsh W. F., Horne K., Gomer R., 1993, ApJ, 410, L39
- [53] Wynn G. A., King A. R., 1992, MNRAS, 255, 83