Spiral shocks in the accretion disc of IP Peg during outburst maximum
Abstract
In response to our recent discovery of spiral arms in the accretion disc of IP Peg during rise to outburst, we have obtained time-resolved spectrophotometry of IP Peg during outburst maximum. In particular, indirect imaging of He II 4686, using Doppler tomography, shows a two-arm spiral pattern on the disc image, which confirms repeatability over different outbursts. The jump in He II intensity (a factor of more than two) and in velocity (200–300 km s-1) clarifies the shock nature of the spiral structure. The He II shocks show an azimuthal extent of 90 degrees, a shallow power-law emissivity , an upper limit of 30 degrees in opening angle, and a flux contribution of 15 per cent of the total disc emission. We discuss the results in view of recent simulations of accretion discs which show that spiral shocks can be raised in the accretion disc by the secondary star.
keywords:
cataclysmic variables, accretion disc, IP Pegasi1 Introduction

High-energy phenomena such as jets emanating from AGNs and X-ray radiation emitted from binaries are related to accretion discs. Accretion discs are the most efficient machines for the extraction of energy and angular momentum. The physical conditions that lead to specific dynamical formations in discs, such as spiral arms, are not contained as yet due to lack of observational constraints. Spiral structure in galaxies is attributed to a quasi-stationery wave which triggers star formation as it propagates through the disc (Bertin et al. 1989) or a tidal pattern due to interaction with a satellite galaxy (e.g. M51; Toomre and Toomre 1972). Spiral waves in a disc have also been invoked to explain the proximity of giant extra-planets to their orbiting stars (e.g 51 Peg; Lin et al. 1996). Moreover, spiral shocks have been found in simulations of protosolar discs and have been proposed as a means of converting the gaseous protostellar disc into orbiting planetesimals (Boss 1997). Accretion discs in cataclysmic variables (a white dwarf accretes matter from a donor K-M star) evolve on short dynamical timescales (2-10 hours) allowing us to investigate in detail their development. In cataclysmic variables, the outburst origin in dwarf novae (disc or donor star) and the mechanism for the angular momentum transport of the disc material (‘viscosity’) are still unresolved issues though fundamental in our understanding of accretion physics (Verbunt 1986). The exact structure of the disc, an -disc (Shakura and Synyaev 1973) or a spiral-shock disc (Sawada, Matsuda & Hachisu 1986), is linked to the above issues. Simulations of such accretion discs have revealed double spiral shocks (Sawada, Matsuda & Hachisu 1986; Savonjie, Papaloizou and Lin 1994; Stehle 1998). Recently, we indirectly detected spiral waves in the accretion disc of the eclipsing dwarf nova IP Peg during the rise to outburst (Steeghs, Harlaftis, Horne 1997). Here, we report on subsequent observations of He II 4686, during maximum of the November 1996 outburst, which were aimed to probe the ionization structure of the spiral arms.
2 Observations
IP Peg, a double-eclipsing dwarf nova, shows semi-periodic outbursts every 3 months. During the third day of the November 1996 outburst (Fig. 1), we observed a complete binary cycle of 3.8 hours. We obtained 81 spectra, under arcsecond seeing, with a TEK CCD and the 235 camera of the Intermediate Dispersion Spectrograph on the 2.5m Isaac Newton Telescope at La Palma. The wavelength range covered is 4354–4747 Å at a velocity dispersion of 27 km s-1 per pixel. The spectra were extracted using optimal extraction (Horne 1986) after debiasing, flat-fielding and sky-subtraction. The wavelength calibration was performed using 17 CuAr arc lines and a 3rd order polynomial fit and is accurate to 0.04Å. A comparison star had been included in the slit which was subsequently used to correct the object spectra for atmospheric and slit losses. The absolute flux scale was defined by observing the flux standard Feige 15 (Oke 1990). Typical signal to noise ratio is 21 for the IP Peg spectra (and 46 for the comparison spectra). Flux uncertainties were estimated using Poisson statistics and a noise model for the CCD chip (gain of 1.1 electrons per ADU and readout noise of 5.7 electrons per pixel). We adopt the binary ephemeris from Wolf et al. (1993) , where is the inferior conjunction of the white dwarf. The He II flux ratio of 0.022-0.036, as well as the He I flux ratio flux ratio of 0.71-0.87 (see also Marsh and Horne 1990), are consistent with recombination case B (for T = 5,000-20,000 K and electron density of cm-3; Osterbrock 1989). Given that the He I is blended with the Mg II line, the above ratio is only a lower limit, thus favouring the temperatures nearer to 20,000 K.
3 Resolving Spiral waves with Doppler tomography
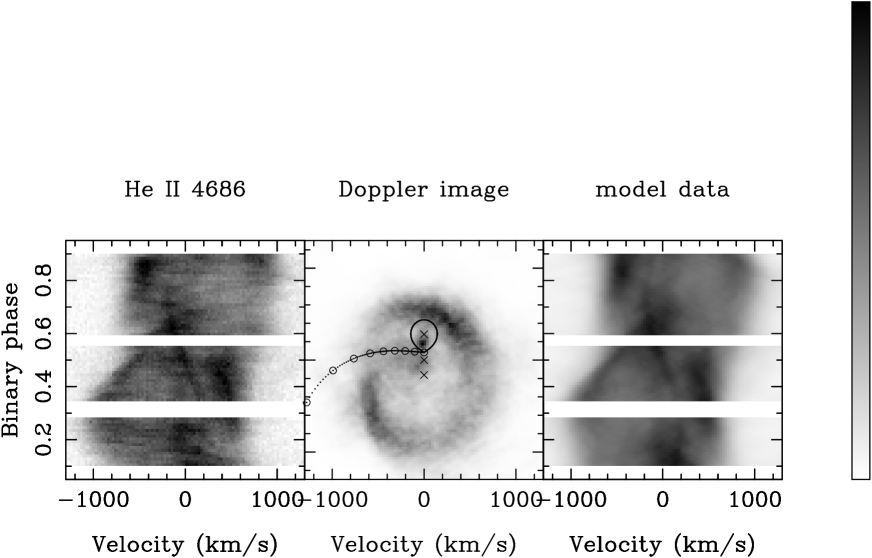
The trailed spectra of the strongest emission line, He II, show very complex structure (left panel in Fig. 2). The peak separation changes with phase and is narrower at phase 0.50. The red peak of the profile is maximum at phases 0.45 and 0.95 where it has a velocity of 400 and 650 km s-1, respectively. Similarly, the blue peak has a clear maximum at phase 0.85 and a velocity of 500 km s-1. Other weaker components are immediately visible; a sharp component moves from red to blue at phase 0.5 (red star emission) and a low-velocity component is present at phases around 0.2 and 0.9. We reconstruct the Doppler image of the He II 4686 emission-line distribution using the trailed spectra (Marsh and Horne 1988). This imaging technique has been particularly successful in resolving the location of emission components such as the red star (IP Peg; Harlaftis et al. 1994), the gas stream (OY Car in outburst; Harlaftis and Marsh 1996), the bright spot (GS2000+25; Harlaftis et al. 1996) and spiral waves in the outer accretion disc (from H and He I lines of IP Peg during rise to outburst; Steeghs, Harlaftis and Horne 1997).
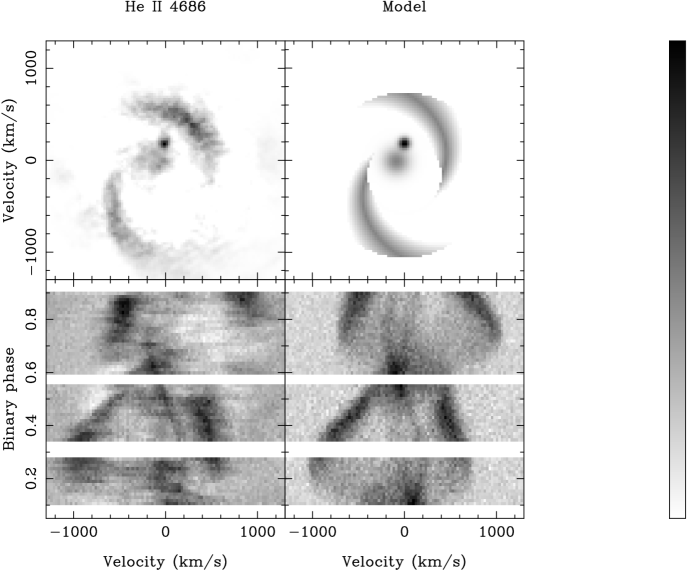
The He II Doppler image of IP Peg during outburst (centre panel of Fig. 2) directly displays the locations of the various emission components; the inner side of the red star, a low-velocity component and the dominant accretion disc with extended spiral arms. For comparison with the observed data, the computed data from the image are also shown (right panel). The low-velocity component is centred at km s-1 and has a FWHM of 270 km s-1 and although is seen in other dwarf novae during outburst its origin is not understood (Steeghs et al. 1996). In Fig. 3 we display the non-axisymmetric data and Doppler image for comparison with a model. The non-axisymmetric Doppler image (top-left) is built by subtracting the median at each radius with the white dwarf at its centre. A simple model of spiral arms (plus a red star and a low-velocity component; top-right) is built by using a power law of for the intensity, velocities between 400 to 800 km s-1 and azimuthal extent of 0.25 binary cycles. The computed data from the model (bottom-right; with the same noise content as the data) reconstruct successfully all the velocity features observed, such as the decreasing double-peak separation with an intensity jump at phase 0.6. The Bowen blend, He I 4471 and Mg II 4481 lines produce similar Doppler images.

4 Discussion
The high-ionization He II 4686 line is most suitable to clarify the shock nature of the resolved spiral structure, since it is sensitive to higher temperatures and is not saturated as H may be. We quantify the properties of the spiral structure by taking radial slices starting from the white dwarf at (0,-147) km s-1 for each azimuth and then search for the velocity for which the image intensity reaches its maximum value. The result is then to trace the centre of the spiral arms with azimuth, maximum intensity (bottom) and velocity at that image value, relative to the white dwarf (top). The two peaks in both velocity and intensity correspond to the spiral arms. In particular, the jump in intensity (a factor of more than two) and velocity (200–300 km s-1) is the characteristic signature for a shock. The shocks show an azimuthal extent of 90 degrees (phases 0.50–0.75 and 0.95–1.25) and a very shallow power-law index in emissivity ( or assuming a Keplerian disc). The spiral shocks contribute about 15 per cent of the total disc emission and their opening angle is degrees by assuming Keplerian flow (which places a firm upper limit). The Mach numbers at the shocks range between 28–50 for K and velocities between 400–700 km s-1. There are differences between the two arms: the arm centred at phase 0.65 (bottom-left arm on Doppler image) is weaker in intensity (by 40 per cent) than the arm centred at phase 0.05. Also, the velocity range is 400–700 km s-1 compared to 400–550 km s-1 and the radial width is 40 per cent shorter compared to the FWHM=240 km s-1 of the arm at phase 0.05. Note that in the above we have discussed the velocities related to the maximum intensities of the image. The Doppler image shows that there is also some emission at velocities up to 1000 km s-1 (or 850 km s-1 relative to the white dwarf).
Spiral arms have now been observed in 3 different outbursts of IP Peg (this work; 1993 August outburst in Steeghs, Harlaftis and Horne 1997; 1987 July outburst in Marsh & Horne 1990 where, in retrospect, only limited evidence for spiral structure can be discerned due to the incomplete binary coverage). The trailed spectra obtained by Hessman (1989) immediately after the end of an outburst of IP Peg do not show any structure other than the red star ‘S’-wave component. We tested this by adjusting our He II spectra to the instrument and time resolution of the Hessman spectra (195 km s-1 and 12 phase bins, respectively). The signal-to-noise is similar since the red star line component is visible. The spiral shocks can still be resolved in the simulated trailed spectra suggesting that the shocks either are tightly wound up or may have dissipated by the time the system has reached quiescence after an outburst. Spiral structure in systems other than IP Peg can also be found, such as in SS Cyg during outburst (see Helium lines in Figures 7, 9 and 10; Steeghs et al. 1996) and in the H trailed spectra of LB1800 (Still et al. 1998, Steeghs et al. 1998, in preparation). No evidence of spiral shocks is observed in short-period SU UMa-type stars, such as OY Car during outburst (Harlaftis and Marsh 1996), SU UMa and YZ Cnc in outburst or quiescence (Harlaftis 1991). Therefore, it may be possible that the spiral shocks only develop in systems above the period gap where the disc, the companion star and the mass transfer rate are larger. Doppler maps of X-ray binaries do not show any evidence of spiral shocks (outburst of GRO J0422+32, Casares et al. 1995; quiescent map of A0620-00, Marsh et al. 1994; quiescent map of GS 2000, Harlaftis et al. 1996). Only H spectra of X 1822-371, the prototype system for vertical disc structure, may contain a hint of some structure similar to spiral shocks (Harlaftis et al. 1997).
SPH simulations of the IP Peg accretion disc do show the development of transient spiral shocks (Armitage and Murray 1998) which agree quite well with the observed ones in velocity and azimuthal extent. Stehle (1998) uses hydrodynamical simulations of a hot accretion disc ( K, ) which confirm the deployment of stable spiral shocks in the disc over many orbital cycles (see also Steeghs and Stehle 1999). Fitting of the He II spiral shock data (Fig. 4) with model data extracted from simulated discs should eventually constrain the physical conditions of the disc such as the local Mach number and effective temperatures. We are aiming to obtain similar coverage at the end of an outburst (to complete our coverage), so that we have a full picture of the dynamical evolution of the tidal shocks. In particular, the effect of a decreasing parameter (outburst decline) on the velocity range, opening angle and azimuthal extent of the spiral shocks.
Acknowledgments
The data reduction and analysis was partly carried out at the St. Andrews STARLINK node. Use of software developed by T. Marsh is acknowledged. ETH was supported by the TMR contract RT ERBFMBICT960971 of the European Union. ETH and DS were partially supported by a joint research programme between the University of Athens, the British Council at Athens and the University of St. Andrews. DS acknowledges support by a University of St. Andrews research studentship. In this research, we have used, and acknowledge with thanks, data from the AAVSO International Database, based on observations submitted to the AAVSO by variable star observers worldwide.
References
- [1] Armitage P J, Murray J R., 1998, MNRAS, 297, L81
- [2] Bertin G C., Lin C., Lowe S A., Thurstans R P. 1989, ApJ, 338, 104
- [3] Boss A., 1997, Science, 276, 1836
- [4] Casares J., Marsh T R., Charles P A., Martin A C., Martin E L., Harlaftis E T., Pavlenko E P., Wagner R M., 1995, MNRAS, 274, 565
- [5] Harlaftis E T., 1991, Disc structure and variability in dwarf novae, Ph. D. Thesis, Oxford University
- [6] Harlaftis E T., Marsh T R., Charles P A., Dhillon V S., 1994, 267, 473
- [7] Harlaftis E T., Marsh T R., 1996, A&A, 308, 97
- [8] Harlaftis E T., Horne K., Filippenko A V., 1996, PASP, 108, 762
- [9] Harlaftis E T., Charles P A., Horne K., 1997, MNRAS, 285, 673
- [10] Lin D N C., Bodenheimer P., Richardson D C., 1996, Nature, 380, 606
- [11] Marsh T R., Horne K., 1988, MNRAS, 235, 269
- [12] Marsh T R., Horne K., 1990, ApJ, 349, 593
- [13] Marsh T R., Robinson E L., Wood J., 1994, MNRAS, 266, 137
- [14] Horne K., 1986, PASP, 98, 609
- [15] Hessman F V., 1989, AJ, 98, 675
- [16] Oke J. B., 1990, AJ, 99, 1621
- [17] Osterbrock, D E., 1989, Astrophysics of Gaseous Nebulae and Active Galactic Nuclei, University Science Books: Mill Valley, p. 81
- [18] Savonjie G. J., Papaloizou J. C. B., Lin C, 1994, MNRAS, 268, 13
- [19] Sawada K., Matsuda T., Hachisu I., 1986, MNRAS, 219, 75
- [20] Shakura N. I., Synyaev R. A., 1973, A&A, 24, 337
- [21] Steeghs D., Harlaftis E T., Horne K., 1997, MNRAS, 290, L28
- [22] Steeghs D., Horne K., Marsh T R., Donati J F., 1996, MNRAS, 281, 626
- [23] Steeghs D., Stehle R., 1999, MNRAS, submitted
- [24] Stehle R., 1998, MNRAS, in press
- [25] Still M D., Buckley D A H., Garlick M A., 1998, MNRAS, 299, 545
- [26] Toomre, A. & Toomre, J. 1972, ApJ, 178, 623
- [27] Verbunt F., 1986, in Physics of Accretion onto Compact Objects, Lecture Notes in Physics, Vol. 226, eds. K. O. Mason, M. G. Mason, and N. E. White, Springer-Verlag, Heildelberg, p. 59
- [28] Wolf S., Mantel K H., Horne K., Barwig H., Schoembs R., Baernbantner O., 1993, A&A, 273, 160